
There is an established ritual in corporate finance where a company makes an immense amount of money, spends an even more astonishing amount of money on custom silicon, and then buys back its own stock so that everyone feels comfortable pretending the cash never left the building.
Meta Platforms, Inc. (META) has perfected this art. If you glance at the surface-level metrics, the business appears to be a frictionless money-printing apparatus. Revenue sits at $228.25 billion, gross margins are an enviable 81.75%, and net profit margins clock in at 29.83%. Mark Zuckerberg can point to $68.10 billion in GAAP net income and tell institutional asset managers that digital advertising remains the greatest commercial tollbooth ever devised.
Then you look at the cash flow statement, and things get weird.
Behind the curtain of headline profitability, Meta has transformed itself from an asset-light software platform into an industrial infrastructure utility. In doing so, it has constructed an aggressive capital allocation treadmill: spending billions to retire shares to offset employee equity grants, issuing tens of billions in debt, and pouring nearly half of its gross revenue directly into data center concrete and graphics processors.
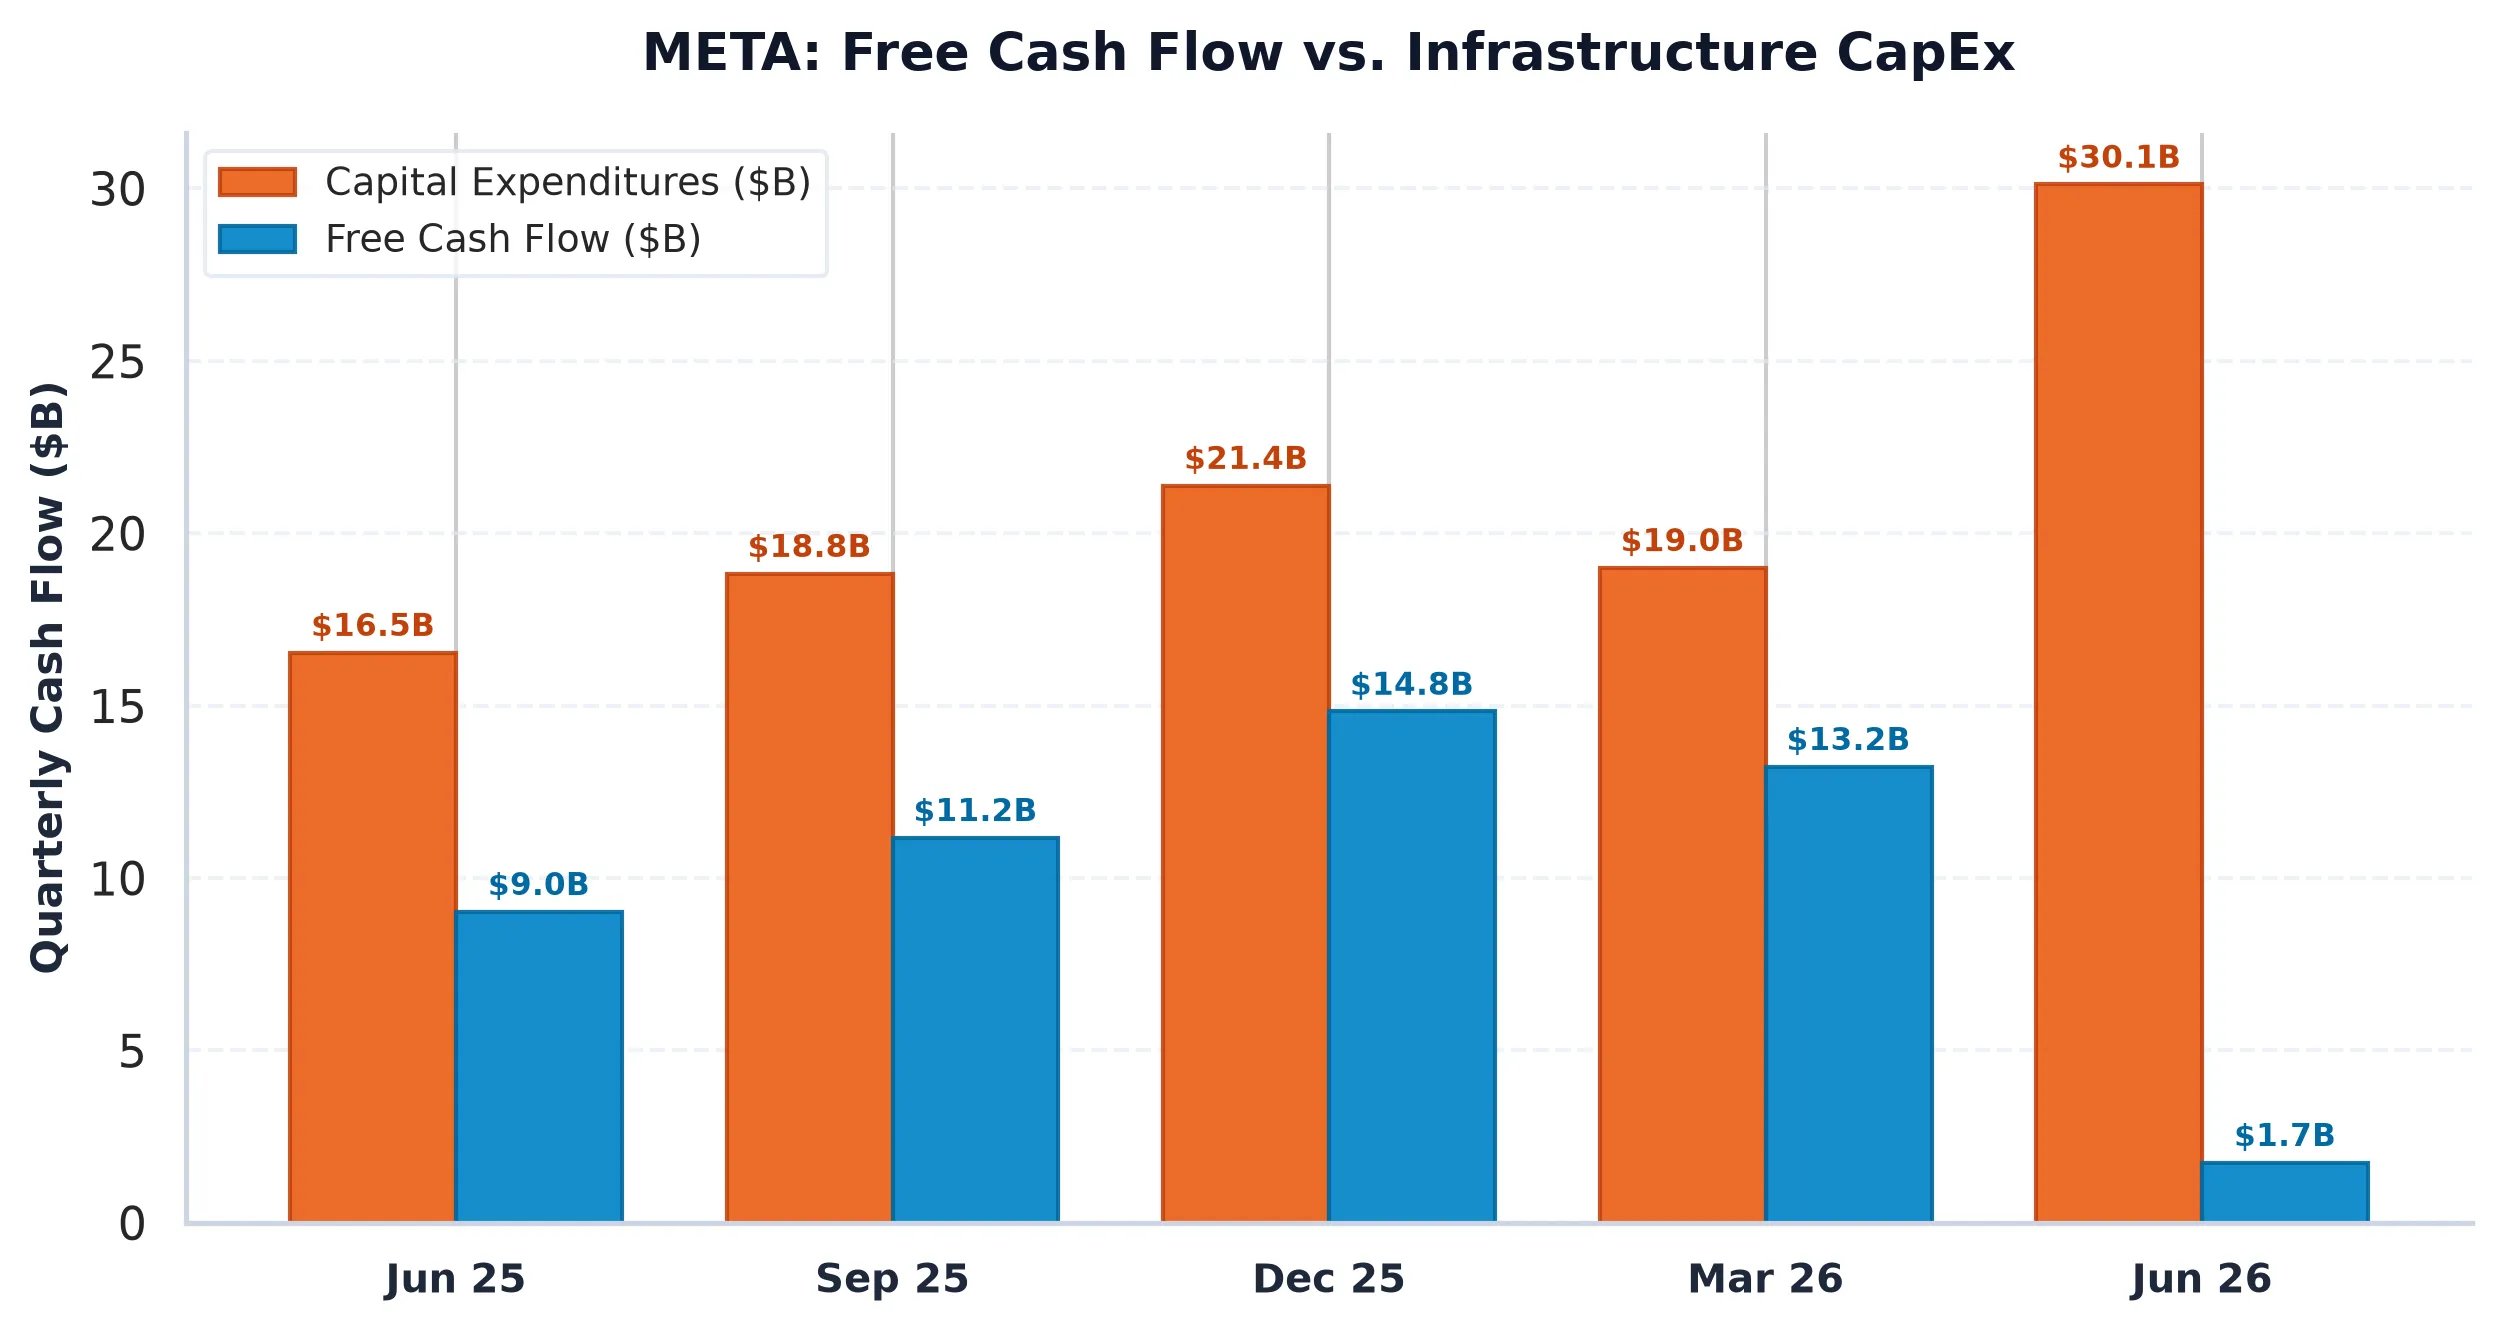
The $108 Billion Hardware Tax
The central tension inside Meta today is not whether Instagram can monetize short-form video. It can. The real question is why a software business requires $108.75 billion in capital expenditures over a trailing twelve-month window.
Meta’s capital intensity ratio, measured as capital expenditures divided by total revenue, has spiked to 47.64%. For context, traditional capital-intensive heavyweights like railroad operators, telecom utilities, and semiconductor foundries routinely run CapEx-to-revenue ratios between 18% and 30%. Meta is directing nearly forty-eight cents of every dollar that enters its door straight into data centers, networking hardware, and custom computing clusters.
Operating Cash Flow:       ~$130.30B
Less: Capital Expenditures: -$108.75B (47.64% of Revenue)
------------------------------------
True Free Cash Flow:        $21.55B
This staggering outlay compresses what should be an extraordinary cash gusher into just $21.55 billion of true Free Cash Flow (FCF). On an equity market capitalization of $1.81 trillion, that yields an FCF yield of 1.19%.
Operating in a macroeconomic regime where the 10-Year U.S. Treasury yield sits at 5.10% makes this valuation math difficult to reconcile. When risk-free sovereign debt yields 5.10%, Meta’s equity free cash flow yield delivers a spread of negative 3.91%. In the institutional fixed-income universe, you demand an equity risk premium to account for technological obsolescence, regulatory fines, and cyclical ad recessions. Meta equity holders, by contrast, are paying a 391 basis-point penalty for the privilege of funding Mark Zuckerberg’s compute cluster.
Balance Sheet Transformation: From Fortress to Debtor
For the first decade of its public life, Meta operated with a balance sheet that resembled a Scrooge McDuck vault. It carried virtually zero long-term debt and hoarded cash like an existential safeguard.
A forensic inspection of the company’s recent regulatory filings shows that this balance sheet purity is gone. As disclosed in the Form 10-Q filed for the second quarter of 2026, total debt has climbed to $112.32 billion. Against this obligation, Meta holds $90.26 billion in total cash and liquid equivalents.
The resulting net debt position is $22.06 billion. While a Net Debt to EBITDA ratio of 0.20x is comfortably manageable and poses zero near-term solvency risk, the strategic pivot is unmistakable. Meta is no longer self-funding all of its ambitions solely through operational retained earnings. It is accessing public debt markets, locking in elevated corporate coupon rates, and carrying leverage in order to maintain its simultaneous commitments to hyper-scale CapEx and share repurchases.
| Financial & Capital Allocation Metric | Meta Platforms, Inc. (META) | Institutional Benchmark / Context |
|---|---|---|
| Share Price / Market Capitalization | $709.33 / $1.81 Trillion | Mega-Cap Hyperscaler |
| Trailing P/E / Forward P/E | 26.73x / 20.48x | S&P 500 Forward P/E: ~21.5x |
| Annual Revenue / YoY Growth | $228.25 Billion / +28.00% | High-Growth Core Ad Engine |
| Capital Expenditures (CapEx) | $108.75 Billion | CapEx Intensity: 47.64% of Revenue |
| Reported Free Cash Flow | $21.55 Billion | Downward compression from CapEx |
| Free Cash Flow Yield | 1.19% | Negative 3.91% vs 10Y Treasury (5.10%) |
| Gross Margin / Operating Margin | 81.75% / 34.83% | Software gross, industrial operating |
| Total Debt / Total Cash | $112.32B / $90.26B | Flipped to Net Debt of $22.06 Billion |
| Put/Call Open Interest Ratio | 0.86 | Balanced Institutional Positioning |
| Max Pain Strike | $745.00 (+5.03% from spot) | Natural Expiration Magnet |
Table 1: Institutional Capital Allocation and Valuation Matrix. Source: SEC EDGAR Disclosures and Market Pricing.
The Buyback Treadmill
When executive management announces a multi-billion-dollar share repurchase authorization, the market generally reacts as though management has decided to walk down to the trading floor and hand investors envelopes stuffed with cash.
The forensic reality of mega-cap technology buybacks is often far more mundane: they function as a synthetic operating expense to disguise stock-based compensation (SBC).
To retain world-class machine learning researchers, systems architects, and infrastructure engineers, Meta issues billions of dollars in restricted stock units annually. If the company did not buy back its shares, the total diluted share count would march steadily higher, diluting public shareholders and dampening GAAP earnings per share.
Instead, Meta steps in, allocates tens of billions of dollars to market repurchases, and retires shares at peak-multiple valuations. The economic effect is striking: cash leaves the corporate treasury to purchase equity that is effectively handed out to employees to keep them from walking over to a rival lab.
Because the accounting rules allow stock-based compensation to be added back to operating cash flow, this circular flow creates an optical illusion of abundant operational cash generation. If you treat stock compensation as the genuine economic cash expense that it is, Meta’s true economic free cash flow compresses even further.
Options Plumbing: The $750 Magnet
While long-term fundamental investors grapple with CapEx intensity and negative yield spreads, the equity derivatives market is enforcing short-term order through structural plumbing.
Trading at $709.33, Meta faces a tightly wound options market structure. Total call open interest sits at 99,314 contracts against put open interest of 84,937 contracts, establishing a Put/Call ratio of 0.86. This reflects a balanced institutional posture, neither excessively euphoric nor heavily hedged.
Call Resistance Walls: $750 (7,433 OI) | $760 (5,015 OI) | $800 (8,770 OI)
Current Spot Price:    $709.33
Max Pain Strike:       $745.00 (+5.03%)
Put Support Walls:     $750 (12,971 OI) | $740 (4,085 OI) | $580 (6,091 OI)
The derivatives landscape reveals a massive structural node at the $750 strike. The primary Put Wall sits at $750 with 12,971 contracts, while the secondary Call Wall also clusters at $750 with 7,433 contracts. This heavy dual-sided open interest makes the $750 level a massive volatility sponge.
Meanwhile, Max Pain is calculated at $745.00, roughly 5.03% above current market prices. In the absence of an external macroeconomic shock, dealer gamma hedging profiles suggest that spot prices will experience strong mechanical upward drift toward this $745 to $750 magnet zone heading into front expirations.
With 30-day implied volatility at 29.54%, the modeled 30-day expected move spans plus or minus $60.08, or approximately 8.47%. This sets an immediate structural trading range between $649 and $769, neatly bound by the institutional $800 Call Wall above and the deep $580 Put Wall below.
Capital Allocation Verdict
Meta Platforms remains an exceptional commercial enterprise. Its core advertising engine delivers 28% top-line growth and absorbs massive pricing power. However, an activist or forensic audit cannot overlook the shifting risk architecture.
When an operating company re-engineers its capital structure by moving into net debt, directs nearly half of its gross revenue into rapidly depreciating computing hardware, and returns a free cash flow yield that lags risk-free Treasuries by nearly 400 basis points, the margin of safety evaporates.
If generative AI infrastructure yields a durable, high-margin software revenue layer over the next three years, Meta’s $108 billion bet will be remembered as an act of visionary capital deployment. If instead advanced silicon becomes commoditized merchant capacity, the company will face a painful reckoning of asset write-downs and margin contraction. Until that economic return manifests, the current valuation prices in absolute perfection while ignoring the physical cost of carry.
Meta Platforms, Inc. (META)
Trailing P/E
Marcus Wolfe Screen
Leverage Profile
30D Channel
Pristine cash flow conversion (1.92x) and healthy accrual ratio (-15.12%). Zero accounting anomalies detected (LOW ANOMALY RISK).
Manageable liability structure relative to institutional cash flow.
Evaluated against 5.10% US 10-Yr Benchmark (FCF Spread: -3.91% (vs 10Y Yield of 5.10%)).
Max Pain: $745.00 (+5.03%) | P/C Ratio: 0.86 | 30D Channel: $658.49 – $760.16.
$652.58 – $680.95 (-4% to -8% Pullback Accumulation)
Sustained weekly close below $638.39 (-10.0% structural stop) or fundamental cash flow deterioration.