
Every few years, when Tesla, Inc. (TSLA) encounters the mundane financial realities of global automobile manufacturing, market commentators propose a grand corporate restructuring to reset the narrative clock. The latest consensus chatter dominating financial headlines centers on speculative commentary suggesting a potential $420 per share buyout or merger between Tesla and Space Exploration Technologies Corp., widely known as SpaceX (SPCX).
It is a remarkably theatrical narrative. SpaceX completed its initial public offering on Nasdaq in June 2026, providing retail and institutional investors with a clear public market valuation for both entities. The commentary suggests that if electric vehicle margins face secular pressure and automotive operating margins compress toward 1.41%, combining the electric vehicle pioneer with an orbital launch platform could solve both balance sheet and valuation challenges at once.
To evaluate this consensus narrative, one must move past television commentary and look directly at fundamental balance sheets, capital intensity metrics, and options market plumbing.
The Financial Mechanics Behind the Narrative
On paper, Tesla remains an extraordinary corporate entity. The company commands a market capitalization of $1.45 trillion, trading at a trailing price-to-earnings ratio of 340.8x and a forward multiple of 169.7x. Enterprise value stands at $1.37 trillion, supported by a net cash balance of $27.44 billion, comprising $43.52 billion in total cash against $16.08 billion in total debt.
Yet, from a cash flow perspective, the capital efficiency picture requires careful scrutiny. Tesla generated $4.84 billion in free cash flow over the trailing twelve months on $103.62 billion in total revenue. This yields a free cash flow yield of just 0.33%. In a macroeconomic climate where the US 10-Year Treasury bond offers a risk-free rate of 5.14%, holding equity in Tesla implies a negative equity risk premium spread of -4.80%.
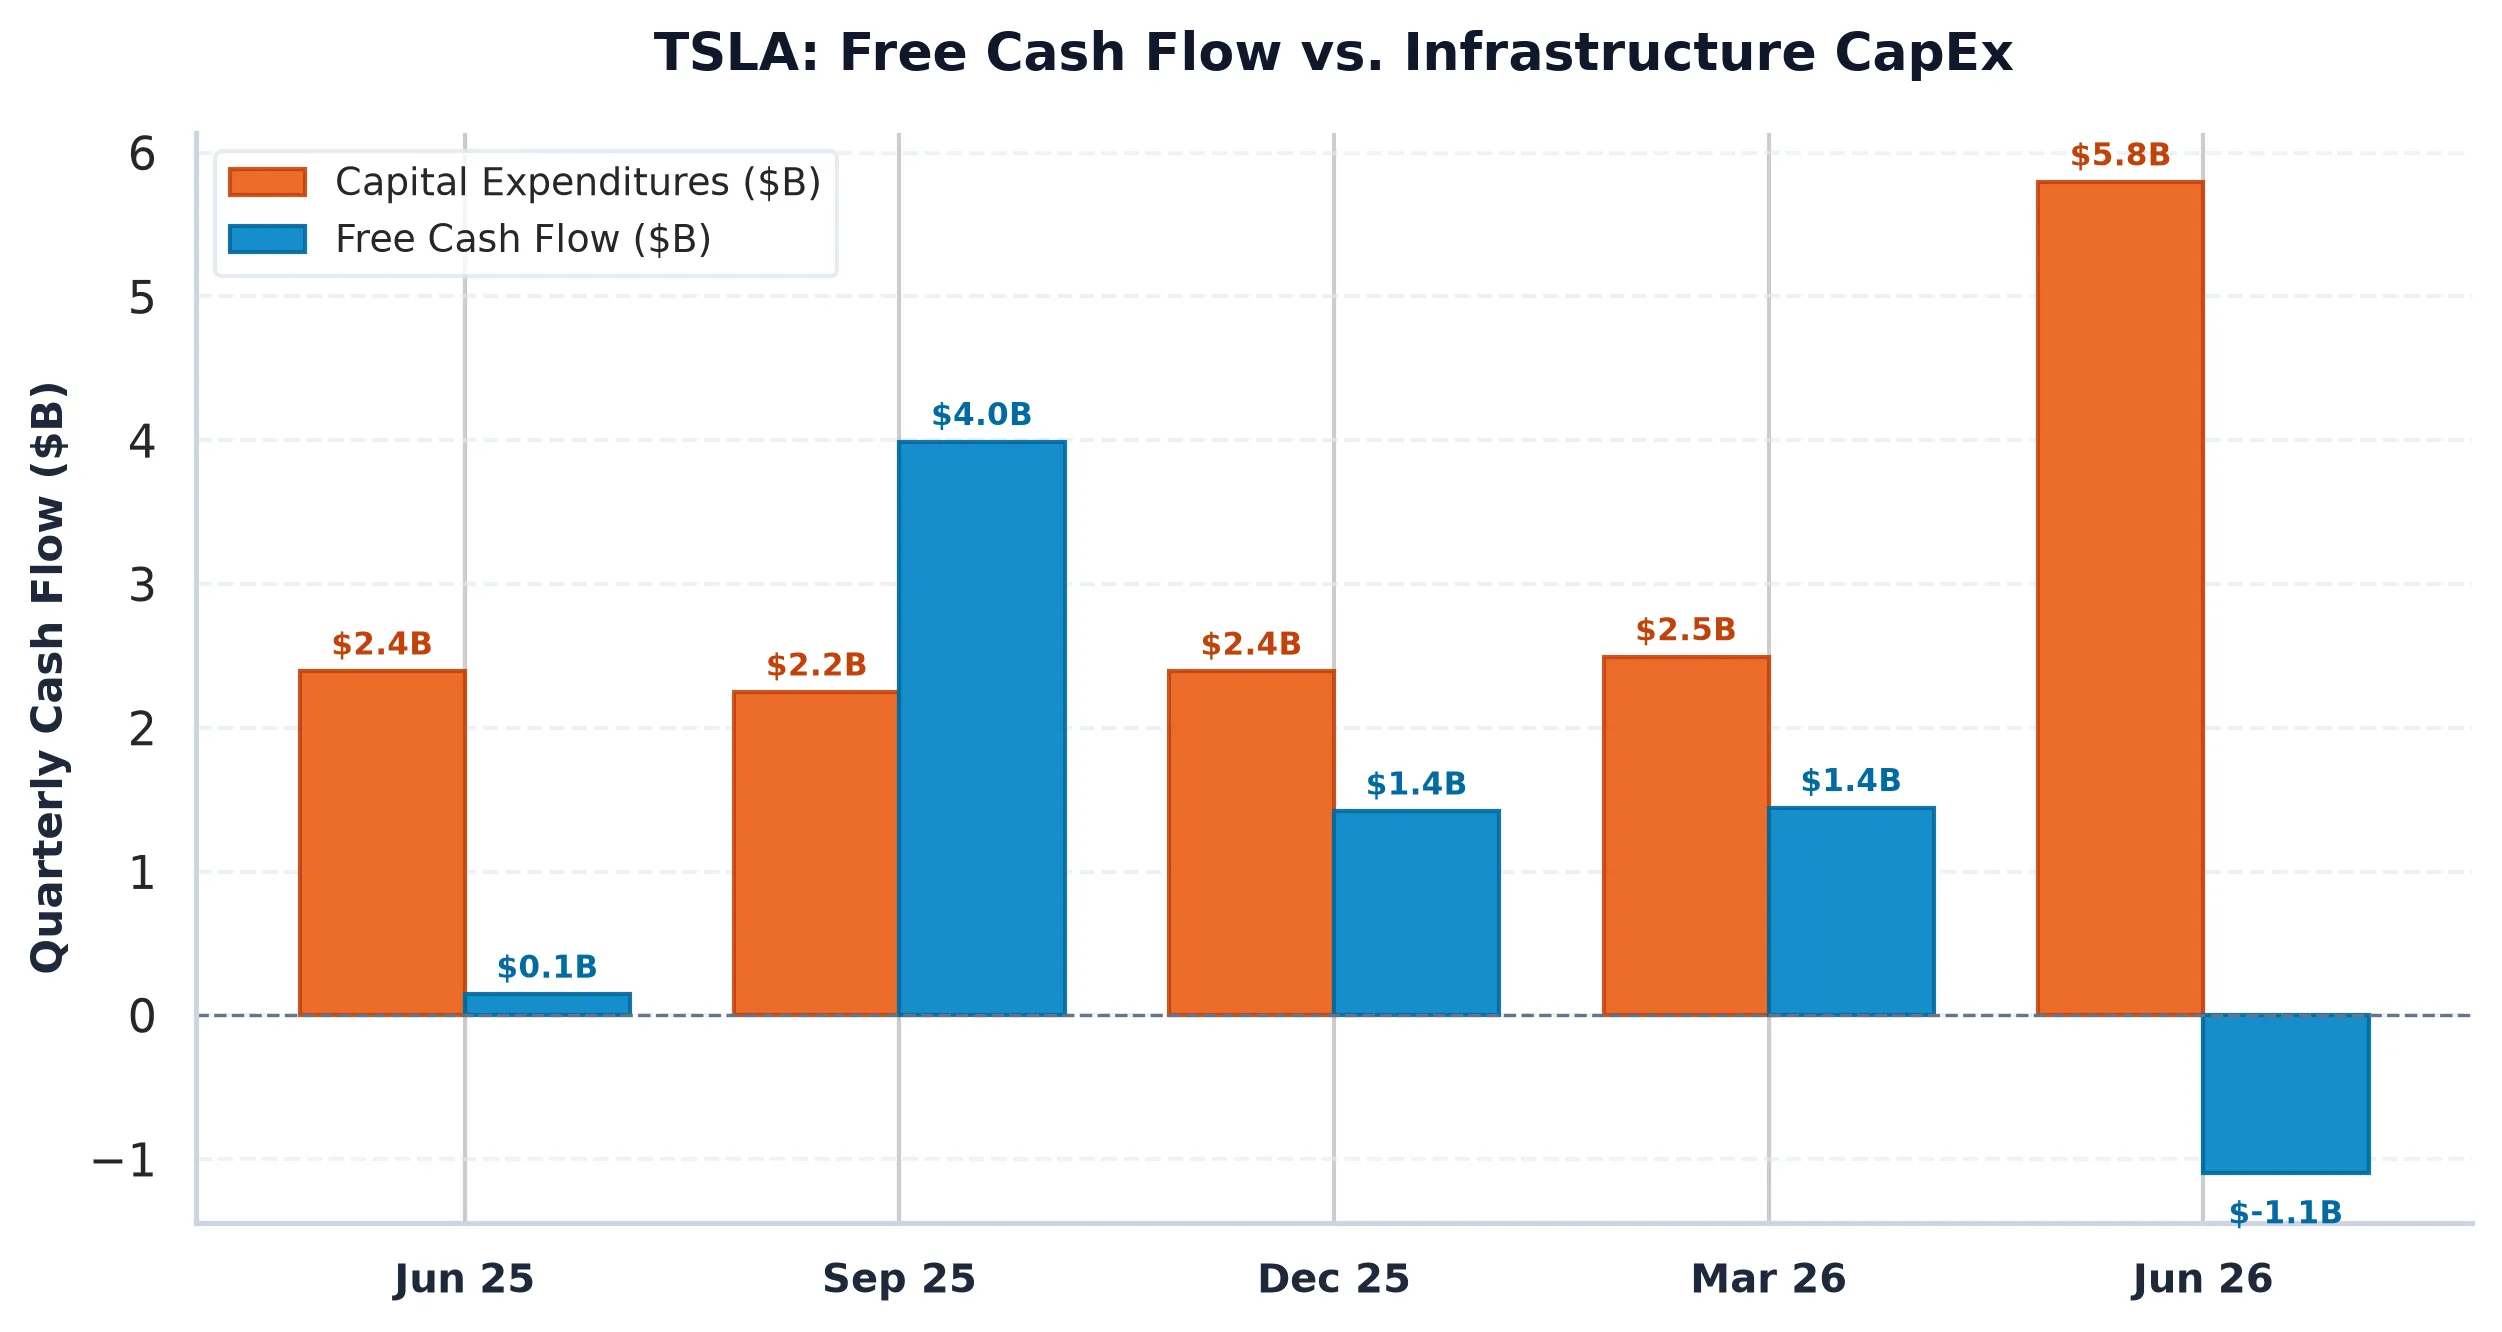
Capital intensity remains substantial. Over the trailing twelve months, Tesla deployed $13.85 billion in capital expenditures, translating to a CapEx-to-revenue ratio of 13.37%. When an industrial manufacturer reinvests over 13% of its top-line revenue into physical plant, equipment, and computing infrastructure while generating a 1.41% operating margin and a 4.67% return on equity, narrative expansion becomes an essential tool for maintaining equity duration.
Dissecting Proxy Filings and Operational Realities
Supporters of the merger thesis point to recent corporate proxy disclosures and board governance updates, interpreting standard regulatory preparation as evidence of an imminent transaction. However, primary disclosures in official Form 10-K and Form 8-K regulatory filings reflect conventional corporate governance, executive compensation structuring, and standard risk disclosure ahead of quarterly earnings releases.
From a fundamental consumer discretionary perspective, merging two distinct capital-intensive public enterprises presents clear integration hurdles. Automobile manufacturing requires continuous factory maintenance, high customer financing support, and cyclical inventory management. Combining an automotive entity with an orbital rocket provider does not reduce battery pack manufacturing costs or alter retail vehicle loan rates.
What the Derivatives Market Is Pricing
While financial media debates the likelihood of a multi-hundred-billion-dollar corporate combination, the options market is pricing an entirely different outcome: structural stability and tight range-bound trading.
Across front-week option expirations, open interest data displays a balanced Put/Call ratio of 0.71, with call open interest at 314,384 contracts compared to 222,258 puts. The market Max Pain strike sits at $362.50, approximately 1.51% below Tesla’s current equity price of $368.06.
================================================================================
OPTIONS MARKET STRUCTURE & GAMMA PROFILE: TSLA
================================================================================
Current Spot Price:          $368.06
Max Pain Strike:             $362.50 (Distance: -1.51%)
Put/Call Open Interest Ratio: 0.71 (Calls: 314,384 | Puts: 222,258)
Primary Call Resistance:     $370 / $380 / $400
Primary Put Support:          $130 / $180 / $220
30-Day Implied Volatility:   5.35%
Expected 30-Day Move:        +/- $5.63 (+/- 1.53%)
Market Structure Bias:       Balanced Dealer Gamma / Pinning at Max Pain
================================================================================
Institutional options position distribution reveals heavy Call Walls overhead at $370, $380, and $400, which act as immediate mechanical caps on upside momentum. On the downside, primary Put Walls are positioned lower at $220, $180, and $130, establishing broad structural buffers.
With a 30-day implied volatility of 5.35%, the options market is projecting a 30-day price movement of just +/- $5.63 (+/- 1.53%). Options market makers are not positioning for an acquisition announcement or a sudden structural re-rating. Instead, institutional positioning points to systematic dealer pinning around the $362.50 Max Pain level as option decay accelerates into earnings disclosures.
Capital Allocation Reality
Corporate combination narratives often emerge when equity multiples expand faster than underlying cash flows. When an operating business trades at 340 times trailing earnings while offering a free cash flow yield 480 basis points below sovereign bond yields, financial models must eventually confront cash generation capacity. Until automotive operating margins expand meaningfully beyond 1.41%, headline merger speculation remains a distraction from basic capital efficiency metrics.
Tesla, Inc. (TSLA)
Trailing P/E
Marcus Wolfe Screen
Leverage Profile
30D Channel
Pristine cash flow conversion (3.89x) and healthy accrual ratio (-7.95%). Zero accounting anomalies detected (LOW ANOMALY RISK).
Fortress Balance Sheet (Net Cash Position; zero net refinancing distress).
Evaluated against 5.10% US 10-Yr Benchmark (FCF Spread: -4.80% (vs 10Y Yield of 5.14%)).
Max Pain: $362.50 (-1.51%) | P/C Ratio: 0.71 | 30D Channel: $341.68 – $394.44.
$338.62 – $353.34 (-4% to -8% Pullback Accumulation)
Sustained weekly close below $331.25 (-10.0% structural stop) or fundamental cash flow deterioration.