
The nice thing about running a century-old diversified industrial conglomerate is that you can manufacture everything from commercial jet avionics to warehouse automation sensors, report a quarterly revenue beat, and watch Wall Street analysts nod with practiced reverence.
The less nice thing is cash flow math.
On Thursday morning, Honeywell International Inc. (HON) delivered its third-quarter earnings report, filing its official Form 10-Q and Form 8-K with the SEC. The headline numbers looked tidy. Quarterly revenue touched $4.99 billion, topping consensus expectations. Management took to the microphones to proclaim that business was expanding faster than anticipated. Financial news wires promptly circulated the verdict: the industrial giant had beaten expectations, proved its operational resilience, and cemented its role as a steady capital compounder.
That is the consensus narrative. It is clean, comforting, and remarkably indifferent to the cash ledger.
When you peer past the press release and step onto the factory floor of the balance sheet, a very different mechanical reality emerges. Honeywell is asking investors to accept a negative cash cushion, an elevated debt load, and an aggressive forward valuation multiple, all while options desks set up an uncomfortable gravitational pull toward lower strikes.
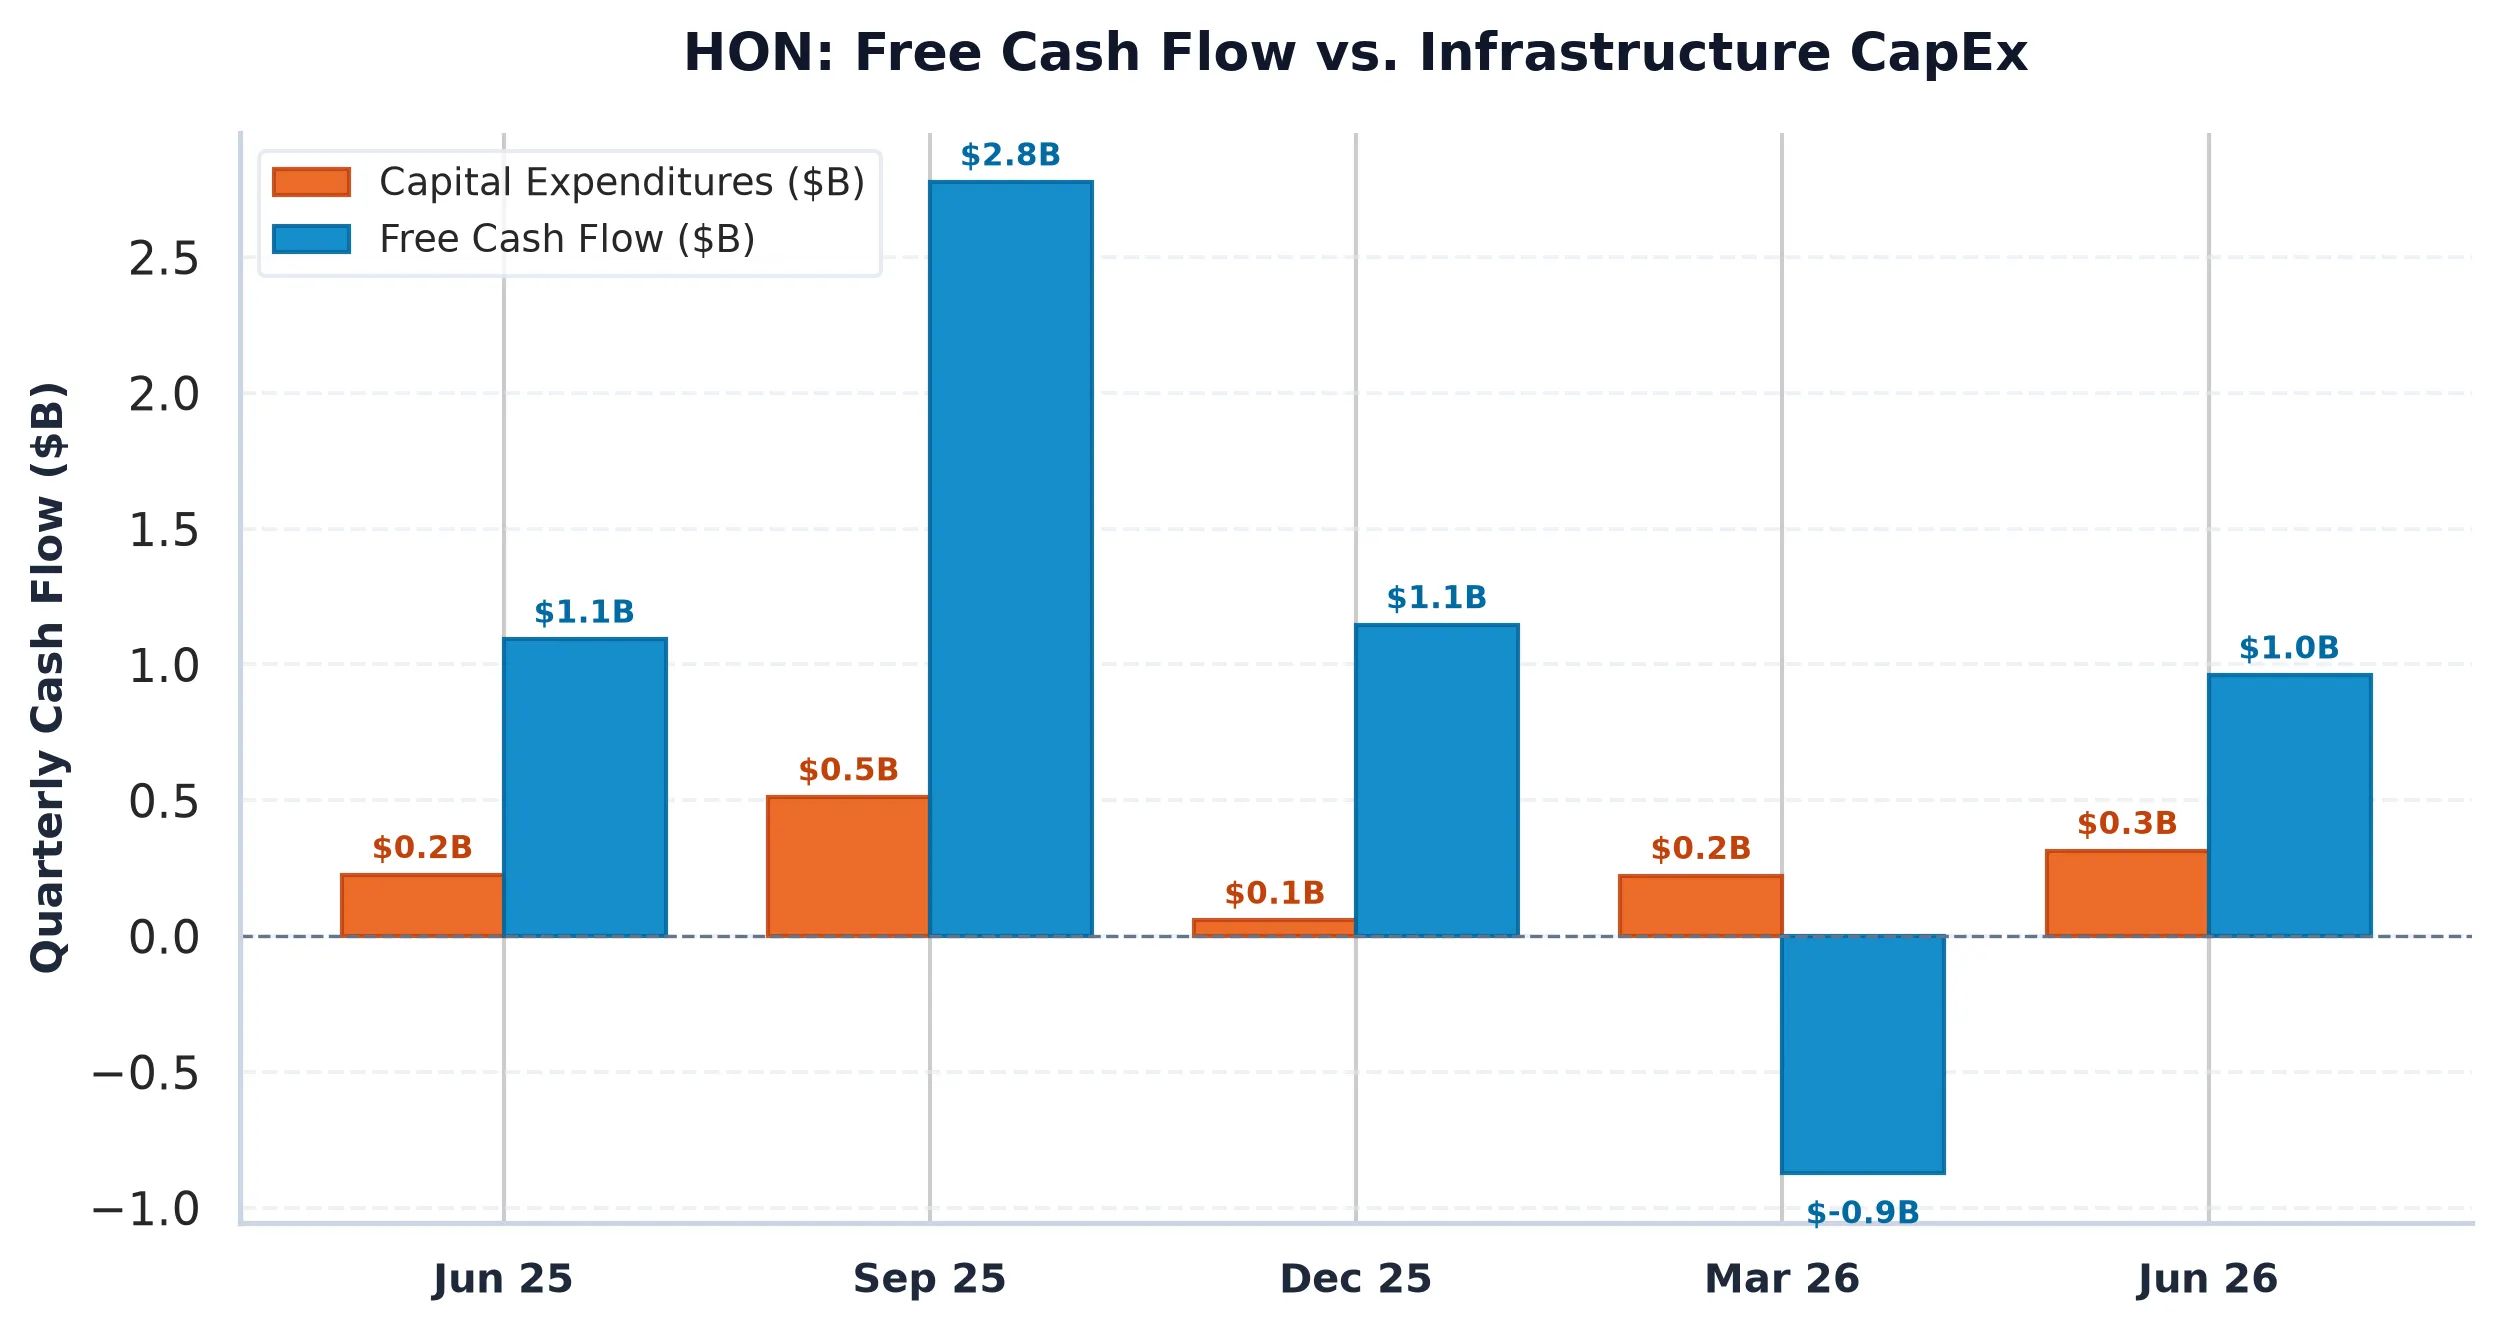
The Five-Billion-Dollar Disappearing Act
To understand what is happening at Honeywell, you have to look at the divergence between accounting earnings and actual cash in the till.
Over the trailing twelve months, Honeywell reported net income of $8.27 billion on $38.06 billion in total revenue. That translates to an impressive net profit margin of 21.58% and a trailing price-to-earnings ratio of 7.94. If you stop reading right there, the stock looks like an absolute bargain trading around $215.15.
Except you cannot spend net income. You can only spend cash.
During that exact same trailing window, Honeywell generated just $2.61 billion in true free cash flow. That is an earnings-to-cash conversion rate of roughly 31.6%. More than $5.6 billion in reported accounting profit vanished into the corporate machinery before reaching equity holders.
Where did it go? A meaningful chunk went directly into capital expenditures, which soaked up $2.51 billion (or 6.59% of revenue) as the company retools production lines, modernizes aerospace assembly tooling, and invests across its building automation portfolio. The rest was absorbed by working capital friction, capitalized development, and the structural friction inherent in operating a massive global enterprise.
When you divide $2.61 billion of free cash flow into Honeywell’s $68.19 billion market capitalization, you get a Free Cash Flow Yield of 3.83%.
This is where macro reality crashes the industrial party.
The Cost of Capital Reality
In an era of zero interest rates, a 3.83% free cash flow yield on an industrial bellwether was perfectly respectable. Investors were happy to collect a sub-4% cash return because sovereign yields paid next to nothing.
Today, the macroeconomic backdrop has fundamentally altered the rules of engagement. The benchmark 10-Year U.S. Treasury yield sits stubbornly at 5.00%.
That benchmark represents risk-free sovereign debt backed by the full faith and credit of the United States government. Uncle Sam requires no aircraft parts certifications, runs no sprawling supply chains, and does not need to negotiate multi-year collective bargaining agreements.
Yet Honeywell’s equity offers an equity risk premium spread of negative 1.17% relative to that sovereign baseline.
Think about the incentives embedded in that arithmetic. An institutional asset allocator can sit entirely in risk-free paper and harvest a guaranteed 5.00% annual return. Or, alternatively, that same allocator can buy Honeywell common equity at $215.15 per share, take on global supply chain vulnerabilities, cyclical aerospace build rates, and regulatory friction, all to collect a cash yield that is 117 basis points lower than sovereign cash.
For that negative carry to make sense, Honeywell needs to deliver breakneck top-line compounding. But total revenue over the trailing twelve months grew at just 4.30% year over year. When a business growing at 4.3% trades at a forward P/E of 21.93, you end up with a price-to-earnings-to-growth (PEG) ratio of 3.51.
Paying 3.5 times your growth rate for an industrial giant yielding less than cash in a money market fund is a bold expression of faith.
The Balance Sheet Refinancing Wall
The valuation puzzle becomes more intricate when you examine the liability structure.
Honeywell carries $34.96 billion in total debt against $9.20 billion in cash and short-term liquidity, leaving net debt at $25.76 billion. That pushes the company’s leverage ratio to 3.03 times enterprise EBITDA ($94.14 billion enterprise value against trailing operating cash flow metrics).
In a low-rate regime, 3.0x leverage on a high-grade conglomerate was an efficient balance sheet optimization tactic. Corporate treasuries issued ten-year paper at 2.5% to fund bolt-on acquisitions and execute share repurchases, creating synthetic earnings per share accretion.
In today’s credit environment, where high-yield corporate benchmarks sit around 77 and investment-grade corporate borrowing rates hover comfortably above 5.5%, every bond maturity becomes an earnings headwind. As Honeywell rolls maturing low-coupon debt into prevailing market rates over the next 24 to 36 months, interest expense will inexorably climb.
Unless operating margins expand far faster than the 20.25% posted in recent filings, rising debt service costs will exert downward pressure on the very free cash flow needed to justify the multiple.
The Plumbing: Speculative Skew and the $210 Magnet
While equity research desks celebrate the headline revenue print, equity derivatives desks are tracking a very different dynamic: mechanical option dealer positioning.
Following the earnings release, retail and momentum accounts rushed into upside call contracts. Honeywell’s Put/Call open interest ratio currently sits at an extremely lopsided 0.46. Total call open interest stands at 7,308 contracts against just 3,348 put contracts.
In institutional market plumbing, a Put/Call ratio below 0.65 signals speculative euphoria. Market makers who sold those call options are forced to buy underlying stock to hedge their upside delta exposure. This mechanical dynamic often creates a temporary post-earnings bid, which commentators routinely confuse with fundamental institutional accumulation.
The structural ceiling, however, is formidable. Heavy Call Walls have concentrated at the $220, $230, and $250 strikes. The $250 strike alone holds 2,514 contracts, representing an immense overhead resistance zone where option sellers will aggressively defend their short volatility positions.
Down below, the primary Put Wall rests at $210 (586 contracts), closely followed by the $207.50 strike.
Crucially, the Max Pain strike across the front-month options complex sits at $210.00. That is 2.39% below the current trading price of $215.15.
With front-month at-the-money implied volatility at 60.25% and a mathematical 30-day dispersion envelope of plus or minus $37.16 (a 17.27% expected move), the underlying shares are carrying elevated volatility pricing.
As the initial earnings excitement fades over the coming sessions, the deterministic passage of time (charm) and implied volatility compression (vanna) will kick in. When out-of-the-money call option premiums decay, dealers who bought stock to hedge those calls must systematically unwind their long positions. That mechanical flow tends to pull spot prices directly toward the point of maximum options expiration pain: $210.00.
The Verdict on Consensus
The consensus view on Honeywell is that it delivered a clean beat-and-raise performance worthy of multiple preservation.
The balance sheet reality reveals something far more sober:
1. Free cash flow conversion sits at just 31.6%, leaving an FCF yield of 3.83% that fails to clear the sovereign risk-free hurdle by 117 basis points.
2. Balance sheet leverage of 3.03x EBITDA leaves $25.76 billion in net debt exposed to an elevated refinancing curve.
3. The forward valuation of 21.9x earnings commands a prohibitive PEG ratio of 3.51 on 4.3% top-line growth.
4. Options plumbing exhibits an overextended call skew (P/C ratio 0.46) with a dealer gamma gravitational pull toward $210.
When the consensus tells you an industrial conglomerate is an undeniable buy because quarterly revenue cleared an arbitrary Wall Street estimate by a few million dollars, check the cash flow statement first. In an economy where capital has a compounding hurdle, the math simply does not add up.
Honeywell International Inc. (HON)
Trailing P/E
Marcus Wolfe Screen
Leverage Profile
30D Channel
Pristine cash flow conversion (1.36x) and healthy accrual ratio (-2.28%). Zero accounting anomalies detected (LOW ANOMALY RISK).
Manageable liability structure relative to institutional cash flow.
Evaluated against 5.10% US 10-Yr Benchmark (FCF Spread: -1.17% (vs 10Y Yield of 5.00%)).
Max Pain: $210.00 (-2.39%) | P/C Ratio: 0.46 | 30D Channel: $199.72 – $230.57.
$197.93 – $206.54 (-4% to -8% Pullback Accumulation)
Sustained weekly close below $193.63 (-10.0% structural stop) or fundamental cash flow deterioration.