
⚡ Executive Morning Takeaways
- Macro & Rates Impulse: The 10-Year Treasury yield has retreated to 4.95% as a flight to safety gains momentum amid a sharp 2.86% drawdown in the Nasdaq 100.
- Sector Rotation & Dispersion: Defensive rotation is the dominant theme, with Consumer Staples (XLP) and Utilities (XLU) leading while Technology (XLK) suffers significant valuation compression.
- Primary Corporate Catalyst: American Express Company (AXP) reports third-quarter earnings this morning, testing whether its premium cardholder base can maintain spending growth as credit provisions come under scrutiny.
🌐 Pre-Market Macro & Rates Dashboard
| Asset / Benchmark | Ticker | Current Price / Level | Change (%) | 52-Week Low | 52-Week High |
|---|---|---|---|---|---|
| S&P 500 (SPY) | SPY | $763.96 | -1.18% | $629.28 | $781.62 |
| Nasdaq 100 (QQQ) | QQQ | $704.47 | -2.86% | $555.60 | $762.86 |
| Russell 2000 (IWM) | IWM | $276.67 | +0.07% | $228.90 | $305.18 |
| 20+ Year Treasury (TLT) | TLT | $81.74 | +1.87% | $76.43 | $92.18 |
| High Yield Corporate (HYG) | HYG | $77.10 | +0.16% | $76.39 | $81.33 |
| Gold (GLD) | GLD | $369.00 | -2.63% | $360.12 | $509.70 |
| WTI Crude Oil (CL=F) | CL=F | $101.06/bbl | +1.60% | $54.98 | $119.48 |
| US Dollar Index Bullish (UUP) | UUP | $28.90 | -0.07% | $26.40 | $29.25 |
| CBOE Volatility Index (^VIX) | ^VIX | 19.53 | +2.63% | 13.38 | 35.30 |
| 2-Yr US Treasury Yield (2YY=F) | 2YY=F | 4.75% | +0.00% | 3.38% | 4.88% |
| 10-Yr US Treasury Yield (^TNX) | ^TNX | 4.95% | -3.75% | 0.00% | 5.36% |
The macro environment is currently defined by a stark divergence between equity duration risk and sovereign yield relief. While the 10-Year Treasury yield falling below 5% provides some oxygen to valuation models, the spike in the VIX to 19.53 suggests that the market is no longer pricing for perfection. The equity risk premium remains uncomfortably tight, meaning that for a company like American Express, the hurdle to justify its current multiple is tied directly to its ability to outpace the risk-free rate through sheer operational efficiency.
📊 Sector Valuation & Performance Landscape
| Sector ETF | Ticker | Price | Change (%) | Trailing P/E | Dividend Yield | 52-Week Low | 52-Week High |
|---|---|---|---|---|---|---|---|
| Technology (XLK) | XLK | $182.34 | -3.29% | 29.9x | 0.43% | $126.68 | $203.25 |
| Communication Services (XLC) | XLC | $107.42 | -1.42% | 15.8x | 1.24% | $105.03 | $120.41 |
| Financials (XLF) | XLF | $56.65 | +1.09% | 16.1x | 1.55% | $47.67 | $58.60 |
| Healthcare (XLV) | XLV | $181.30 | +1.32% | 32.3x | 1.52% | $141.97 | $182.25 |
| Energy (XLE) | XLE | $67.57 | -0.87% | 19.2x | 2.48% | $43.19 | $68.78 |
| Consumer Discretionary (XLY) | XLY | $115.01 | -0.45% | 25.4x | 0.86% | $105.19 | $125.01 |
| Consumer Staples (XLP) | XLP | $89.99 | +3.31% | 26.7x | 2.73% | $75.16 | $90.14 |
| Utilities (XLU) | XLU | $42.87 | +2.07% | 19.4x | 3.07% | $39.03 | $47.80 |
| Industrials (XLI) | XLI | $166.73 | -0.94% | 27.4x | 1.13% | $147.14 | $188.19 |
| Materials (XLB) | XLB | $51.69 | +0.72% | 24.1x | 1.77% | $42.03 | $54.19 |
Financials (XLF) are acting as a surprising pillar of stability, gaining 1.09% while the broader tech complex unravels. This suggests a rotation into “old economy” cash flows where valuations are anchored by tangible earnings rather than infinite-duration growth stories. However, the premium multiples in Healthcare and Consumer Staples indicate that investors are paying a high price for safety, leaving little room for disappointing guidance in the financial sector.
📅 Today’s Earnings & Economic Radar
Imminent Corporate Earnings Releases
| Company / Ticker | Timing | Consensus EPS | Consensus Revenue | Key Strategic Theme |
|---|---|---|---|---|
| American Express (AXP) | Today (BMO) | $4.49 | $20.12B | Premium Cardholder Spending & Credit Provisions |
| Schlumberger (SLB) | Today (BMO) | $0.61 | $9.27B | International Upstream Demand & Margins |
| Honeywell (HON) | Yesterday | $2.45 | $5.15B | Automation & Aerospace Backlog |
| Union Pacific (UNP) | Yesterday | $3.30 | $7.09B | Freight Volumes & Operating Ratio |
| Lockheed Martin (LMT) | Yesterday | $8.48 | $22.56B | Defense Budgeting & Production Ramps |
High-Impact Economic Data & Central Bank Actions
| Time (ET) | Event | Impact | Consensus |
|---|---|---|---|
| 08:30 AM | US Employment Situation (Non-Farm Payrolls) | CRITICAL | +185K / 4.1% |
| 10:00 AM | Univ. of Michigan Consumer Sentiment | HIGH | 70.5 |
| 01:00 PM | Baker Hughes Weekly Rig Count | MEDIUM | 585 Rigs |
Institutional desks are laser-focused on the Non-Farm Payrolls print. A significant miss would likely accelerate the flight to bonds, while a beat might reignite fears that the Fed will keep rates “higher for longer,” further pressuring equity multiples. For American Express, the Michigan Sentiment data is equally vital, as it serves as a proxy for the high-end consumer’s willingness to keep swiping.
🎯 Pre-Market Spotlight: American Express Company (AXP)
The thing about American Express Company (AXP) is that it is not really a bank in the way that people who wear green eyeshades think about banks. It is more of a high-end travel and dining club that happens to have a massive balance sheet attached to it. This morning, that club faces its quarterly membership audit. The company is expected to report earnings of $4.49 per share on revenue of $20.12 billion, but the real story is whether the “premium” consumer is finally starting to feel the pinch of 5% interest rates.
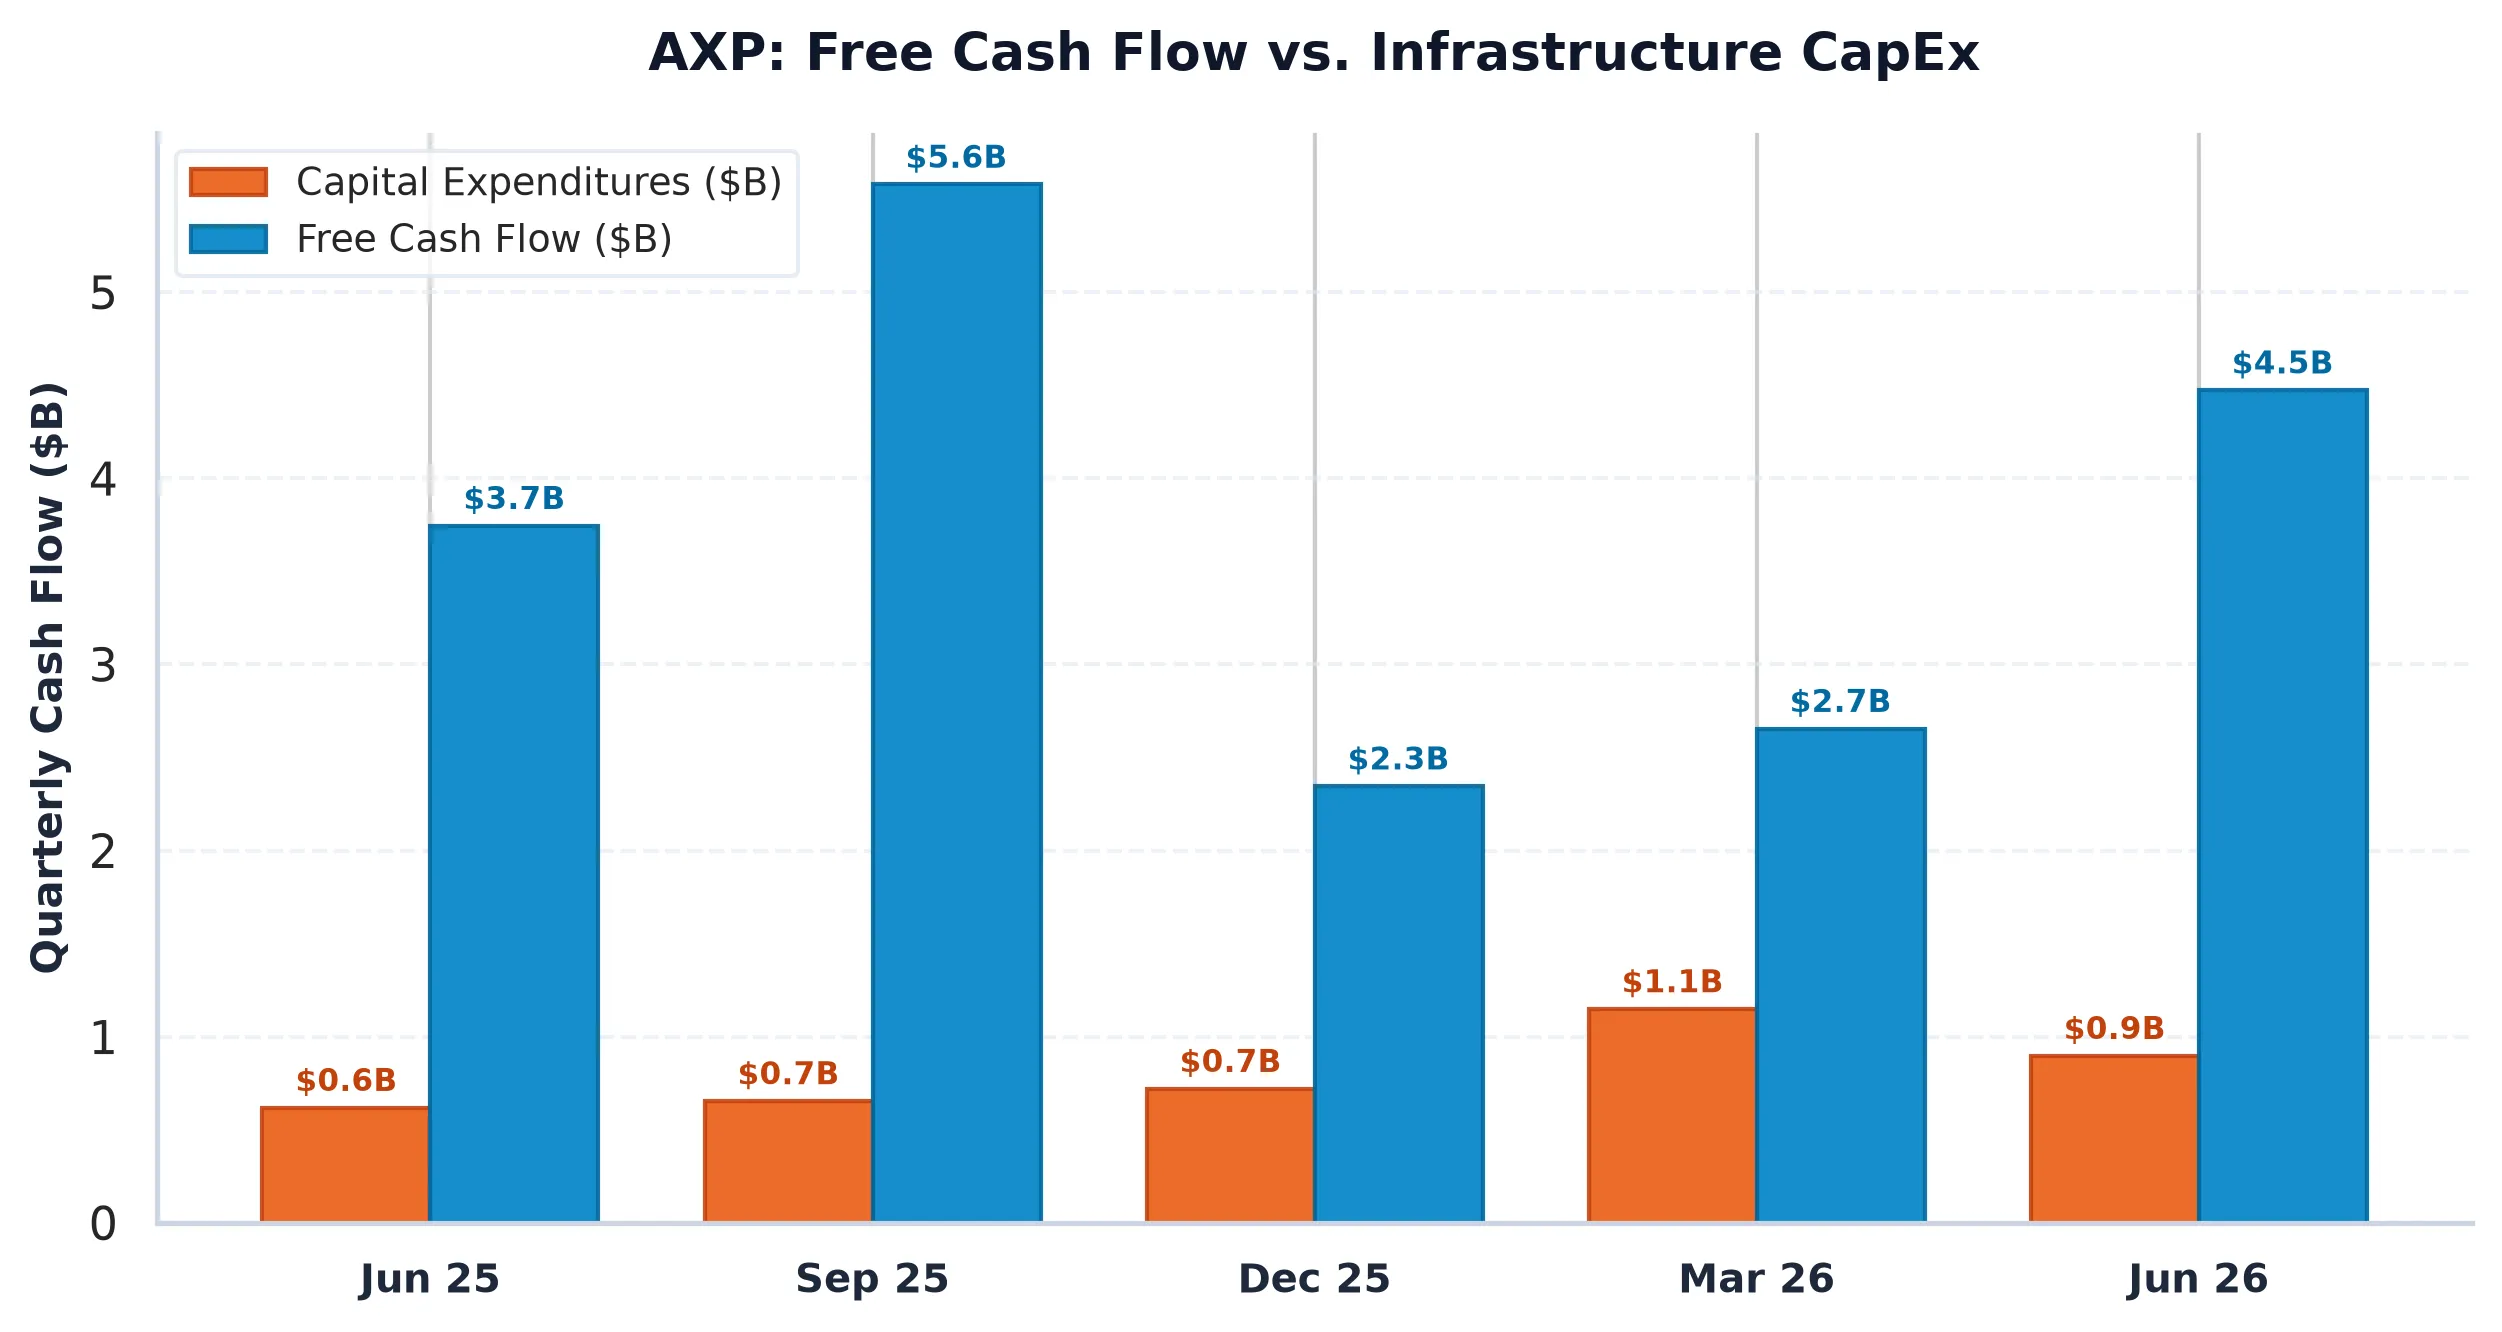
From a fundamental perspective, American Express is an ROE machine. At 34.38%, its return on equity is nearly triple the cost of capital for most of its peers. However, the market is currently pricing the company at 16.1x forward earnings, which is a respectable but demanding multiple in a world where you can get nearly 5% from a Treasury bill without having to worry about whether people are still booking Airbnbs. The recent expansion of rewards with Airbnb is a classic AXP move: it deepens the “lifestyle” moat, but it also highlights the company’s reliance on discretionary travel spend.
The quantitative plumbing tells a story of high expectations. We are seeing a market structure defined by Bullish Call Inflows and a speculative long skew. This means options dealers are likely short a significant amount of upside gamma. If American Express delivers a “merely good” report that fails to trigger a fresh rally, the subsequent decay in those calls will force dealers to sell the underlying stock to stay neutral. This creates a “gamma cliff” where even a beat-and-raise could lead to a “sell the news” event if the momentum pauses.
Furthermore, the Max Pain strike sits way down at $195. While this is mathematically distant from the current $325.17 price, it suggests that the structural support levels are far below the current speculative froth. If the earnings report shows any weakness in credit quality or a significant jump in provisions for losses, the air pocket beneath the current price could be deeper than the bulls anticipate.
The institutional verdict is that American Express remains a high-quality compounder, but the current entry point requires a belief that the premium consumer is entirely immune to the macro gravity affecting everyone else. With a net debt of $13.34 billion and a trailing P/E of nearly 20x, the margin for error has rarely been thinner.
| Metric | Value |
|---|---|
| Current Price | $325.17 |
| Forward P/E | 16.1x |
| Return on Equity | 34.38% |
| Revenue Growth (YoY) | 12.80% |
| Max Pain Strike | $195.00 |
| AllWallSt Verdict | HOLD |
American Express Company (AXP)
Trailing P/E
Marcus Wolfe Screen
Leverage Profile
30D Channel
Banking liquidity & regulatory capital compliant (Basel III / CET1 governed); deposit & trading settlement flows normalized.
Tier 1 Regulatory Capital & Liquidity Coverage Ratio (LCR) compliant; balance sheet governed by Basel III capital buffers.
Evaluated against 5.10% US 10-Yr Benchmark; bank net interest margins sensitive to yield curve slope (2s10s spread) and deposit beta.
Max Pain: $195.00 (-40.03%) | P/C Ratio: 0.0 | 30D Channel: $301.86 – $348.48.
$299.16 – $312.16 (-4% to -8% Pullback Accumulation)
Sustained weekly close below $292.65 (-10.0% structural stop) or fundamental cash flow deterioration.