
Microsoft Corporation (MSFT) is currently engaged in a very expensive game of chicken with the laws of physics and the US bond market. If you look at the company through the lens of its recent marketing, it is a software titan benefiting from a massive hit with the latest Call of Duty release and a 43 percent surge in Azure cloud revenue. If you look at it through the lens of a balance sheet, however, it is starting to look like a massive infrastructure fund that occasionally sells operating systems.
The central tension in the Microsoft narrative is no longer about whether people like AI. It is about whether the return on invested capital (ROIC) can ever outrun the sheer velocity of the spending required to stay in the game. According to its latest regulatory filings, specifically the Form 10-K filed in July 2026, the company is operating in a regime of unprecedented capital intensity.
The 50 Percent Revenue Tax
In the old days (meaning roughly three years ago), software was a high margin business because you wrote the code once and sold it a million times. Today, Microsoft Corporation is spending $166.39 billion on capital expenditures. To put that in perspective, the company’s total revenue is roughly $331.84 billion. That means Microsoft is effectively paying a 50.14 percent “infrastructure tax” on every dollar it brings in just to keep the servers humming and the GPUs cooled.
This creates a peculiar valuation problem. At a current price of $524.51, Microsoft trades at a trailing P/E of 29.2. That sounds reasonable for a dominant monopoly until you look at the Free Cash Flow (FCF) yield. Because the company is reinvesting so much cash into data centers, the FCF yield has compressed to a tiny 0.42 percent.
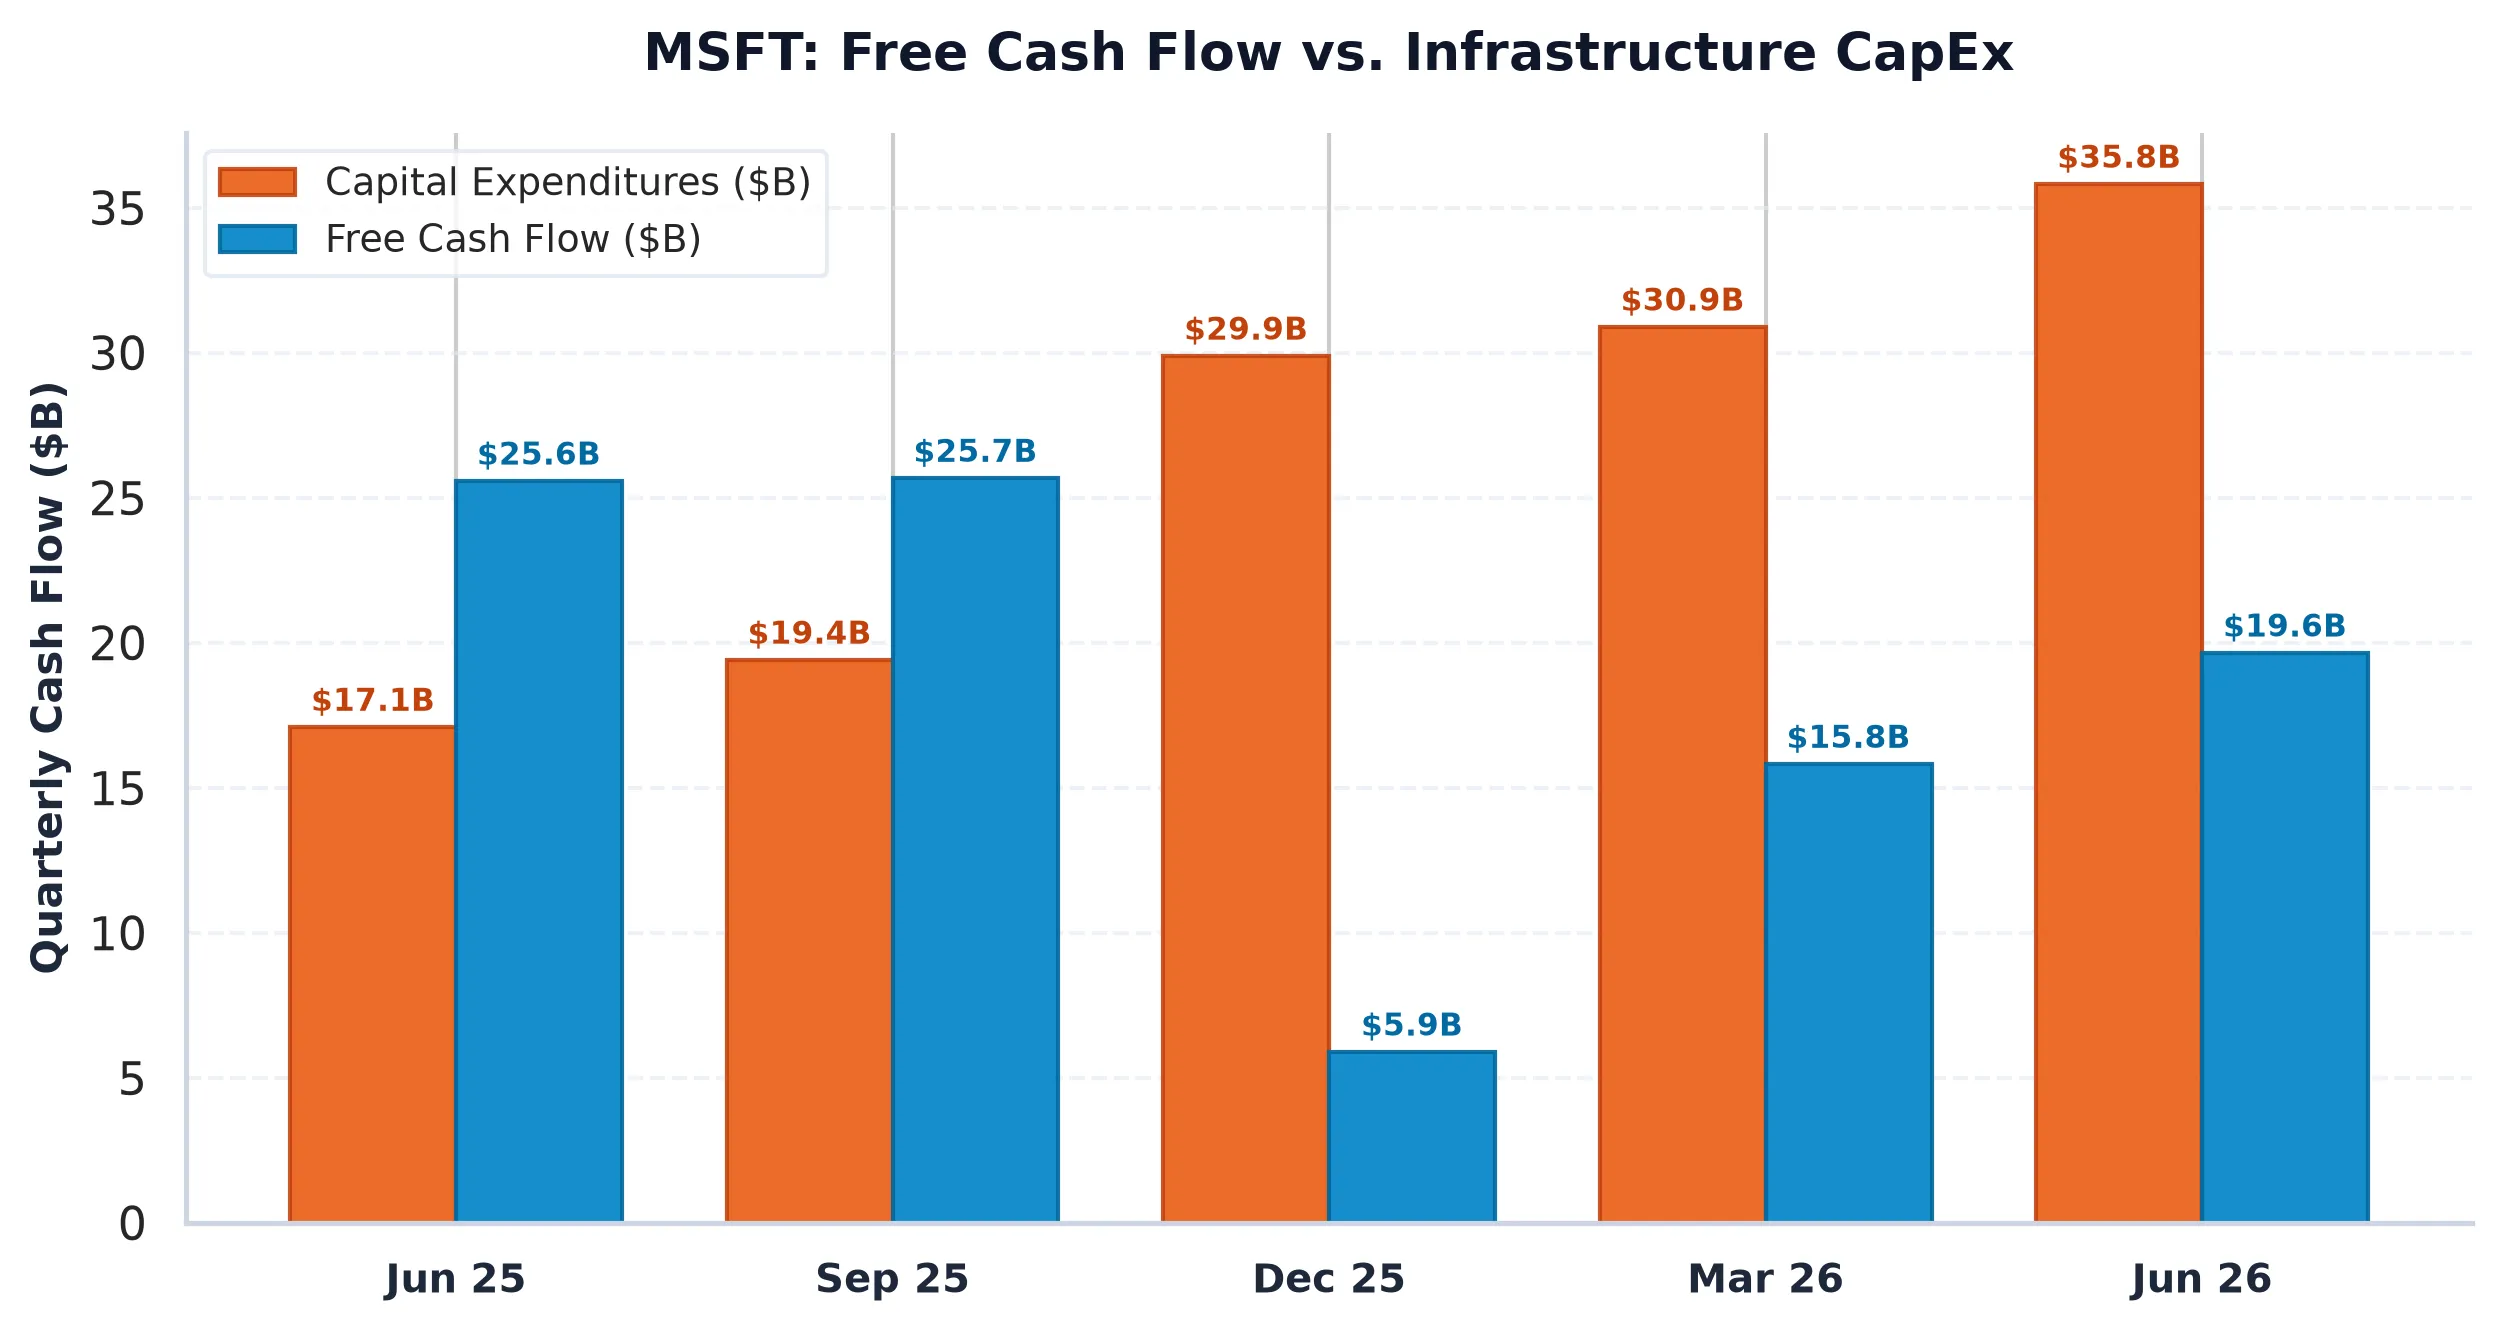
When the US 10-Year Treasury yield is sitting at 4.99 percent, the math becomes uncomfortable. Investors are accepting an equity risk premium spread of negative 4.56 percent. Essentially, you are paying Microsoft for the privilege of letting them spend your capital on Nvidia chips, while Uncle Sam would pay you nearly 5 percent to do absolutely nothing. This is what the market calls “duration risk,” and it makes the stock highly sensitive to any hiccup in Azure’s growth trajectory.
The $525 Gravity Well
While the fundamental analysts debate the long term return on data centers, the options market is preoccupied with more immediate plumbing issues. The market structure for Microsoft is currently defined by a heavy concentration of speculative call buying. With a Put/Call Open Interest ratio of 0.48, the sentiment is overwhelmingly bullish, but this creates a mechanical ceiling.
The “Max Pain” strike, the level where the most options contracts expire worthless, is currently sitting at $525.00. Given that the stock is trading at $524.51, we are seeing a classic pinning effect. Options dealers, who are likely long gamma in this territory, are forced to sell into rallies and buy into dips to maintain their hedges. This effectively dampens volatility and keeps the price tethered to that $525 level.
If Microsoft cannot break through the primary Call Wall at $555, the decay of those out of the money calls (a process known as charm) will force dealers to unwind their long stock positions. This could create a liquidity air pocket, especially if the “AI reckoning” mentioned in recent research starts to weigh on institutional sentiment.
The Activision Cushion
It is not all data center anxiety. The recent release of Call of Duty: Modern Warfare 4 by the Activision Blizzard unit is reportedly selling at a record pace. This highlights the one part of the Microsoft empire that still functions with classic software economics: high margin, culturally dominant intellectual property.
However, even a blockbuster video game is a rounding error compared to the $3.9 trillion market capitalization. The real story remains the transition from a capital-light software business to a capital-heavy utility. Microsoft is building the electrical grid for the AI age, and while 43 percent Azure growth is impressive, the cost of building that grid is now the dominant feature of the balance sheet.
For now, the market is willing to look past the negative yield spread in exchange for the promise of AI dominance. But as the 10-Year Treasury yield hovers near 5 percent, the margin for error on that $166 billion CapEx bill is becoming razor thin.
Microsoft Corporation (MSFT)
Trailing P/E
Marcus Wolfe Screen
Leverage Profile
30D Channel
MODERATE WATCHLIST (1 flag): Inventory growth outpaced COGS growth by >15%, signaling potential inventory bloat or pending margin compression.
Manageable liability structure relative to institutional cash flow.
Evaluated against 5.10% US 10-Yr Benchmark (FCF Spread: -4.56% (vs 10Y Yield of 4.99%)).
Max Pain: $525.00 (+0.09%) | P/C Ratio: 0.48 | 30D Channel: $486.92 – $562.10.
$482.55 – $503.53 (-4% to -8% Pullback Accumulation)
Sustained weekly close below $472.06 (-10.0% structural stop) or fundamental cash flow deterioration.