
Anthropic has officially filed for what may become the largest initial public offering in market history. In a masterclass of institutional branding, Chief Executive Officer Dario Amodei accompanied the registration statement with grave public warnings regarding the existential risks advanced artificial intelligence poses to human civilization.
There is something undeniably magnificent about telling prospective public equity investors that your core product might endanger human existence while simultaneously asking them to fund your balance sheet at a record valuation. Beneath the philosophical existentialism lies a far simpler, much more earthly accounting mechanism: the circular economy of cloud computing infrastructure.
To understand why Amazon.com, Inc. (AMZN) trades where it does today, one must trace the flow of cash through this ecosystem. Over the past two years, Amazon has committed billions of dollars in strategic capital into Anthropic. In pure accounting terms, this appears as an equity investment on Amazon’s balance sheet.
However, that capital does not sit in a bank account accumulating interest. A substantial portion of those dollars returns immediately to Amazon through Amazon Web Services (AWS) infrastructure contracts. Anthropic receives cash from Amazon, uses that cash to purchase compute capacity from AWS, and Amazon recognizes high-margin cloud revenue. Now, with Anthropic filing for an IPO, Amazon stands to harvest a massive mark-to-market valuation gain on its balance sheet while simultaneously securing a permanently captive anchor tenant for its proprietary silicon and data center capacity.
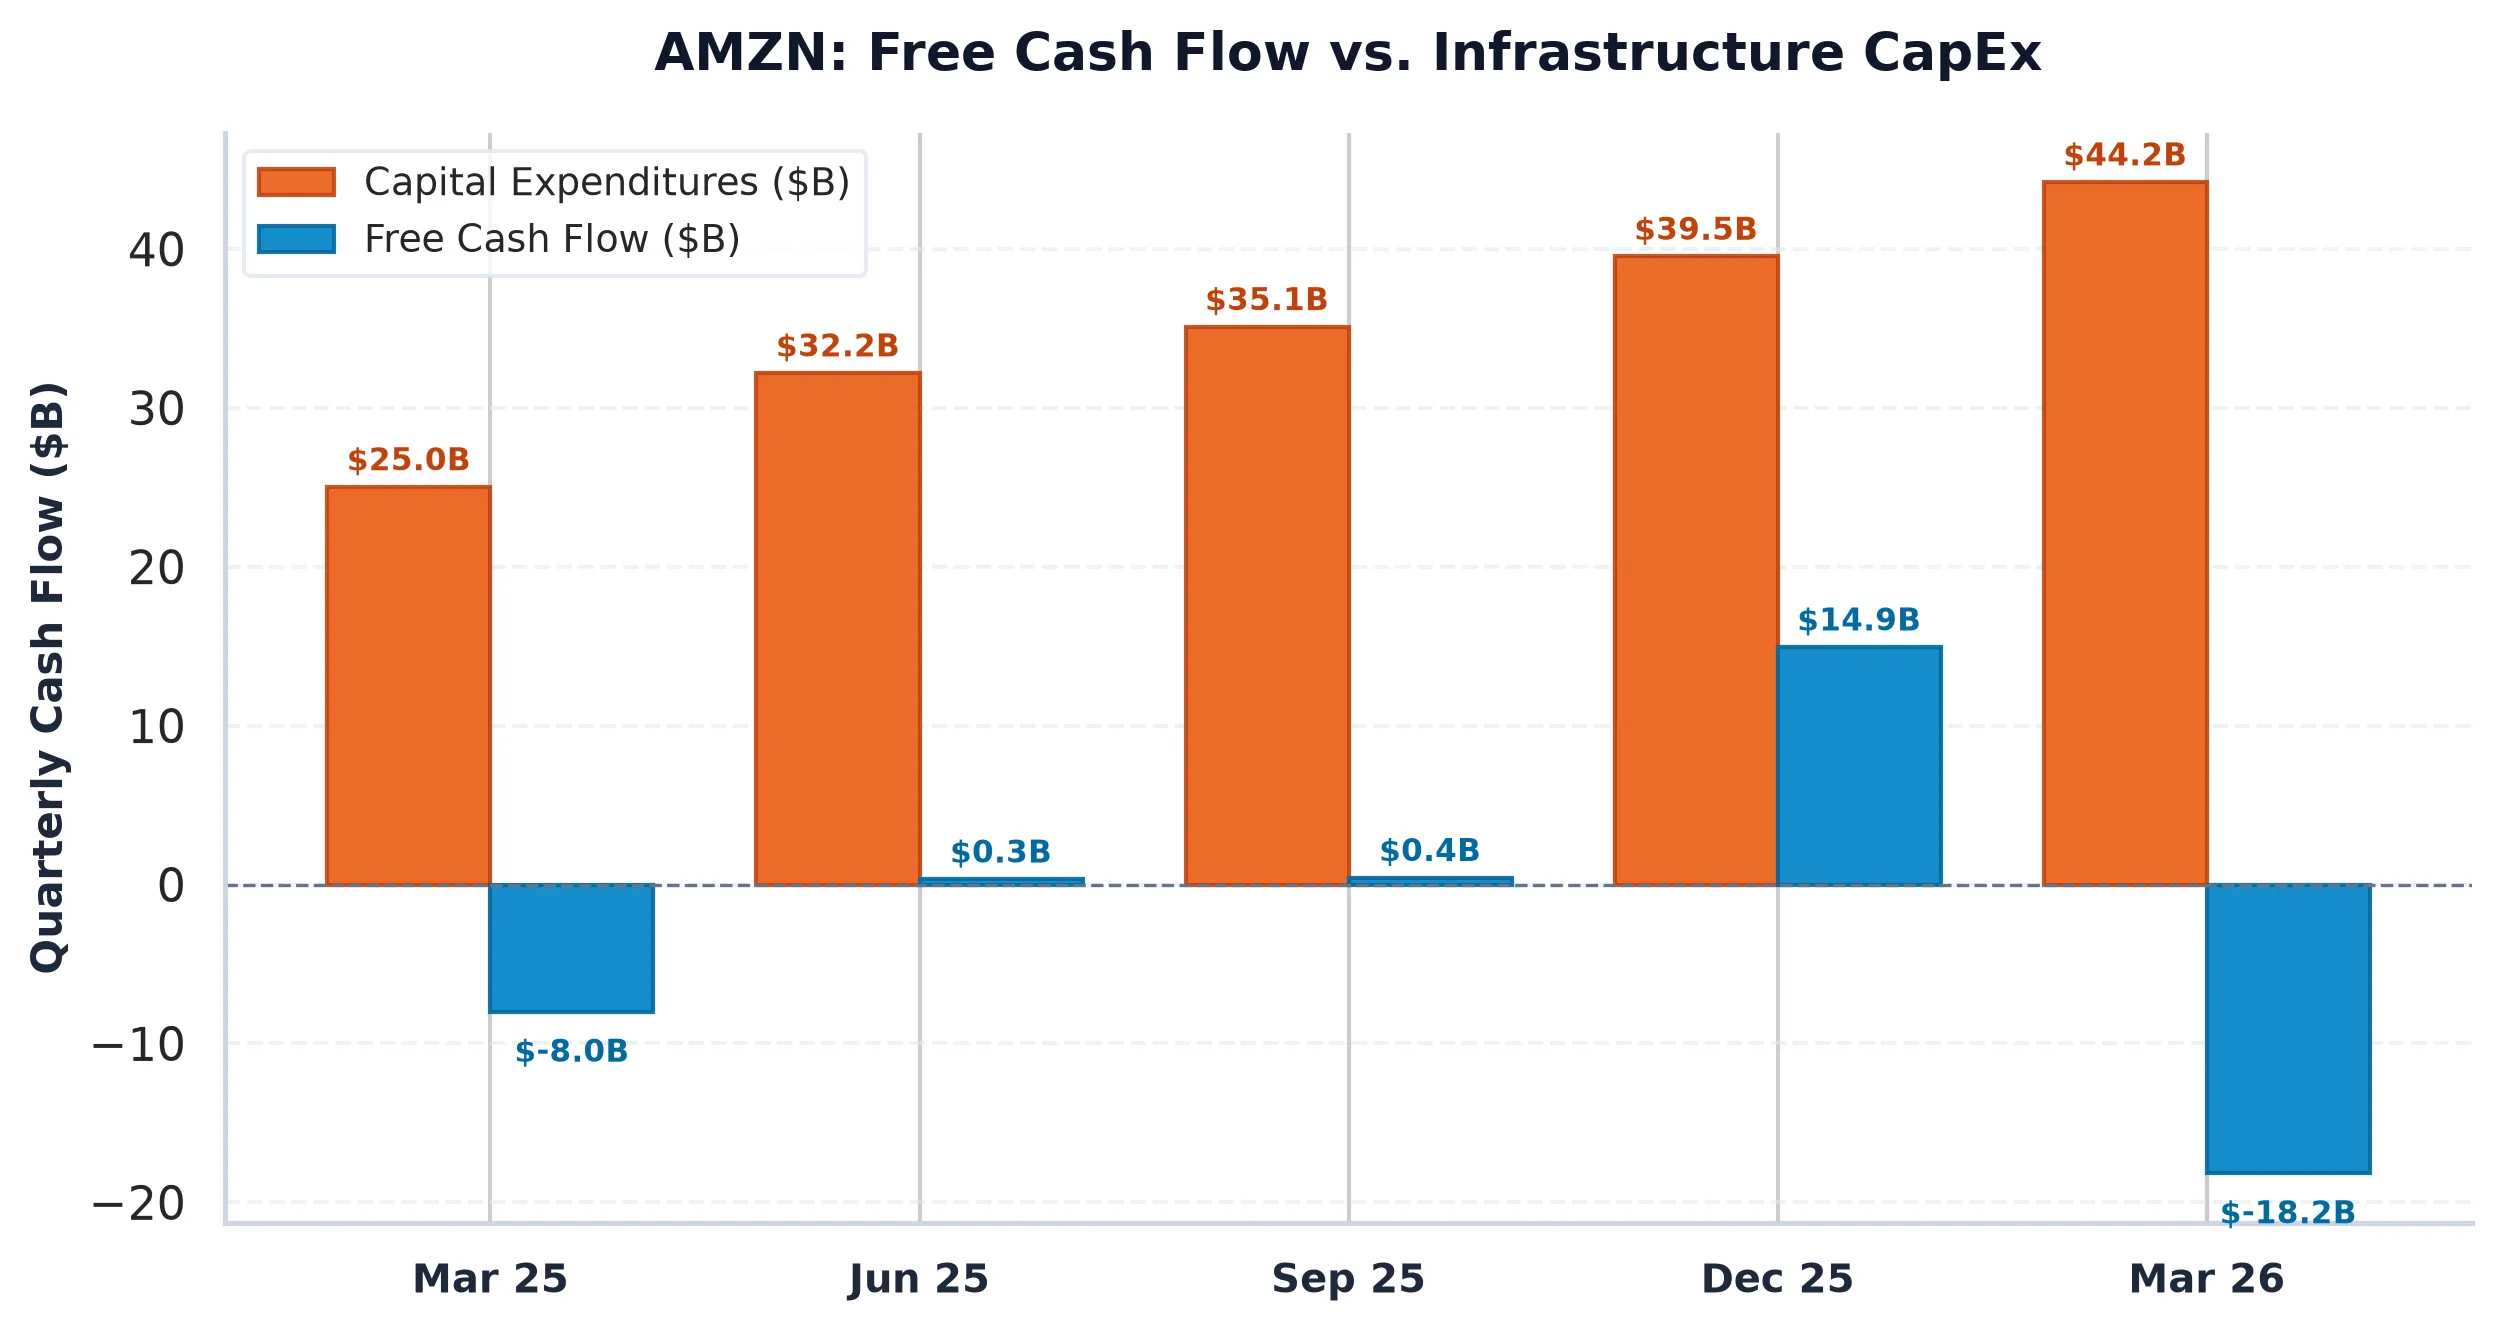
The Accounting Reality of Perpetual CapEx
While headline writers focus on potential IPO windfalls and upcoming third-quarter earnings estimates, the underlying balance sheet mechanics at Amazon tell a far more demanding story. According to its latest Form 10-Q and Form 10-K disclosures, Amazon generated $775.68 billion in trailing twelve-month revenue and $135.28 billion in net income.
Yet, its capital expenditure over the same period reached an eye-watering $158.18 billion, representing a capital intensity ratio of 20.39%. When you subtract this massive capital deployment from operating cash flows, Amazon is left with just $3.22 billion in real Free Cash Flow.
On a market capitalization of $2.69 trillion, that translates to a Free Cash Flow Yield of exactly 0.12%.
In a macroeconomic regime where the 10-Year US Treasury yield sits at 4.99% (and broader fixed-income benchmarks hover near 5.10%), holding an equity security with a 0.12% cash yield creates a staggering negative Equity Risk Premium spread of -4.87%. Investors are effectively paying Amazon for the privilege of spending $158 billion on server racks, power contracts, and custom AI chips.
Auditing the Prior Thesis
Fourteen days ago, on October 12, 2026, we assigned a HOLD rating on Amazon at $260.62 in our analysis titled “The $132 Billion CapEx Dislocation.” At the time, consensus was pricing in an immediate re-acceleration in AWS margins without fully accounting for the yield penalty imposed by high risk-free interest rates.
Since that call, Amazon shares have drifted down to $249.09, representing a 4.4% decline. While media reports highlight potential catalyst deals like a rumored $7 billion arrangement with Decart AI to enhance AWS chip flexibility, the fundamental economic dilemma remains unchanged. The capital required to stay competitive in hyper-scale cloud computing has expanded rapidly. Revenue growth of 19.60% year-over-year is impressive, but when cash conversion is consumed by hardware depreciation, valuation multiples face continuous gravity.
Options Market Structure and Near-Term Pinning
Heading into the Q3 earnings disclosure scheduled for October 29, derivatives pricing indicates a market locked in a structural holding pattern. The options market reflects a Put/Call Open Interest ratio of 0.40, showing heavily one-sided call buying interest.
However, this call skew creates a double-edged sword for momentum traders. The Max Pain strike sits precisely at $250.00, just 0.37% above current trading levels. Substantial Call Walls at $265 (29,889 contracts) and $280 (52,572 contracts) act as heavy structural ceilings where option sellers will defend their positions.
With 30-day At-The-Money Implied Volatility compressed to 4.79% and an expected 30-day price move of only +/-$3.41 (+/-1.37%), options dealers are positioned in long gamma territory around $250. This setup suggests that barring a dramatic top-line surprise in AWS revenue during the October 29 report, dealer hedging will mechanically pull spot prices back toward the $250 Max Pain anchor, suppressing volatility and trapping breakout attempts below the $265 Call Wall.
Amazon.com, Inc. (AMZN)
Trailing P/E
Marcus Wolfe Screen
Leverage Profile
30D Channel
Pristine cash flow conversion (1.80x) and healthy accrual ratio (-7.56%). Zero accounting anomalies detected (LOW ANOMALY RISK).
Manageable liability structure relative to institutional cash flow.
Evaluated against 5.10% US 10-Yr Benchmark (FCF Spread: -4.87% (vs 10Y Yield of 4.99%)).
Max Pain: $250.00 (+0.37%) | P/C Ratio: 0.4 | 30D Channel: $231.24 – $266.94.
$229.16 – $239.13 (-4% to -8% Pullback Accumulation)
Sustained weekly close below $224.18 (-10.0% structural stop) or fundamental cash flow deterioration.