
⚡ Executive Morning Takeaways
- Macro & Rates Impulse: The 10-Year Treasury yield is hovering at a restrictive 4.99%, effectively zeroing out the equity risk premium for high-multiple software.
- Sector Rotation & Dispersion: Technology (XLK) continues to lead on a price basis at a 31x trailing multiple, while Energy (XLE) faces selling pressure as crude prices stabilize.
- Primary Corporate Catalyst: Microsoft Corporation (MSFT) reports Q1 earnings today against a backdrop of massive AI capital expenditure and a voluntary buyout offer for 60,000 employees.
🌐 Pre-Market Macro & Rates Dashboard
| Asset / Benchmark | Ticker | Current Price / Level | Change (%) | 52-Week Low | 52-Week High |
|---|---|---|---|---|---|
| S&P 500 (SPY) | SPY | $769.66 | +0.56% | $629.28 | $781.62 |
| Nasdaq 100 (QQQ) | QQQ | $721.25 | +1.27% | $555.60 | $762.86 |
| Russell 2000 (IWM) | IWM | $280.18 | +1.15% | $228.90 | $305.18 |
| 20+ Year Treasury (TLT) | TLT | $81.63 | -0.06% | $76.43 | $92.18 |
| High Yield Corporate (HYG) | HYG | $77.60 | +0.52% | $76.39 | $81.28 |
| Gold (GLD) | GLD | $372.28 | +1.21% | $360.12 | $509.70 |
| WTI Crude Oil (CL=F) | CL=F | $101.66/bbl | +1.76% | $54.98 | $119.48 |
| US Dollar Index Bullish (UUP) | UUP | $29.12 | +0.38% | $26.40 | $29.25 |
| CBOE Volatility Index (^VIX) | ^VIX | 17.58 | +0.34% | 13.38 | 35.30 |
| 2-Yr US Treasury Yield (2YY=F) | 2YY=F | 4.75% | +0.00% | 3.38% | 4.88% |
| 10-Yr US Treasury Yield (^TNX) | ^TNX | 4.99% | +0.14% | 0.00% | 5.36% |
The global cost of capital is currently dictated by a 10-Year Treasury yield that refuses to vacate the 5.0% neighborhood. For equity investors, this creates a mathematical gravity: when risk-free paper pays 5.0%, a stock trading at 30 times earnings provides an earnings yield of only 3.33%. This negative spread suggests that the market is pricing in aggressive, flawless growth to justify the current duration risk. Meanwhile, the US Dollar Index (UUP) remains near 52-week highs, creating a persistent headwind for multinationals that must translate foreign Azure and Windows sales back into a surging greenback.
📊 Sector Valuation & Performance Landscape
| Sector ETF | Ticker | Price | Change (%) | Trailing P/E | Dividend Yield | 52-Week Low | 52-Week High |
|---|---|---|---|---|---|---|---|
| Technology (XLK) | XLK | $189.49 | +1.70% | 31.0x | 0.43% | $126.68 | $203.25 |
| Communication Services (XLC) | XLC | $103.58 | -0.26% | 15.2x | 1.24% | $103.20 | $120.41 |
| Financials (XLF) | XLF | $55.88 | -0.25% | 15.9x | 1.55% | $47.67 | $58.60 |
| Healthcare (XLV) | XLV | $179.18 | -0.06% | 32.0x | 1.52% | $141.97 | $182.25 |
| Energy (XLE) | XLE | $68.21 | -2.05% | 19.4x | 2.48% | $43.19 | $69.86 |
| Consumer Discretionary (XLY) | XLY | $115.45 | +1.04% | 25.5x | 0.86% | $105.19 | $125.01 |
| Consumer Staples (XLP) | XLP | $87.15 | -0.92% | 25.9x | 2.73% | $75.16 | $90.14 |
| Utilities (XLU) | XLU | $42.85 | +0.71% | 19.4x | 3.07% | $39.03 | $47.80 |
| Industrials (XLI) | XLI | $167.92 | +0.57% | 27.6x | 1.13% | $147.14 | $188.19 |
| Materials (XLB) | XLB | $51.78 | +0.78% | 24.1x | 1.77% | $42.03 | $54.19 |
We are witnessing a profound valuation divergence. The Technology sector is trading at a significant premium to its historical averages, while deep-value pockets like Financials and Communication Services offer double the earnings yield for half the price. This concentration in XLK reflects a market that is essentially a bet on the continued dominance of three or four hyperscalers. If the anticipated AI-driven revenue acceleration fails to materialize in today’s earnings cycle, the rotation out of high-multiple tech into defensive laggards could be violent.
📅 Today’s Earnings & Economic Radar
Imminent Corporate Earnings Releases
| Company / Ticker | Timing | Consensus EPS | Consensus Revenue | Key Strategic Theme |
|---|---|---|---|---|
| Microsoft (MSFT) | Today (AMC) | $4.72 | $90.74B | Operating Margins & Capital Return |
| Alphabet (GOOGL) | Today (AMC) | $2.97 | $127.91B | Operating Margins & Capital Return |
| Amazon (AMZN) | Tomorrow (BMO) | $1.99 | $202.24B | Operating Margins & Capital Return |
| Intel (INTC) | Tomorrow (BMO) | $0.40 | $16.49B | Operating Margins & Capital Return |
| Mastercard (MA) | Tomorrow (BMO) | $5.17 | $9.66B | Operating Margins & Capital Return |
High-Impact Economic Data & Central Bank Actions
| Time (ET) | Event | Impact | Consensus |
|---|---|---|---|
| 08:30 AM | Consumer Price Index (CPI) MoM / YoY & Core CPI | CRITICAL | +0.3% / 3.1% |
| 10:30 AM | EIA Weekly Petroleum Status Report | HIGH | Inventory Draw |
| 01:00 PM | US 10-Year Treasury Note Auction | HIGH | Yield Discovery |
Institutional desks are hyper-focused on the 08:30 AM CPI print, which will dictate whether the Fed has room to breathe or if the 10-Year yield will pierce the 5.10% level. Following the macro shock, the focus shifts to Microsoft and Alphabet, where the “CapEx vs. Revenue” narrative will be the only thing that matters for the after-hours tape.
🎯 Pre-Market Spotlight: Microsoft Corporation (MSFT)
Microsoft Corporation (MSFT) is currently engaged in a fascinating, if slightly contradictory, exercise in corporate management. On one hand, the company is deploying $166.39 billion in annual capital expenditure, a figure so large it represents more than 50% of its total revenue. On the other hand, it is reportedly offering voluntary buyouts to 60,000 employees. The message is clear: Microsoft is replacing expensive human intelligence with even more expensive silicon intelligence.
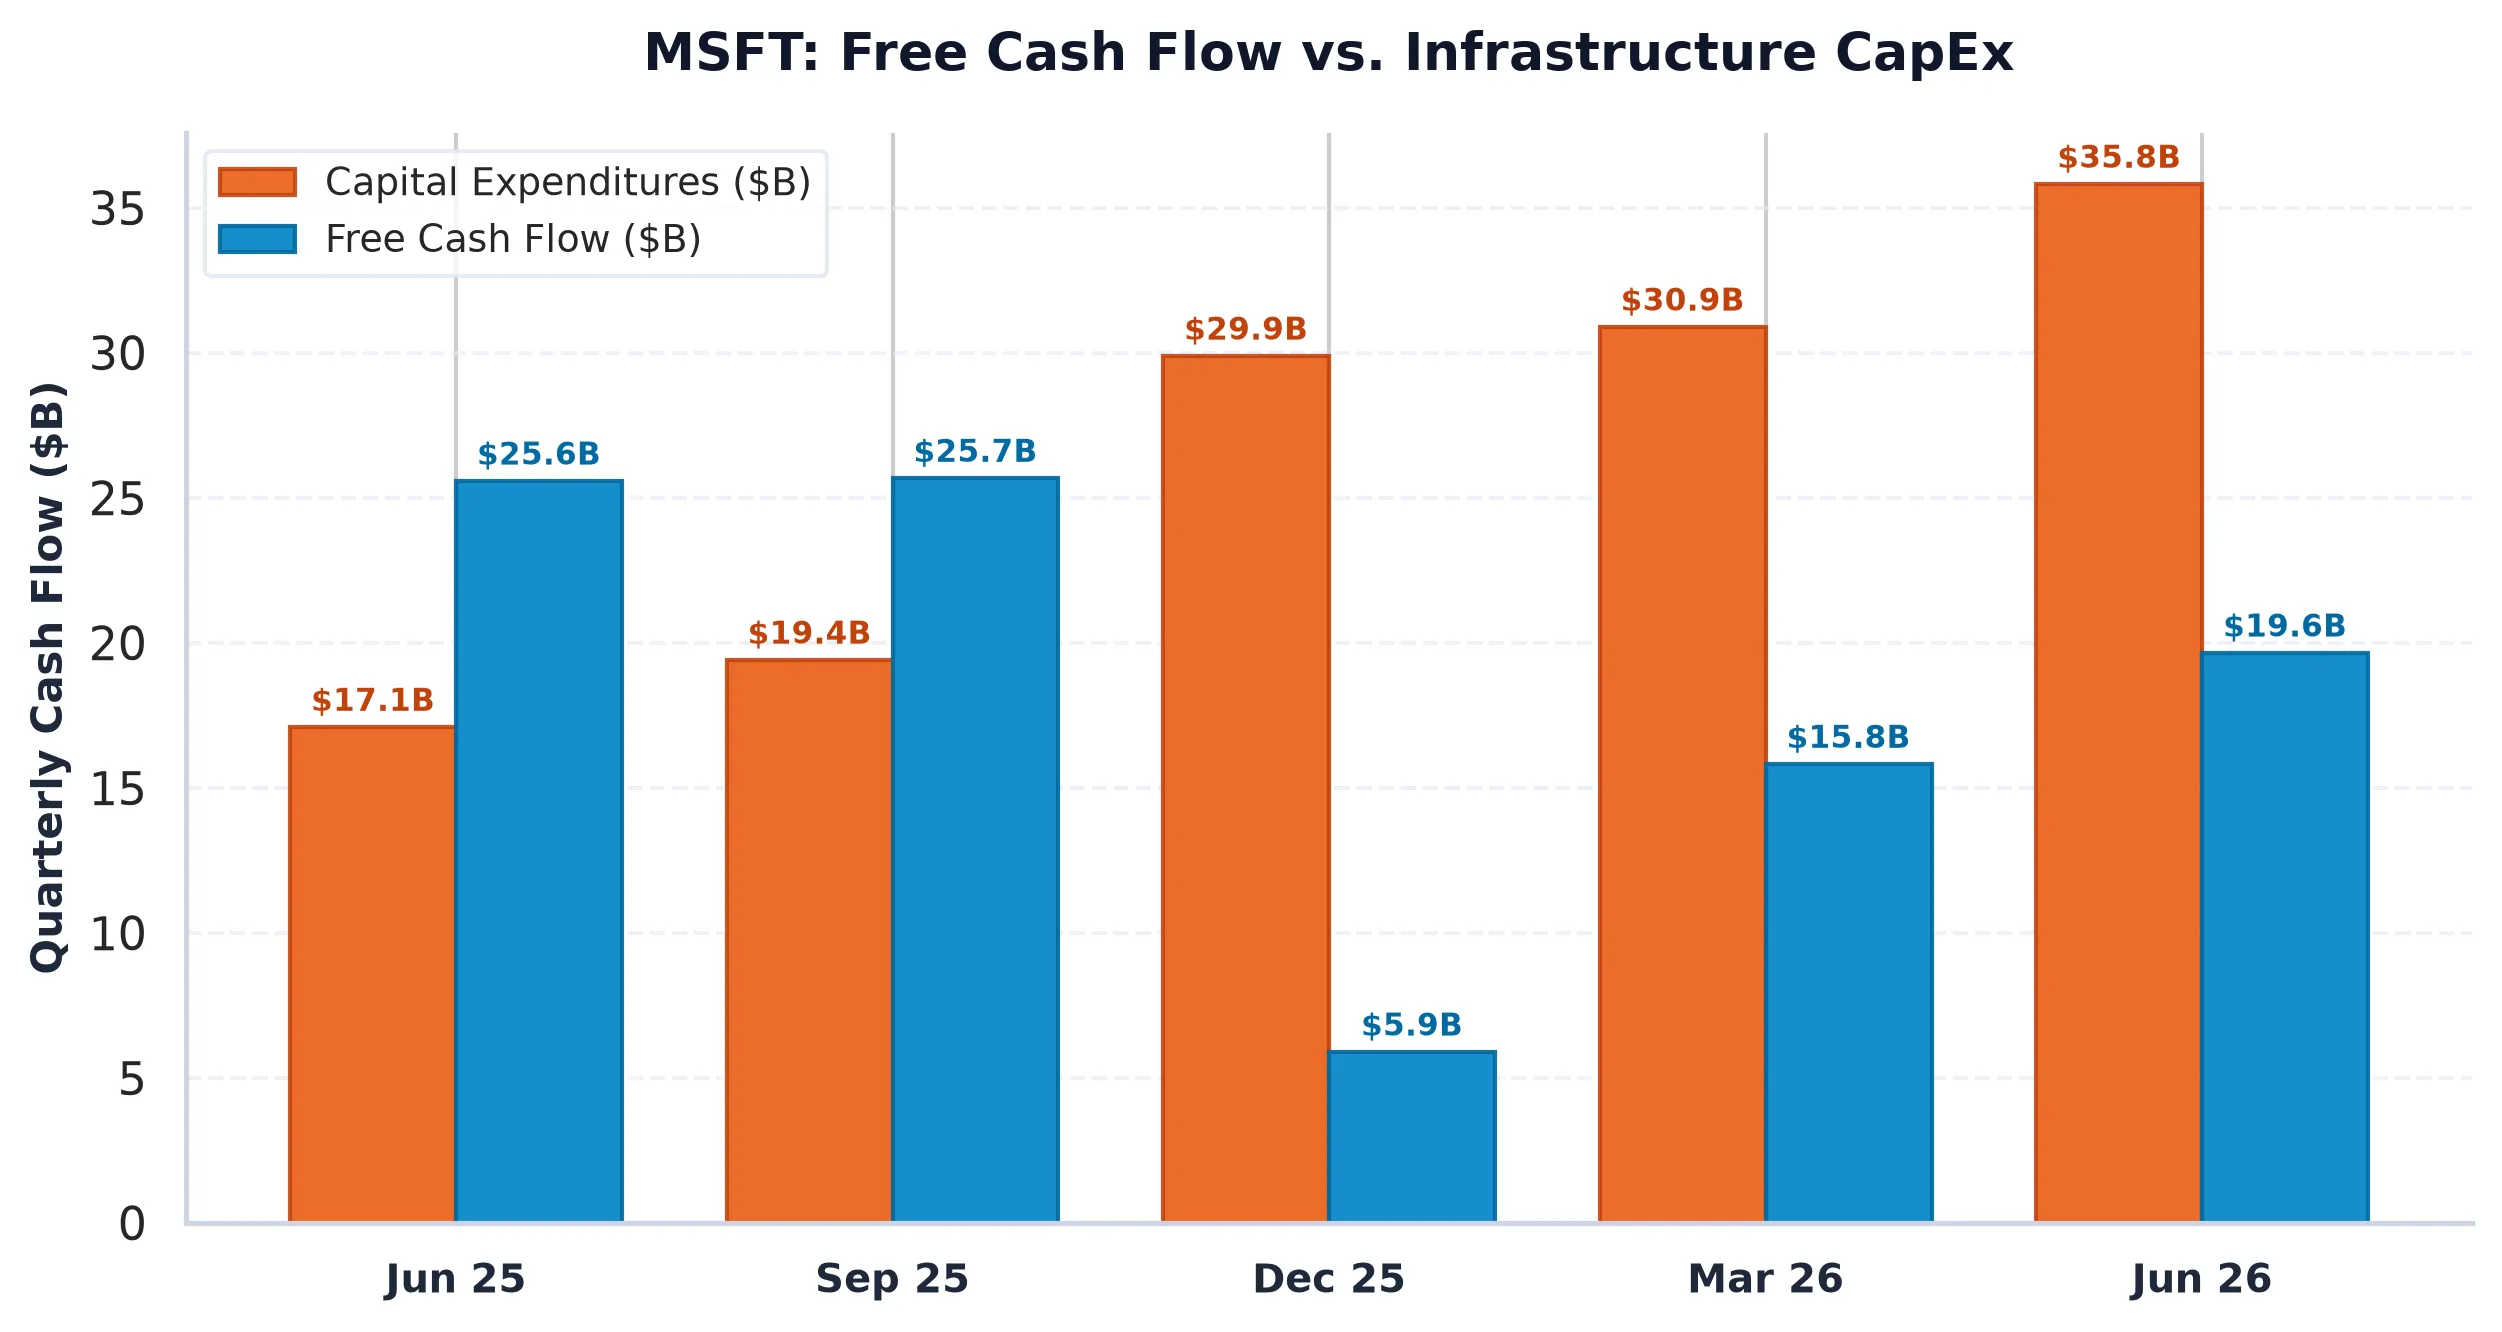
From a fundamental perspective, the numbers are jarring. Microsoft’s Free Cash Flow (FCF) yield sits at a meager 0.42%. When compared against the 4.99% yield of a 10-Year Treasury, Microsoft investors are effectively paying a 457 basis point “risk penalty” to own the equity. In a lower-rate environment, one could argue that this is just the price of admission for a dominant monopoly. But at 5.0% rates, the burden on Azure to deliver double-digit growth while absorbing $166 billion in depreciation-heavy CapEx is immense. The company’s net debt of $51.97 billion is negligible relative to its $3.9 trillion market cap, but the cash flow available for shareholder returns is being cannibalized by the AI arms race.
The market structure data reveals a speculative call overhang. Options dealers are currently seeing bullish call inflows, which creates a “speculative long skew.” This positioning acts as a tailwind as long as the stock moves higher, but it leaves Microsoft vulnerable to a sharp air pocket if the earnings report is merely “good” rather than “transformative.” With an expected 30-day move of only +/- 0.22% priced into the implied volatility, the options market appears dangerously complacent heading into a report where the stakes for capital allocation have never been higher.
If Microsoft can prove that its 50% CapEx intensity is translating into immediate, high-margin revenue, the multiple might hold. If not, the market may start to view that $166 billion not as an investment, but as a mandatory tax to stay relevant in a commoditizing AI landscape.
| Metric | Value |
|---|---|
| AllWallSt Investment Verdict | HOLD |
| FCF Yield vs 10Y Spread | -4.57% |
| CapEx Intensity | 50.14% |
| Market Structure Bias | Speculative Call Overhang |
Microsoft Corporation (MSFT)
Trailing P/E
Marcus Wolfe Screen
Leverage Profile
30D Channel
MODERATE WATCHLIST (1 flag): Inventory growth outpaced COGS growth by >15%, signaling potential inventory bloat or pending margin compression.
Manageable liability structure relative to institutional cash flow.
Evaluated against 5.10% US 10-Yr Benchmark (FCF Spread: -4.57% (vs 10Y Yield of 4.99%)).
Max Pain: $270.00 (-49.18%) | P/C Ratio: 0.0 | 30D Channel: $493.25 – $569.41.
$488.82 – $510.08 (-4% to -8% Pullback Accumulation)
Sustained weekly close below $478.20 (-10.0% structural stop) or fundamental cash flow deterioration.