
The consensus on Mastercard Incorporated (MA) is that it is the ultimate “toll booth” on global commerce. If people buy things, Mastercard takes a slice. If there is inflation, the slice gets bigger in nominal terms. It is a beautiful business model that requires almost no capital expenditure, only 1.36% of revenue, and produces operating margins of 61%. This is why the stock jumped nearly 5% after its Q3 2026 earnings beat. When you report double digit growth in a world of macro uncertainty, the market usually says thank you and asks for more.
However, there is a technical problem with owning a toll booth when the government is paying nearly 5% on its debt. A rigorous valuation audit shows that Mastercard’s Free Cash Flow (FCF) yield currently sits at a meager 3.05%, or 2.94% net of $600 million in stock-based compensation. This creates a negative spread of 1.93% against the 10-Year Treasury. In simpler terms, you are accepting less cash yield to own a volatile equity than you would get for holding risk-free sovereign paper. This is the Equity Risk Premium problem. Usually, you want to be paid more for taking the risk that the toll booth might break. Right now, you are paying for the privilege of the risk.
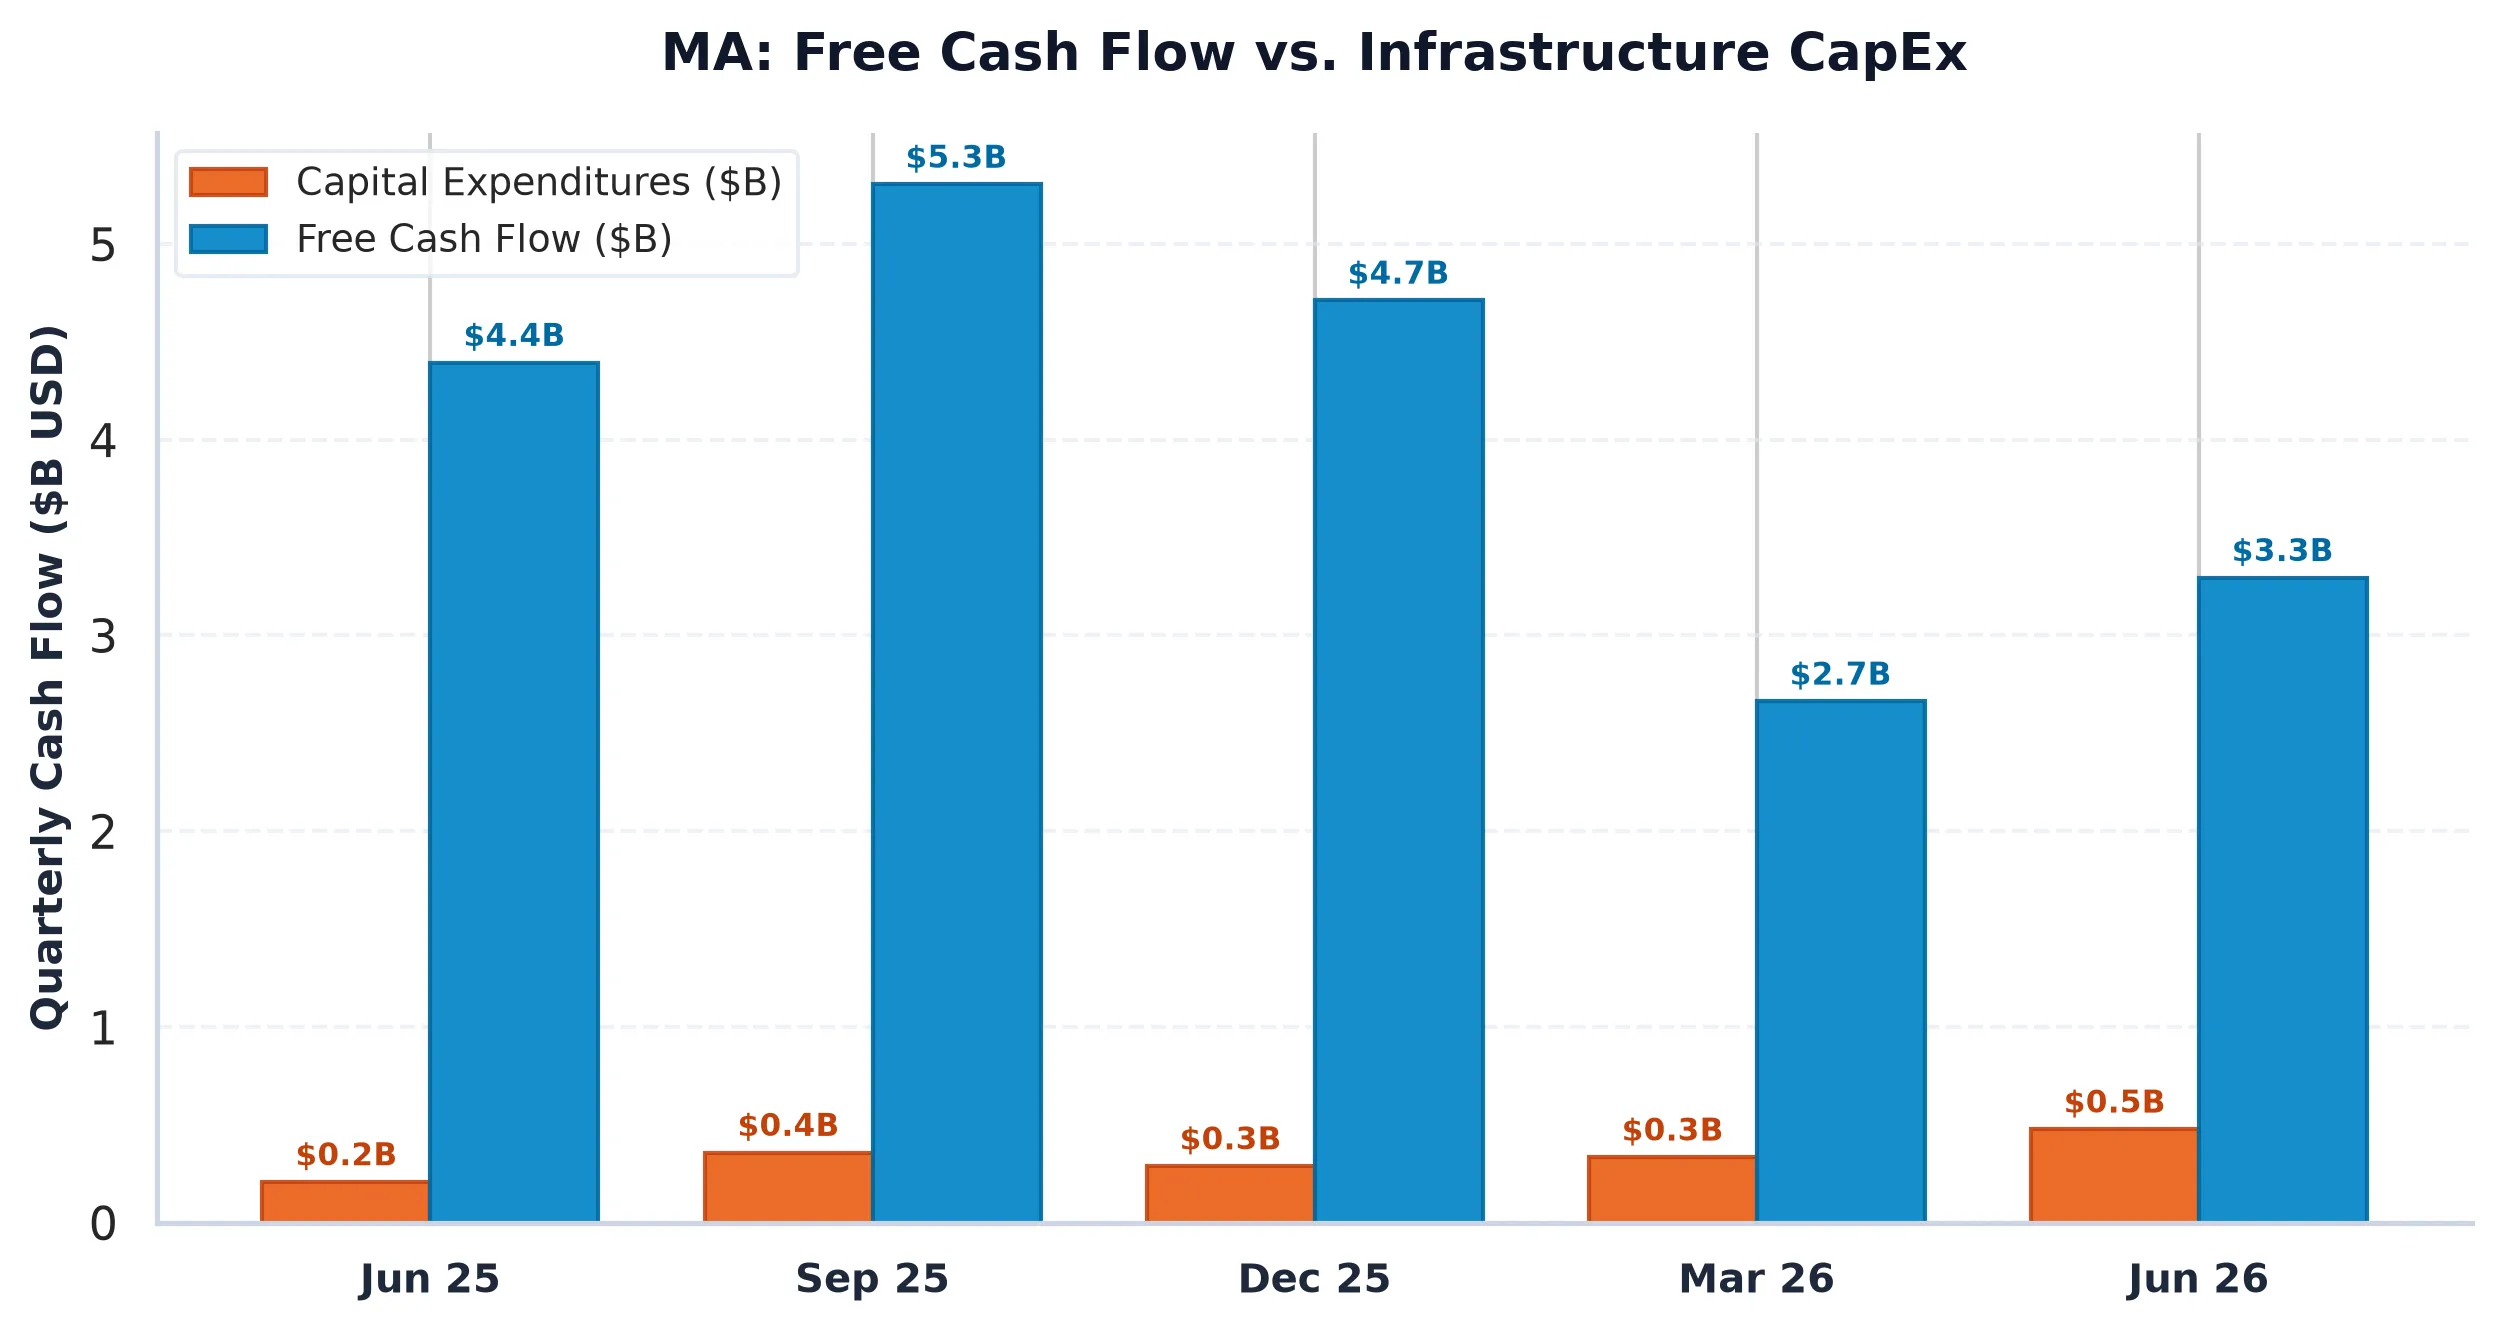
The valuation is currently 35 times trailing earnings. To justify that multiple in a high interest rate environment, you need growth that is not just good, but extraordinary. While 14.1% revenue growth is impressive for a company with a $555 billion market cap, it barely keeps pace with the valuation gravity. The company spent $11.73 billion on share repurchases over the last year, which is a 2.11% buyback yield. That helps, but it is mostly a mechanism to maintain the current altitude rather than a catalyst for a breakout.
Then there is the market plumbing. Across the options market structure, while the stock is trading at $634.47, the Max Pain strike for the options market is anchored much lower at $600.00. There is a formidable Call Wall at $650 (1,531 contracts), where institutional sellers are positioned to defend upside resistance, while primary Put Support sits down at $565. With an at-the-money implied volatility of 40.94%, the market is pricing in a $74.49 move in either direction over the next 30 days. If the post-earnings momentum stalls at that $650 ceiling, the mechanical gravity of the options market could pull the price back toward the $600 level where the most contracts expire worthless.
The consensus is that Mastercard is a safe haven. The data suggests it is a very expensive haven where the safety is priced to perfection. If global consumer spending ticks down even slightly, that negative yield spread against Treasuries becomes a very uncomfortable place to stand. Investors are currently paying a premium for a business model that, while brilliant, offers less economic yield than a simple bond.
Mastercard Incorporated (MA)
Trailing P/E
Marcus Wolfe Screen
Leverage Profile
30D Channel
Pristine cash flow conversion (1.18x) and healthy accrual ratio (-4.95%). Zero accounting anomalies detected (LOW ANOMALY RISK).
Prudent Leverage (0.59x Net Debt/EBITDA); well within investment-grade covenant headroom.
Negative yield spread (-1.93% vs 5.10% Treasury); equity requires robust multiple expansion or sustained transaction growth.
Max Pain: $600.00 (-5.43%) | P/C Ratio: 0.91 | 30D Channel: $559.98 – $708.96. Dealer gamma bounded between $565 Put Wall and $650 Call Wall.
MA represents a core ~1.0% index pillar. Institutional managers face persistent benchmark drag if under-allocated during sector rallies, biasing sell-side consensus toward institutional overweight.
$553.70 – $576.30 (Options Support Pinning)
Sustained weekly close below $565.00 (Put Wall) or operating margin compression below 61.11%.
Sources & References
- Official SEC Form 10-K Annual Report (Filed 2026-02-11)
- Mastercard Incorporated SEC EDGAR Filings
- Mastercard Investor Relations
- SEC Form 10-Q Filed October 29, 2026
Regulatory Disclaimer: This report is for informational purposes only and does not constitute investment, legal, or tax advice. The analytical data provided is derived from public SEC filings and market structure calculations. Past performance is not indicative of future results. All investments involve risk, including the possible loss of principal. AllWallSt and its contributors are not registered investment advisors. Consult with a certified financial professional before making any capital allocation decisions.