
If you spent your Friday morning reading the financial wires, you likely encountered a very specific, very polished narrative regarding ExxonMobil Holdings Corporation (XOM). The story goes like this: the company is a well-oiled machine (pun intended), it just beat third-quarter profit estimates, and it is currently “cashing in” on a refining boom while raising its dividend for the forty-fourth consecutive year. This is the kind of news that makes institutional portfolio managers feel warm and fuzzy, especially those who are mandated to hold a 1.4 percent weighting in the stock simply because it is a pillar of the S&P 500.
There is, however, a slight tension between the celebratory headline and the cold, mathematical reality of capital allocation. ExxonMobil reported a net income of approximately $32.7 billion on revenue of $361 billion. That is a lot of money. But in a world where the risk-free rate (the 10-Year Treasury yield) is sitting at 5.10 percent, the way we value that money has changed. When you buy a share of ExxonMobil today at $185.78, you are buying a free cash flow yield of 2.71 percent.
This creates a fascinating paradox. You can lend money to the United States government and receive a 5.10 percent yield with essentially zero risk of the government failing to find a printing press. Or, you can buy a stake in a complex, cyclical, capital-intensive global energy giant and receive a cash flow yield that is 2.39 percentage points lower than the government bond. Usually, investors demand a “risk premium” to own equities. Right now, ExxonMobil is trading at a “risk discount.”
The Refining Boom and the 10-K Reality
The primary driver of the recent “beat” was the downstream refining segment. Refining is a beautiful business when it works: you take a barrel of crude, run it through a massive, expensive chemistry set, and sell the resulting gasoline and diesel for more than the cost of the crude plus the chemistry. When global capacity is tight, “crack spreads” widen, and ExxonMobil’s massive scale allows it to capture enormous margins.
But if we look at the multi-year historical fundamental trajectory, a more nuanced picture emerges. In fiscal year 2022, ExxonMobil generated $398.68 billion in revenue with an operating margin of 16.1 percent. By fiscal year 2025, revenue had drifted down to $323.90 billion and operating margins compressed to 10.5 percent. While the Q3 2026 results show a tactical rebound in margins to 15.86 percent, the long-term trend suggests that the company is working harder to earn the same dollar.
| Period | Revenue | Operating Income | Operating Margin | Free Cash Flow |
|---|---|---|---|---|
| FY2022 | $398.68B | $64.03B | 16.1% | $58.39B |
| FY2023 | $334.70B | $44.46B | 13.3% | $33.45B |
| FY2024 | $339.25B | $39.65B | 11.7% | $30.72B |
| FY2025 | $323.90B | $33.94B | 10.5% | $23.61B |
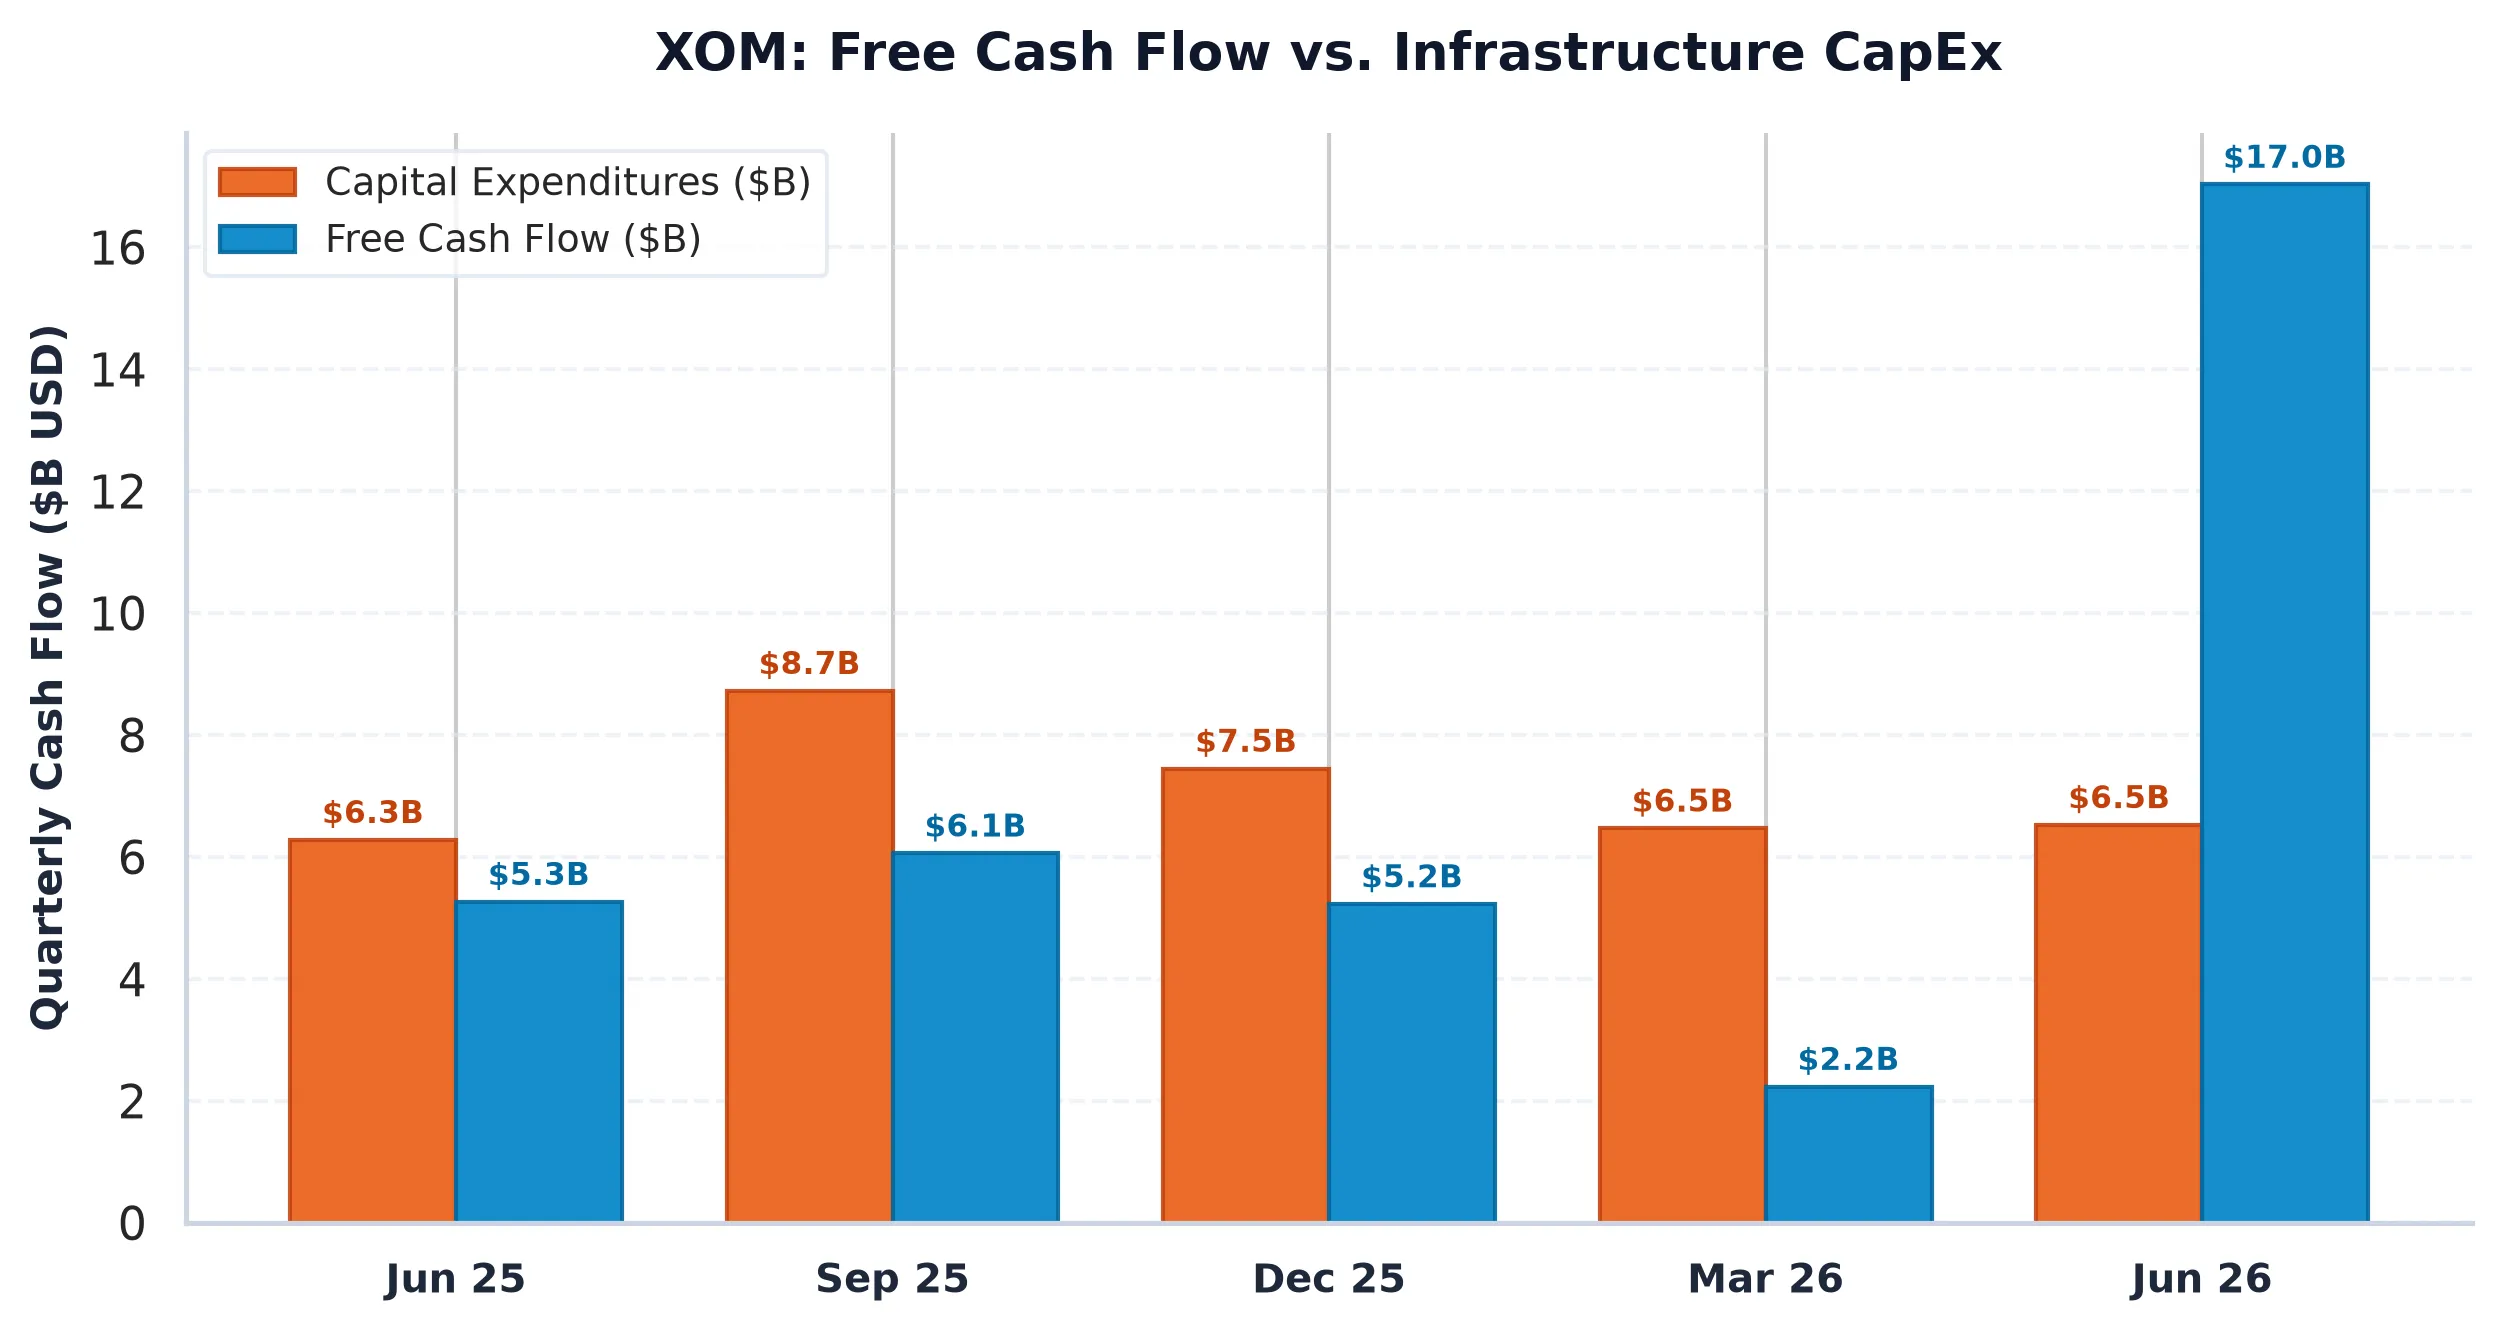
The company’s return on invested capital (ROIC) stands at 15.54 percent. This is comfortably above its weighted average cost of capital (WACC) of roughly 8.5 percent, which means the company is technically creating value. However, the capital intensity is high. ExxonMobil spent $39.06 billion on capital expenditures over the last twelve months. That is roughly $10.82 of every $100 in revenue just to keep the lights on, drill new holes, and integrate the Pioneer Natural Resources acquisition. When you are spending nearly $40 billion a year on “stuff,” your margin for error on the price of oil becomes uncomfortably thin.
The Peer Problem: Why Pay a Premium for Oil?
The most difficult part of the “Exxon is a Buy” consensus is the relative valuation. If you want exposure to the energy sector, you have options. Some of those options are significantly cheaper and, arguably, more efficient at returning cash to shareholders.
| Company (Ticker) | Market Cap | Forward P/E | EV/EBITDA | Rev Growth (YoY) | Operating Margin | FCF Yield |
|---|---|---|---|---|---|---|
| ExxonMobil Holdings (XOM) | $763.9B | 15.5x | 11.7x | 44.10% | 15.86% | 2.71% |
| Chevron (CVX) | $461.5B | 14.9x | 9.6x | 53.5% | 21.9% | 4.75% |
| ConocoPhillips (COP) | $183.8B | 14.2x | 7.3x | 35.5% | 31.5% | 4.18% |
| Shell PLC (SHEL) | $307.7B | 9.9x | 5.0x | 39.9% | 20.1% | 9.41% |
Consider Shell PLC. It trades at less than 10 times forward earnings and offers a free cash flow yield of 9.41 percent. Chevron, ExxonMobil’s closest domestic rival, boasts a 21.9 percent operating margin compared to Exxon’s 15.86 percent. Even ConocoPhillips, which lacks the “refining boom” diversification, manages an operating margin of 31.5 percent.
So why does ExxonMobil trade at a premium? Part of it is the “Permian Gravity” we discussed in our prior analysis on October 14. The acquisition of Pioneer made ExxonMobil the undisputed king of the Permian Basin, providing a level of geological certainty that few others can match. But at $185 per share, you are paying for that certainty twice over. Since our last rating (a BUY at $174.08), the stock has climbed over 6 percent. While the operational execution has been flawless, the valuation has moved from “attractive” to “fairly valued” to “slightly stretched.”
Options Plumbing and the Gravity of Max Pain
When fundamentals become disconnected from the cost of capital, we often look to the options market to see where the “plumbing” is likely to leak. Currently, the options market structure for ExxonMobil suggests a degree of complacency. The Put/Call Open Interest ratio is 0.69, indicating that traders are much more interested in betting on further upside than hedging against a drop.
However, the “Max Pain” strike price, the level where the most options contracts expire worthless, sits at $177.50. This is 4.46 percent below the current spot price. In the world of dealer gamma hedging, this creates a magnetic pull. If the post-earnings euphoria begins to fade, dealers who are long calls will need to sell the underlying stock to remain delta-neutral, potentially accelerating a move back toward that $177.50 anchor.
There is also a massive Call Wall at $202.50 and secondary resistance at $185.00. Given that we are currently trading right at that $185 level, the stock is fighting against a structural ceiling. For the price to break through and stay there, we would need to see a sustained increase in crude prices or an even more dramatic expansion in refining margins, neither of which is guaranteed in an environment where global growth is showing signs of cooling.
The Verdict: Auditing the Thesis
Sixteen days ago, we liked ExxonMobil at $174. The thesis then was that the market was underestimating the efficiency gains from the Pioneer integration. We have seen those gains start to materialize in the Q3 numbers. Production is up, and the synergy realization is ahead of schedule.
But a good investment is not just about a good company; it is about a good price. At $185.78, the “equity risk premium” has vanished. You are being asked to take on the risk of global oil price volatility, geopolitical instability in Guyana, and the cyclicality of refining margins for a yield that is significantly lower than what you can get from a boring Treasury bond.
Wall Street consensus remains “Overweight,” largely because no fund manager wants to be under-allocated to the largest energy company in the world if oil spikes to $100. That is career-risk management, not capital management. From a pure fundamental perspective, the stock has reached a point of equilibrium. The “easy money” from the October dip has been harvested.
We are moving to the sidelines. The business is performing exceptionally well, but the market has noticed, and the price now reflects that excellence. Until the free cash flow yield moves back into a competitive range with sovereign debt, or we see a significant flush in the options market toward the Max Pain support, patience is the most productive position.
AllWallSt Investment Verdict: HOLD (Downgrade from BUY)
ExxonMobil Holdings Corporation (XOM)
Trailing P/E
Marcus Wolfe Screen
Leverage Profile
30D Channel
MODERATE WATCHLIST (1 flag): Inventory growth outpaced COGS growth by >15%, signaling potential inventory bloat or pending margin compression.
Prudent Leverage (0.47x Net Debt/EBITDA); well within investment-grade covenant headroom.
Negative yield spread (-2.24% vs 5.10% Treasury); equity requires robust multiple expansion or growth.
Max Pain: $177.50 (-4.46%) | P/C Ratio: 0.69 | 30D Channel: $168.56 – $203.00. Dealer gamma bounded between $175 Put Wall and $202.5 Call Wall.
XOM represents a core ~1.4% index pillar. Institutional managers face persistent benchmark drag if under-allocated during sector rallies, biasing sell-side consensus toward institutional overweight.
$171.50 – $178.50 (Options Support Pinning)
Sustained weekly close below $175.00 (Put Wall) or gross margin compression below 29.77%.
Sources & References
- Official SEC Form 10-K Annual Report (Filed 2026-02-18)
-
ExxonMobil Investor Relations: https://corporate.exxonmobil.com
- SEC EDGAR Search (CIK 0000034088): https://www.sec.gov/edgar/browse/?CIK=0000034088
- ExxonMobil Q3 2026 Earnings Presentation (Filed Oct 30, 2026)
- ExxonMobil 2025 Form 10-K (Filed Feb 18, 2026)
Regulatory Disclaimer: This report is for informational purposes only and does not constitute investment advice, a recommendation, or an offer to buy or sell any security. AllWallSt is a financial journalism outlet and is not a registered investment advisor. Investing in equities, particularly in the energy sector, involves significant risk, including the potential loss of principal. Past performance is not indicative of future results. Metrics and data points are sourced from primary SEC filings and market data feeds as of the date of publication. Always consult with a qualified financial professional before making any investment decisions.