
The broader market had a miserable week, which is the sort of sentence that financial columnists get to write whenever the Nasdaq 100 decides to shed 3.4% in five days. While the high-flying technology hyperscalers were busy accounting for their massive artificial intelligence capital expenditures, Lockheed Martin Corporation (LMT) was doing something much more traditional. It was sitting on a mountain of government-guaranteed contracts and looking remarkably sturdy. There is a certain institutional comfort in a business where the primary customer has a sovereign printing press and a perpetual need for advanced kinetic solutions.
The Friday market post-mortem reveals a striking divergence. While the E-Mini Nasdaq 100 Futures collapsed under the weight of valuation gravity, Lockheed Martin maintained its poise near the $636 level. This is not merely a flight to safety. It is a recognition of a shifting capital regime. In a world where the 10-Year Treasury yield sits at 4.93%, the hurdle for equity performance has moved. You can no longer just promise growth in the year 2035. You have to show a return on invested capital (ROIC) that makes the risk-free rate look like pocket change. Lockheed Martin, with an ROIC of 28.92%, is currently doing exactly that.
The Mechanics of the Backlog Moat
To understand Lockheed Martin, you have to look past the hardware and into the accounting of long-cycle industrials. The company recently reported a surging backlog, a metric that serves as a multi-year visibility shield against economic volatility. When the market worries about a recession, Lockheed Martin points to its $130 billion plus order book. This is not a “hopeful” pipeline. These are funded or authorized programs that represent years of future revenue.
Looking at the multi-year trajectory, we see a company that has navigated the post-pandemic supply chain mess with surprising agility. In FY2022, revenue stood at $65.98 billion. By FY2025, that figure climbed to $75.05 billion. More importantly, the operating income has remained resilient. While the operating margin took a temporary dip to 9.9% in 2024, likely due to the digestion of fixed-price development contracts and inflationary pressures on labor, it has bounced back to 11.4% in the current period.
The secret sauce here is the capital allocation. Lockheed Martin is not just a defense contractor: it is a cash-return engine. The total shareholder yield of 4.28% is composed of a 2.24% dividend and a 2.04% buyback yield. This is significant because the company is managing to do this while maintaining a Net Debt / EBITDA ratio of only 1.47x. In an environment where the cost of debt has tripled for many corporations, Lockheed Martin’s balance sheet remains an institutional fortress. We should also note the quality of the cash flow. Stock-based compensation (SBC) is a mere 3% of operating cash flow. In the tech sector, that number often reaches 20% or 30%, meaning much of what is called “free cash flow” is actually just a transfer of wealth to employees. At Lockheed Martin, the cash belongs to the owners.
Peer Relative Valuation and the ROIC Spread
When we compare Lockheed Martin to its direct peers in the aerospace and defense sector, the valuation argument becomes even more compelling. The market is currently paying a premium for operational consistency and scale. Lockheed Martin trades at a forward P/E of 19.1x, which is a discount to RTX Corporation (RTX) at 24.8x, despite Lockheed Martin boasting superior top-line growth at 11.3%.
| Company (Ticker) | Market Cap | Forward P/E | EV/EBITDA | Rev Growth (YoY) | Operating Margin | FCF Yield |
|---|---|---|---|---|---|---|
| Lockheed Martin (LMT) | $147.1B | 19.1x | 16.6x | 11.30% | 11.40% | 3.84% |
| RTX (RTX) | $269.6B | 24.8x | 17.7x | 11.1% | 15.5% | 3.08% |
| Northrop Grumman (NOC) | $79.2B | 18.6x | 12.8x | 6.7% | 12.9% | 3.97% |
| General Dynamics (GD) | $100.8B | 20.0x | 15.9x | 8.1% | 10.4% | 4.36% |
The comparison with Northrop Grumman (NOC) and General Dynamics (GD) is particularly instructive. While NOC and GD offer slightly higher free cash flow yields, they are growing at significantly slower rates (6.7% and 8.1% respectively). Lockheed Martin has found the “Goldilocks” zone: it is growing faster than the diversified defense peers but trading at a significant multiple discount to the aerospace-heavy RTX.
Furthermore, the 28.92% ROIC produced by Lockheed Martin is the standout figure in this group. It indicates that for every dollar of capital the company employs, it is generating nearly 29 cents of return. When your weighted average cost of capital (WACC) is roughly 8.5%, you are creating an immense amount of economic value. This spread is what allows the company to continue its $3 billion annual share repurchase program without stressing the balance sheet.
Quantitative Plumbing and the October Pin
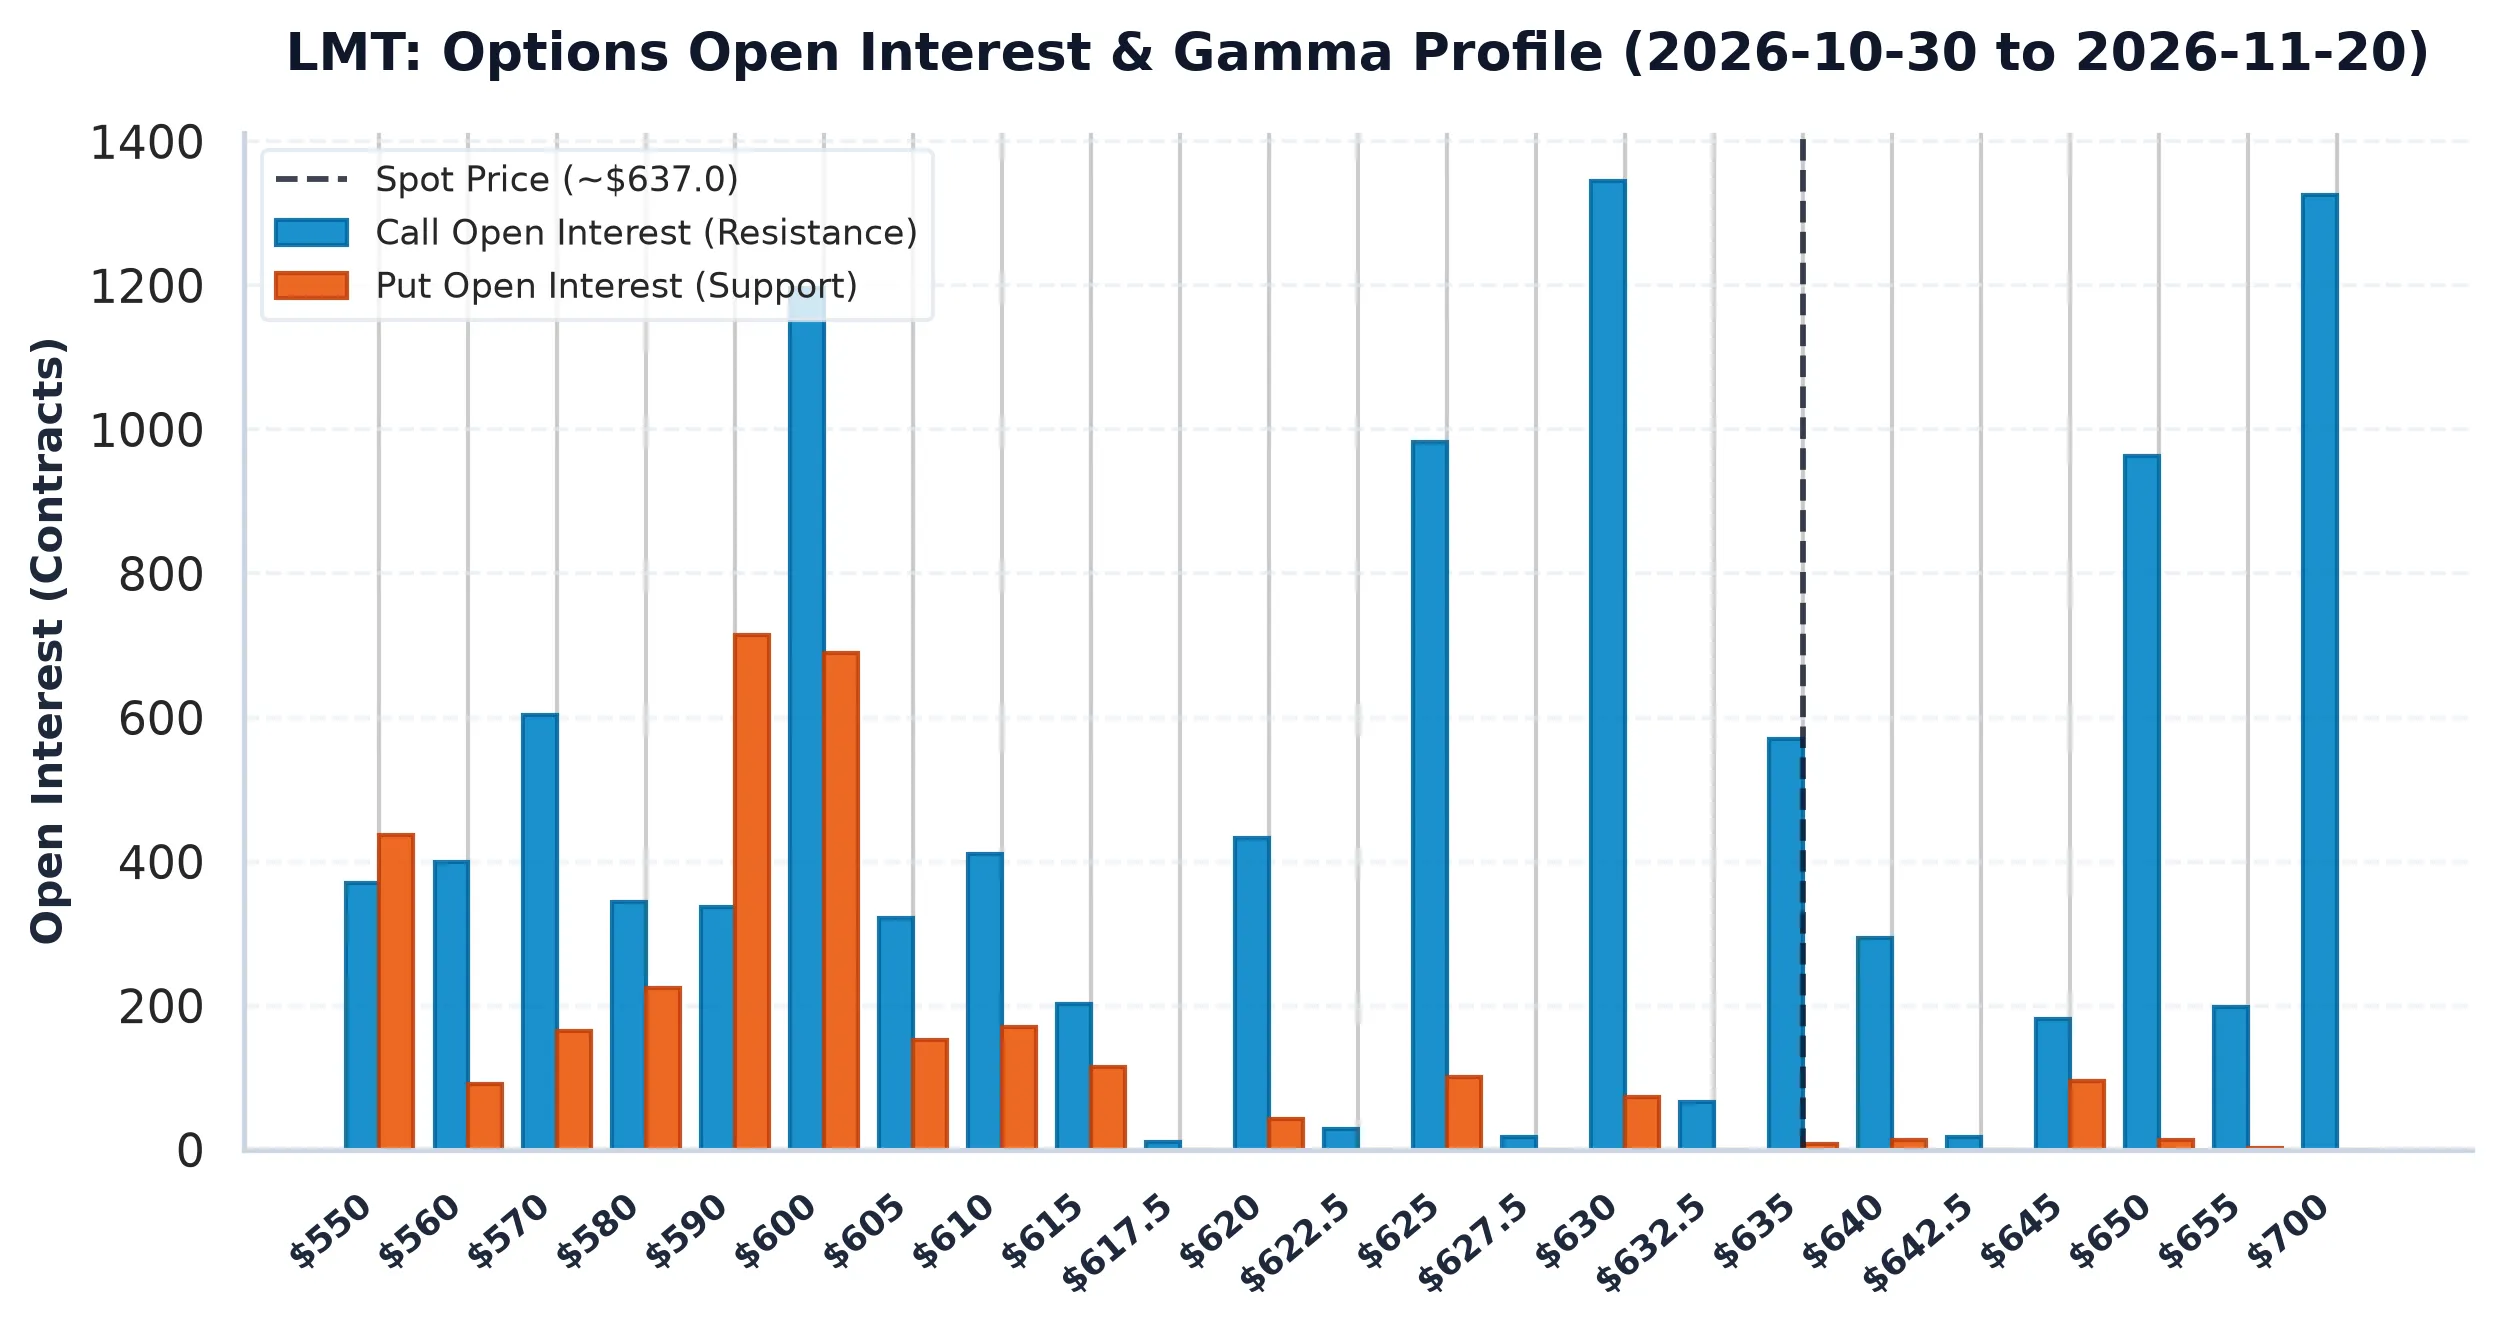
From a market structure perspective, Lockheed Martin has spent the week defying the gravity of the broader indices. The options market shows a Put/Call Open Interest ratio of 0.75, which suggests a healthy, if not slightly bullish, lean from institutional hedgers. However, the most interesting data point is the Max Pain strike at $580. Typically, when a stock is trading more than 8% above its Max Pain level, you would expect a mechanical pull toward that strike as dealers hedge their delta exposure into Friday’s expiration.
The fact that Lockheed Martin refused to mean-revert toward $580 tells us that the “real money” demand is currently overwhelming the dealer hedging flows. There is a massive Call Wall at $630, with nearly 900 contracts sitting there. Throughout the week, this $630 strike acted as a ceiling. Every time the stock tried to break out, dealers who sold those calls had to sell the underlying stock to stay neutral, effectively pinning the price.
Looking forward, the 30-day expected move is +/- 13.01%, or roughly $82. This is a wide envelope, reflecting the 45.37% implied volatility. If the stock can decisively break and hold above the $630 Call Wall, the next major resistance is at $650. Given the balanced gamma profile, Lockheed Martin is essentially a coiled spring. It has absorbed the volatility of a 3% Nasdaq selloff without breaking its own technical structure.
The Institutional Verdict
The investment case for Lockheed Martin is built on the intersection of geopolitical necessity and disciplined capital management. While the 3.84% free cash flow yield is technically lower than the 4.93% offered by the 10-Year Treasury, this is a classic “yield trap” for the unimaginative. The Treasury bond gives you a fixed coupon that loses value to inflation. Lockheed Martin gives you a 2.2% dividend that grows, backed by a 29% ROIC and a $130 billion backlog that is essentially indexed to the defense budget.
The recent partnership with Firefly Aerospace and the continued dominance of the F-35 program provide both a floor and a ceiling for the growth narrative. We are looking at a company that is successfully transitioning from a legacy defense prime into a modern, high-margin aerospace powerhouse. The market structure suggests that institutional accumulation is keeping the stock elevated despite the broader market carnage.
AllWallSt Investment Verdict: BUY
Lockheed Martin Corporation (LMT)
Trailing P/E
Marcus Wolfe Screen
Leverage Profile
30D Channel
Pristine cash flow conversion (1.71x) and healthy accrual ratio (-5.92%). Zero accounting anomalies detected (LOW ANOMALY RISK).
Prudent Leverage (1.47x Net Debt/EBITDA); well within investment-grade covenant headroom.
Negative yield spread (-1.09% vs 5.10% Treasury); equity requires robust multiple expansion or growth.
Max Pain: $580.00 (-8.94%) | P/C Ratio: 0.75 | 30D Channel: $554.08 – $719.82. Dealer gamma bounded between $590 Put Wall and $630 Call Wall.
LMT carries standard index weighting (< 0.6% SPY footprint); sell-side consensus reflects standard earnings momentum rather than index-tracking mandates.
$578.20 – $601.80 (Options Support Pinning)
Sustained weekly close below $590.00 (Put Wall) or gross margin compression below 11.73%.
Sources & References
- Official SEC Form 10-K Annual Report (Filed 2026-01-29)
- Lockheed Martin Investor Relations
- SEC EDGAR: Lockheed Martin Corp (CIK 0000936468)
- Lockheed Martin Q3 2026 Form 10-Q
- U.S. Department of Defense Contract Awards
Regulatory Disclaimer: This report is for informational purposes only and does not constitute a recommendation to buy or sell any security. AllWallSt is a financial journalism outlet, not a registered investment advisor. Investing in equities involves substantial risk, including the loss of principal. Past performance is not indicative of future results. Information is sourced from primary SEC filings and market data feeds deemed reliable but not guaranteed for accuracy. Always consult with a qualified financial professional before making investment decisions.