
The semiconductor industry is currently divided into two distinct camps. In one camp, you have the high-drama world of generative AI, where companies spend billions on GPUs and hope that the resulting intelligence eventually pays for the electricity. In the other camp, you have Texas Instruments Incorporated (TXN), a company that spends its time thinking about voltage regulators, temperature sensors, and the thousands of tiny, unglamorous analog components that keep the modern world from melting. While the AI crowd captures the headlines, Texas Instruments has quietly built a capital allocation machine that would make a sovereign wealth fund blush.
The market, however, is currently feeling a bit of a chill. In the last 48 hours, Texas Instruments has seen its 12-month price target trimmed to $336.62 and its share price slip by roughly 4% following broader sector jitters. Even members of Congress are reportedly ditching their semiconductor holdings, including Texas Instruments, as part of a broader exit from the sector. This creates a fascinating dislocation. On one hand, you have the “Market Weight” consensus from Wall Street, which is essentially the analytical equivalent of a shrug. On the other hand, you have a business with a 31.7% Return on Invested Capital (ROIC) trading at a forward multiple that looks downright reasonable when compared to its compounding power.
The Core Thesis & Market Dislocation
The primary tension in Texas Instruments today is the gap between its long-term capital intensity and its short-term cash flow yield. If you look at the raw numbers, the company offers a Free Cash Flow (FCF) yield of 1.74%. In a world where the 10-Year Treasury yield is hovering around 5.10%, a 1.74% yield looks like a rounding error. This is what we call a negative equity risk premium: you are essentially paying the company for the privilege of taking on equity risk.
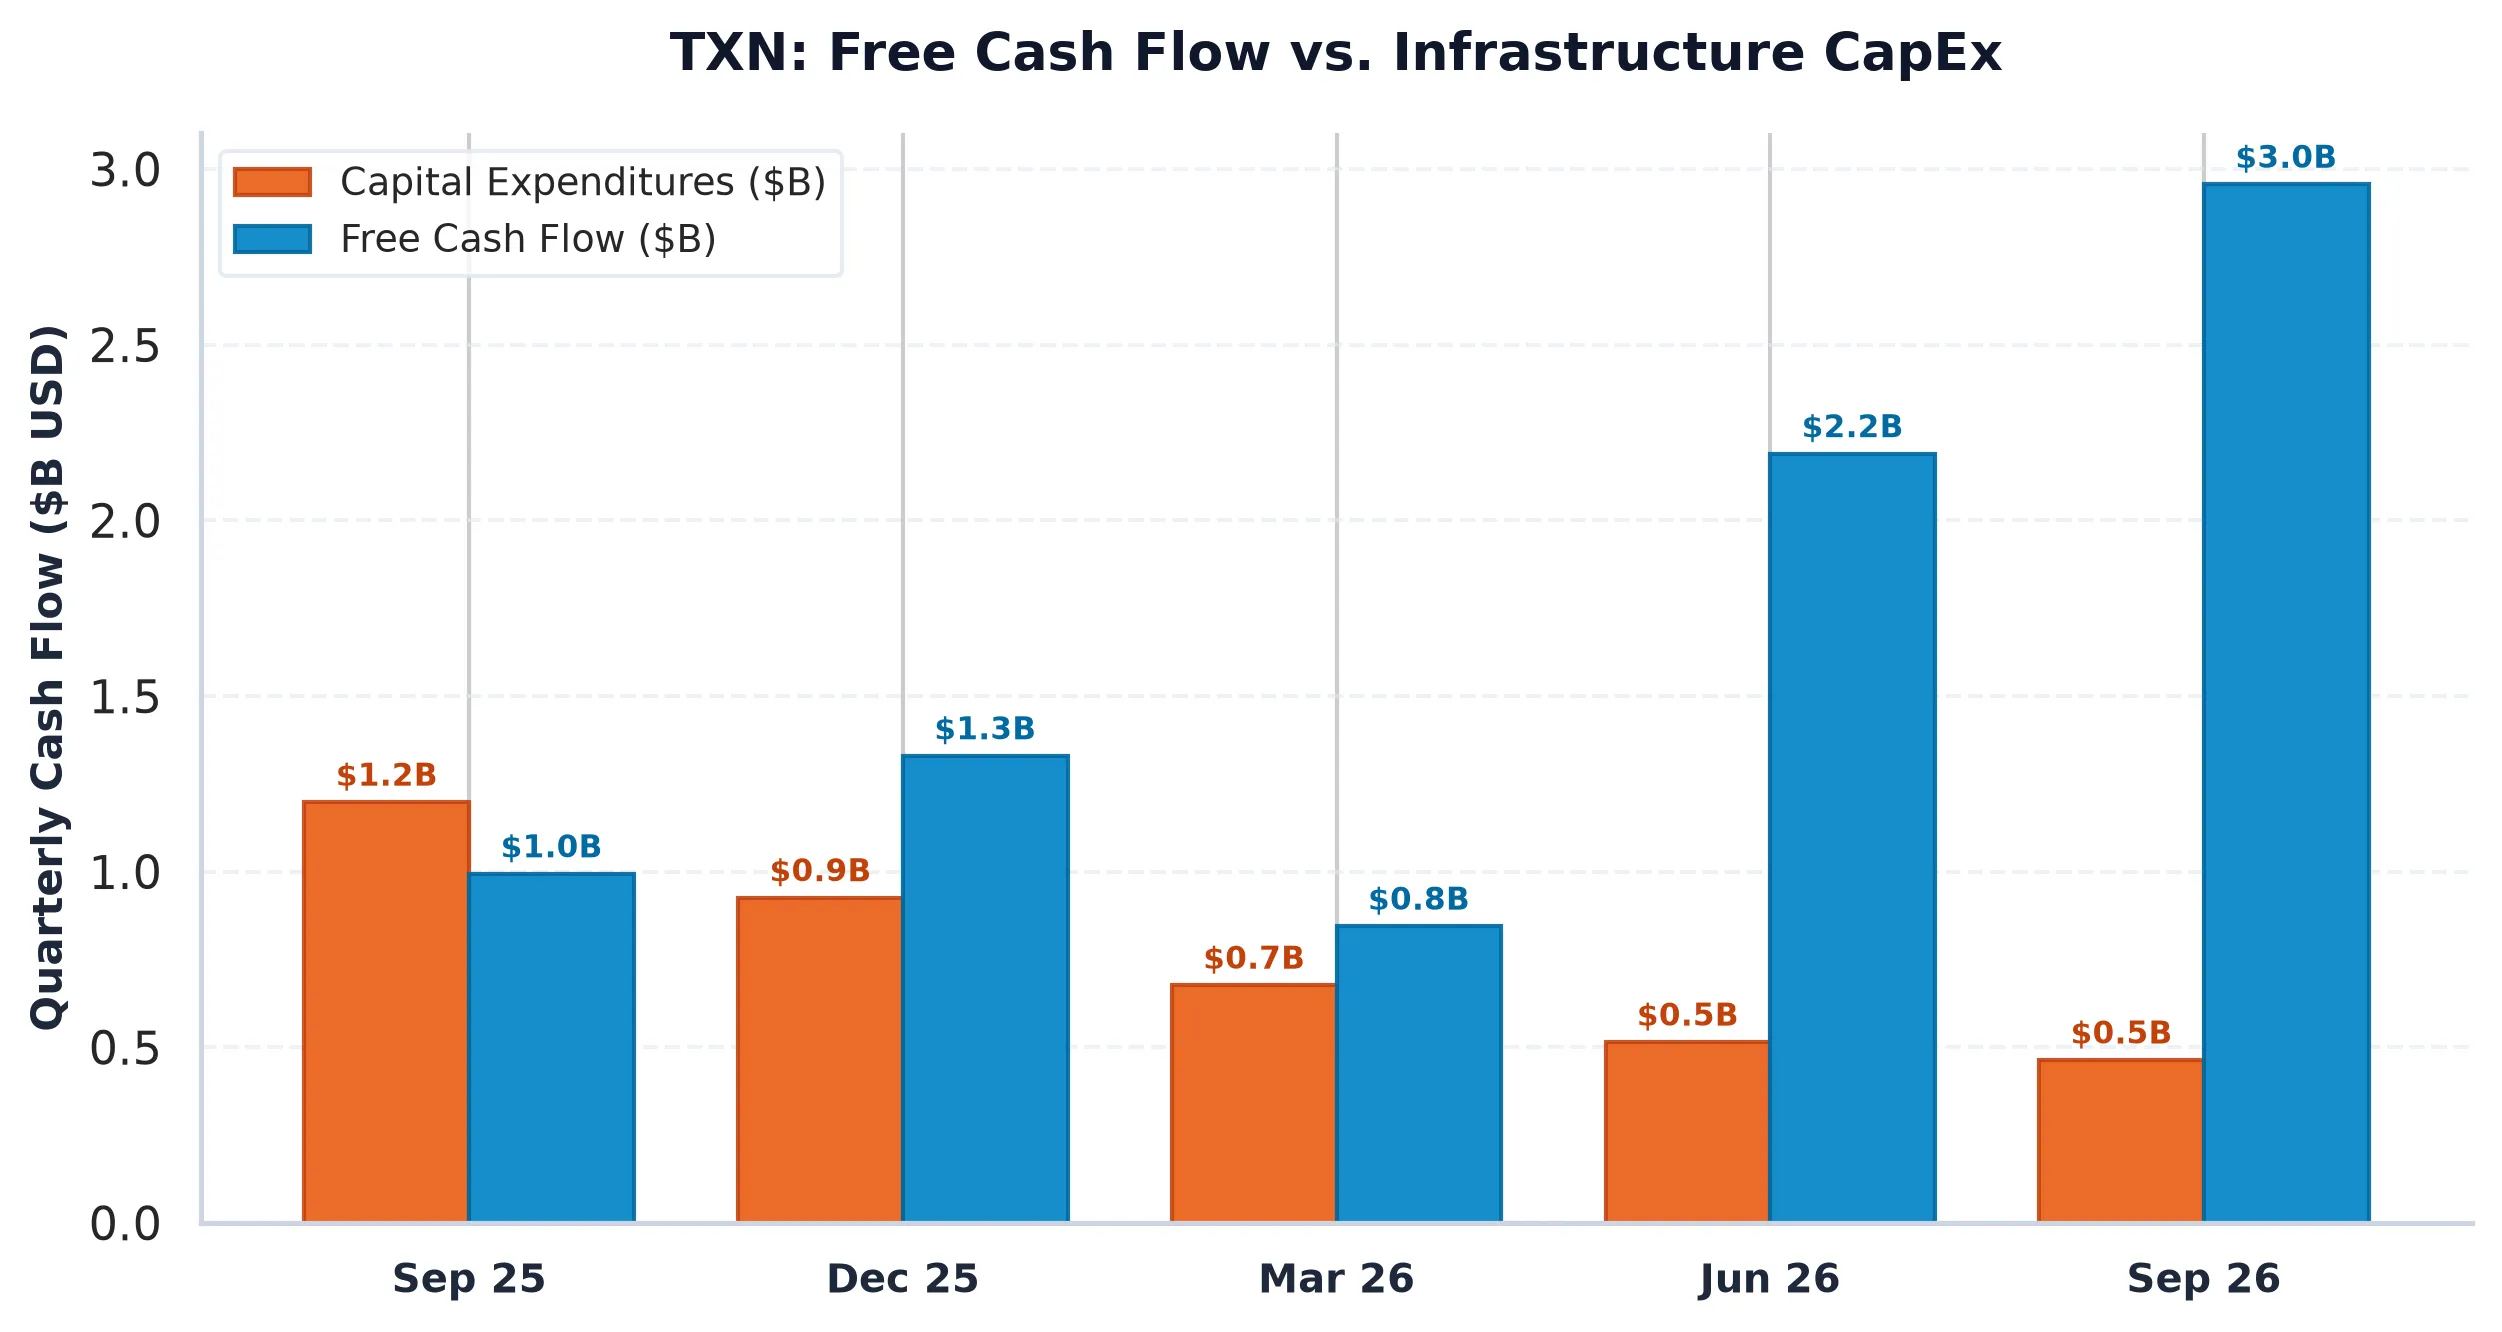
However, looking at static FCF yield for Texas Instruments is like judging a marathon runner by their heart rate while they are still stretching. The company is currently in the middle of a massive, multi-year CapEx cycle, spending $5.12 billion annually, or roughly 24.6% of its revenue. This is not “maintenance” CapEx. This is the company building out its internal 300mm wafer manufacturing capacity. Most semiconductor firms have moved to a “fab-lite” model, outsourcing the messy business of making chips to foundries. Texas Instruments is doing the opposite. By owning the factories, they control the cost and the supply chain, creating a structural margin advantage that competitors simply cannot replicate without a decade of lead time and a hundred billion dollars.
The recent 4% slide in the share price is a reaction to the macro cycle, but it ignores the fundamental durability of the analog business. Analog chips have product lifecycles that can span decades. A chip designed for a car’s braking system in 2024 will likely still be shipping in 2034. This is the “fine wine” of silicon: it does not go obsolete every eighteen months, and it generates high-margin cash flow long after the initial R&D has been amortized to zero.
Multi-Year Financial Trajectory, ROIC & Cash-Flow Mechanics
To understand where Texas Instruments is going, we have to look at where it has been. The company’s financial trajectory over the last four years reveals a business that is navigating a cyclical trough while simultaneously doubling down on its future.
| Period | Revenue | Operating Income | Operating Margin | Free Cash Flow | SBC Expense |
|---|---|---|---|---|---|
| FY2022 | $20.03B | $10.40B | 51.9% | $5.92B | $289.0M |
| FY2023 | $17.52B | $7.33B | 41.8% | $1.35B | $362.0M |
| FY2024 | $15.64B | $5.34B | 34.1% | $1.50B | $387.0M |
| FY2025 | $17.68B | $6.14B | 34.7% | $2.60B | $419.0M |
The dip in FY2024 revenue and margins was the result of a post-pandemic inventory correction in the industrial and automotive markets. However, the recovery in FY2025 shows the resilience of the model. Even at its “low” point, the company maintained operating margins above 34%. For context, most companies would sacrifice their firstborn for a 34% operating margin. Texas Instruments considers it a cyclical bottom.
Our audit of the company’s capital allocation reveals a high-quality approach to shareholder returns. Stock-Based Compensation (SBC) stands at $0.42 billion, which is only 4.2% of operating cash flow. In an era where Silicon Valley firms routinely use 20% or 30% of their cash flow to pay employees in dilutive equity, Texas Instruments is remarkably disciplined. The company spent $1.48 billion on share repurchases over the last year. Because the SBC expense is so low, these buybacks are actually doing what they are supposed to do: reducing the share count and increasing the ownership stake of remaining shareholders, rather than just “sterilizing” executive grants.
Furthermore, the ROIC of 31.7% is nearly four times the company’s estimated 8.5% WACC. This means that for every dollar Texas Instruments reinvests in its business, it is creating significant economic value. The 0.51x Net Debt / EBITDA ratio indicates a balance sheet that is essentially bulletproof, providing the company with the flexibility to continue its CapEx program regardless of what the Fed does with interest rates.
Peer Relative Valuation & Competitive Moat
When we compare Texas Instruments to other high-margin tech titans, the valuation begins to look even more attractive. The company sits in a unique spot: it has the margins of a software company but the physical moat of a heavy manufacturer.
| Company (Ticker) | Market Cap | Forward P/E | EV/EBITDA | Rev Growth (YoY) | Operating Margin | FCF Yield |
|---|---|---|---|---|---|---|
| Texas Instruments (TXN) | $275.0B | 26.1x | 26.2x | 27.70% | 47.55% | 1.74% |
| Microsoft (MSFT) | $3.88T | 21.6x | 19.2x | 18.8% | 49.8% | 0.08% |
| Alphabet (GOOGL) | $3.44T | 18.5x | 18.0x | 24.7% | 31.8% | -0.03% |
| Oracle (ORCL) | $396.1B | 11.8x | 15.5x | 29.6% | 35.6% | -11.58% |
Texas Instruments boasts an operating margin of 47.55%, which is competitive with Microsoft and significantly higher than Alphabet or Oracle. While it trades at a slight premium to the cloud giants on a Forward P/E basis (26.1x), it is delivering 27.7% revenue growth, which is faster than Microsoft or Alphabet.
The competitive moat here is the diversity of the customer base. Texas Instruments has over 100,000 customers and 80,000 products. Unlike a company that relies on a few “hyperscaler” cloud contracts, Texas Instruments is embedded in everything from medical imaging machines to smart thermostats. This fragmentation is a feature, not a bug: it makes the revenue stream incredibly difficult to disrupt. One competitor might build a better sensor for a specific smartphone, but nobody is going to build a better version of 80,000 different analog parts and convince 100,000 engineers to switch their designs overnight.
Options Gamma Pinning, Risk Bounds & Verdict
Turning to the market structure, the options data suggests that the recent selloff may be finding a structural floor. The Put/Call Open Interest ratio is 1.06, which indicates a balanced market with no excessive speculative froth. The Max Pain strike sits at $282.50, about 6% below the current price. This suggests that while there is some magnetic pull toward the downside as we approach expiration, the primary Put Wall at $240 offers a massive structural cushion that is unlikely to be tested without a systemic market collapse.
On the upside, the Call Walls at $300 and $310 represent the immediate resistance levels. If Texas Instruments can clear the $310 hurdle, the dealer hedging requirements (gamma unwinds) could provide a mechanical tailwind for a move back toward the 52-week highs. The expected 30-day move of +/- 14.76% is wide, reflecting the current volatility in the semiconductor sector, but the fundamental floor remains solid.
The reality of Texas Instruments is that it is a “Rule of 50” company (27.7% growth + 23% FCF margin) masquerading as a cyclical chip maker. The 26.1x forward multiple is a fair price to pay for a business that owns its manufacturing, has a 31.7% ROIC, and returns capital to shareholders with clinical efficiency. While the 10-Year Treasury might offer a higher immediate yield, it doesn’t offer the prospect of compounding its value through the inevitable electrification of the global economy. We view the recent price weakness as a tactical opportunity to own a core institutional compounder at a discount to its intrinsic value.
Investment Verdict: BUY
Texas Instruments Incorporated (TXN)
Trailing P/E
Marcus Wolfe Screen
Leverage Profile
30D Channel
Pristine cash flow conversion (1.43x) and healthy accrual ratio (-6.22%). Zero accounting anomalies detected (LOW ANOMALY RISK).
Prudent Leverage (0.51x Net Debt/EBITDA); well within investment-grade covenant headroom.
Negative yield spread (-3.19% vs 5.10% Treasury); equity requires robust multiple expansion or growth.
Max Pain: $282.50 (-6.10%) | P/C Ratio: 1.06 | 30D Channel: $256.44 – $345.24. Dealer gamma bounded between $240 Put Wall and $310 Call Wall.
TXN carries standard index weighting (< 0.6% SPY footprint); sell-side consensus reflects standard earnings momentum rather than index-tracking mandates.
$235.20 – $244.80 (Options Support Pinning)
Sustained weekly close below $240.00 (Put Wall) or gross margin compression below 60.24%.
Sources & References
- Official SEC Form 10-K Annual Report (Filed 2026-02-06)
- Texas Instruments Investor Relations: https://www.ti.com
- SEC EDGAR Filings (CIK 0000097476): https://www.sec.gov/edgar/browse/?CIK=0000097476
- Latest Form 10-Q (October 2026): https://www.sec.gov/Archives/edgar/data/97476/000009747626000169/txn-20260930.htm
- Primary Market Data & Options Flow: SEC EDGAR & Exchange Feeds.
Regulatory Disclaimer: This report is for informational purposes only and does not constitute investment advice, financial analysis, or a recommendation regarding any securities. The analysis provided is based on public filings and market data available at the time of writing. All investments involve risk, including the loss of principal. AllWallSt and its contributors are not registered investment advisors. Consult with a qualified financial professional before making any investment decisions.