
The business of making the machines that make the world is, generally speaking, a good business to be in. If you want to manufacture a semiconductor that is smaller, faster, or more efficient than the one your competitor is peddling, you eventually have to talk to ASML Holding N.V. (ASML). They are the only ones on the planet capable of producing the Extreme Ultraviolet (EUV) lithography systems required to etch the most advanced circuits. In the jargon of the industry, they are a “monopoly,” though they prefer the term “sole provider of critical infrastructure.”
In a world where the US 10-Year Treasury yield sits at a demanding 5.10 percent, however, even a monopoly has to answer to the laws of financial gravity. The problem for ASML is not that people have stopped wanting chips. The problem is that the market has priced the company as if it were a risk-free compounding machine, while the underlying cash flows are starting to show the strain of a heavy capital expenditure cycle and some curious accounting accruals.
The Core Thesis and the 5.10 Percent Hurdle
When you own the only tollbooth on the highway to the future, you can charge a lot for the privilege of passing through. ASML does exactly that, boasting an operating margin of 44.36 percent and a revenue growth rate that recently clocked in at 55.20 percent. These are “Elite” numbers by any standard, placing the company firmly in the upper echelon of the Rule of 40 club with a staggering score of 81.5 percent.
But here is the catch: the market is currently asking you to pay a price that results in a Free Cash Flow (FCF) yield of just 1.91 percent. If you are an institutional manager, you are looking at a negative spread of roughly 3.19 percent compared to the risk-free return of a 10-Year Treasury. You are essentially paying ASML for the privilege of taking on equity risk, semiconductor cyclicality risk, and geopolitical risk, all while earning less than you would by sitting on your hands and holding government paper.
This valuation asymmetry is the primary “dislocation” we see today. Wall Street remains overwhelmingly “Overweight” on the stock, largely because ASML represents a 1.1 percent pillar of the S&P 500 and no one wants to be caught under-allocated if the AI trade catches another second wind. Yet, the fundamental reality is that the “Equity Risk Premium” here has vanished. Investors are betting that future growth will be so explosive that it will eventually justify this spread, but that assumes nothing goes wrong in the complex dance of global chip supply chains.
Multi-Year Financial Trajectory and the Accrual Red Flag
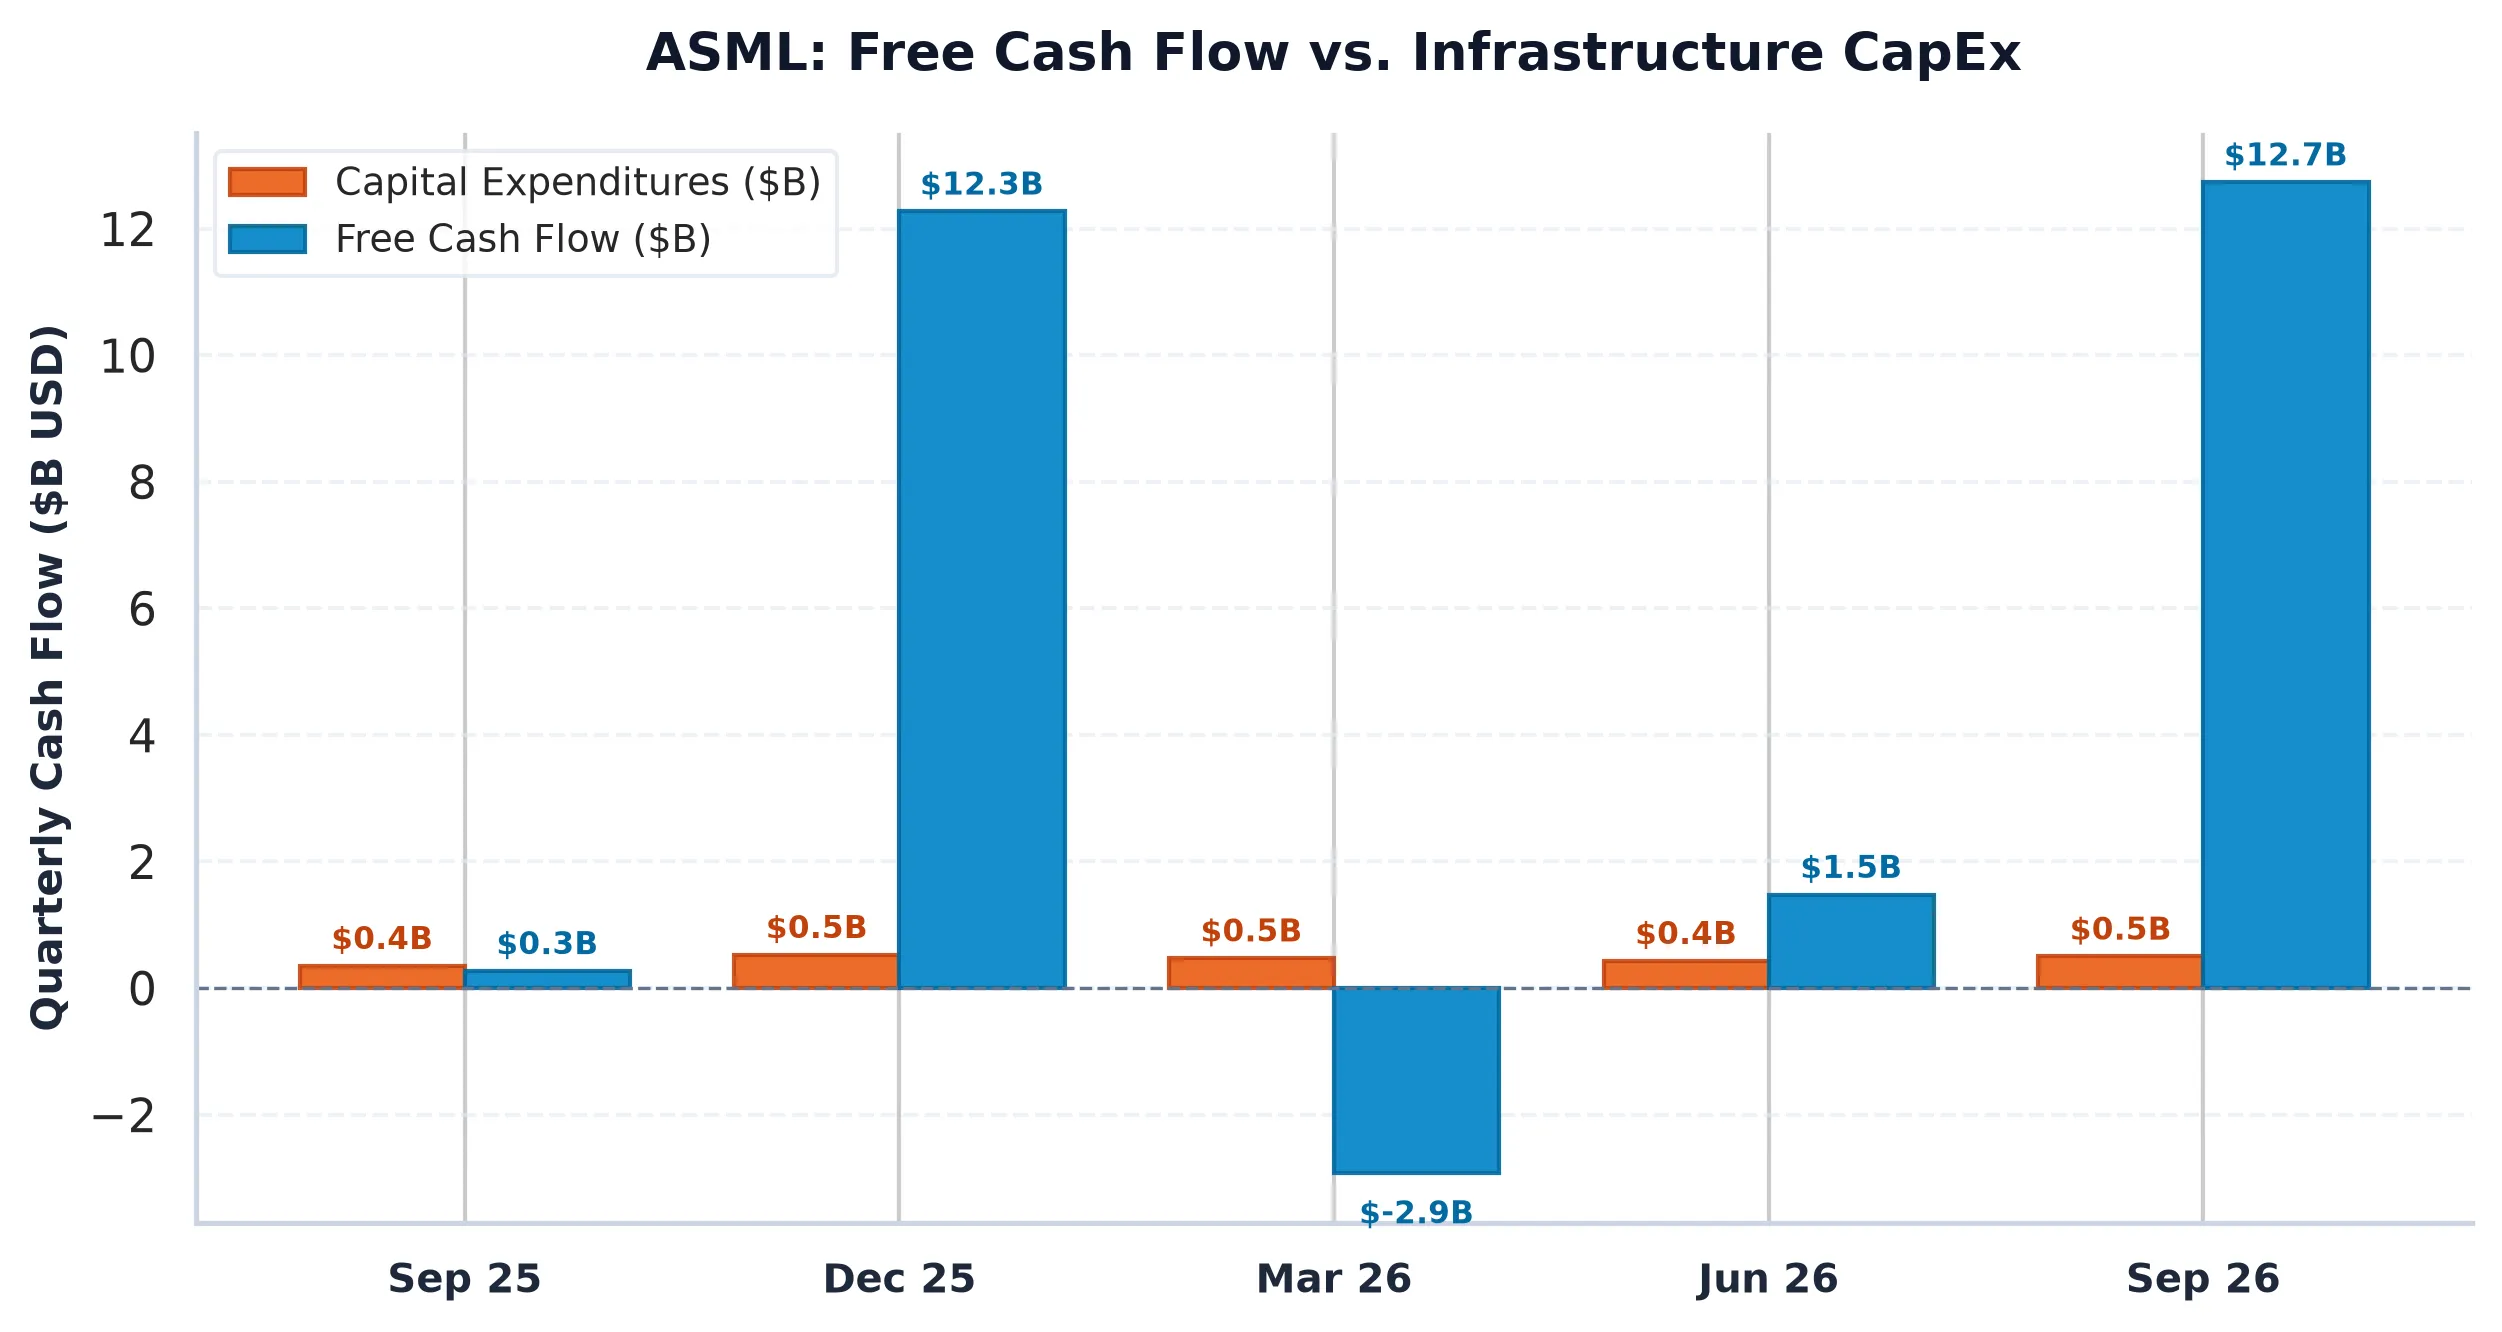
To understand where ASML is going, we have to look at where it has been. The historical trajectory over the last four years shows a company that is successfully scaling its “High-NA” EUV transition, but at a massive cost in terms of capital intensity.
| Period | Revenue | Operating Income | Operating Margin | Free Cash Flow | SBC Expense |
|---|---|---|---|---|---|
| FY2022 | $23.76B | $7.29B | 30.7% | $8.04B | $77.3M |
| FY2023 | $30.92B | $10.15B | 32.8% | $3.64B | $151.2M |
| FY2024 | $31.71B | $10.12B | 31.9% | $10.19B | $193.6M |
| FY2025 | $36.65B | $12.68B | 34.6% | $12.37B | $227.0M |
The revenue jump from $23.76 billion in 2022 to a projected $36.65 billion in 2025 is impressive. However, the Free Cash Flow has been volatile. In 2023, FCF dipped to $3.64 billion before rebounding. This volatility is a byproduct of ASML’s massive CapEx intensity, which currently sits at 31.29 percent of revenue. They are spending $13.86 billion a year just to keep the technological lead.
There is also a more subtle issue lurking in the balance sheet. Our forensic audit has flagged a “Moderate Watchlist” item: accruals represent 19.00 percent of total assets. In plain English, this means a significant portion of ASML’s reported earnings are based on accounting estimates and revenue recognition that has not yet been fully realized as cold, hard cash in the bank. When accruals exceed the 10 percent threshold, it often signals that “earnings persistence” might be lower than the headline numbers suggest. If the semiconductor cycle takes a breather, those accruals could become a liability rather than a promise of future cash.
Peer Relative Valuation and the Competitive Moat
ASML is often compared to other “WFE” (Wafer Fabrication Equipment) giants like Applied Materials and Lam Research. But as the table below illustrates, ASML trades in a valuation stratosphere of its own.
| Company (Ticker) | Market Cap | Forward P/E | EV/EBITDA | Rev Growth (YoY) | Operating Margin | FCF Yield |
|---|---|---|---|---|---|---|
| ASML Holding N.V. (ASML) | $609.6B | 25.0x | 2059.0x | 55.20% | 44.36% | 1.91% |
| Applied Materials (AMAT) | $310.7B | 21.1x | 30.3x | 24.8% | 33.7% | 0.99% |
| Lam Research (LRCX) | $298.8B | 19.5x | 29.2x | 54.4% | 40.0% | 1.52% |
| KLA (KLAC) | $209.2B | 22.6x | 31.5x | 28.9% | 45.0% | 1.35% |
ASML’s forward P/E of 25.0x is a premium to Lam Research (19.5x) and Applied Materials (21.1x). This premium is usually justified by the EUV monopoly. While Lam Research and Applied Materials compete with each other in deposition and etch, no one competes with ASML in lithography.
However, the “EV/EBITDA” metric for ASML is currently distorted by its complex capital structure and massive net cash position ($12.09 billion). When you look past the noise, the core question is whether you want to pay 25 times earnings for a company that is already the dominant player. To justify a higher multiple, ASML doesn’t just need to grow: it needs to grow faster than the already astronomical expectations baked into the AI infrastructure narrative.
Options Gamma Pinning, Risk Bounds, and Verdict
The options market currently reflects a state of “Institutional Stasis.” The Put/Call Open Interest ratio is 1.05, which is almost perfectly balanced. Dealers are neither heavily short nor long gamma, meaning they aren’t forced to chase the price in either direction.
The “Max Pain” strike is sitting at $1660.00, which is about 4.95 percent above the current spot price of $1581.65. This suggests that as we approach the next expiration cycle, there is a natural magnetic pull toward that $1660 level. However, there is a formidable “Call Wall” at $1900 that acts as a structural ceiling. On the downside, the “Put Wall” at $1500 provides a solid floor where dealer hedging would likely kick in to support the price.
The expected 30-day move is a wide +/- 14.50 percent. This tells us the market is bracing for volatility, even if the current dealer positioning is neutral. With the 10-Year Treasury yield providing a 5.10 percent alternative and the forensic accrual flag waving a yellow caution sign, the risk-reward profile here is balanced but unexciting for new capital.
ASML is a magnificent company, perhaps the most important industrial entity in the Western world. But a magnificent company is not always a magnificent investment at every price. Until the FCF yield moves closer to the sovereign hurdle or the accrual ratio normalizes, we prefer to watch from the sidelines.
AllWallSt Investment Verdict: HOLD
ASML Holding N.V. (ASML)
Trailing P/E
Marcus Wolfe Screen
Leverage Profile
30D Channel
MODERATE WATCHLIST (1 flag): Accruals represent 19.00% of total assets (exceeding 10% severe threshold), signaling low earnings persistence.
Fortress Balance Sheet (Net Cash Position; zero net refinancing distress).
Negative yield spread (-2.99% vs 5.10% Treasury); equity requires robust multiple expansion or growth.
Max Pain: $1660.00 (+4.95%) | P/C Ratio: 1.05 | 30D Channel: $1352.31 – $1810.99. Dealer gamma bounded between $1500 Put Wall and $1900 Call Wall.
ASML represents a core ~1.1% index pillar. Institutional managers face persistent benchmark drag if under-allocated during sector rallies, biasing sell-side consensus toward institutional overweight.
$1470.00 – $1530.00 (Options Support Pinning)
Sustained weekly close below $1500.00 (Put Wall) or gross margin compression below 54.34%.
Sources & References
- ASML Holding N.V. SEC EDGAR Filings
- ASML Investor Relations Portal
- SEC Form 20-F Annual Report (Filed Feb 2026)
- SEC Form 6-K Quarterly Disclosure (Filed Oct 2026)
Regulatory Disclaimer: This report is for informational purposes only and does not constitute investment advice, financial analysis, or a recommendation regarding any securities. AllWallSt and its analysts are not registered investment advisors. Technical and fundamental data are sourced from primary regulatory filings and exchange feeds but are not guaranteed for accuracy. Investing in equities and derivatives involves substantial risk of loss. Past performance is not indicative of future results. Always consult with a qualified financial professional before making investment decisions.