
The consensus view on Advanced Micro Devices, Inc. (AMD) is that it exists primarily to keep regulators from breaking up Nvidia, while occasionally collecting whatever spare enterprise compute budgets spill off Jensen Huang’s table. If you listen to mainstream financial television, AMD is locked in a perpetual game of catch-up where second place is merely an expensive form of failure. When exchange-traded funds trimmed exposure late last week, the prevailing chatter was that any company trading at an eye-watering trailing price-to-earnings ratio above 120 times must be walking into an earnings buzzsaw.
This consensus narrative has a neat, clean simplicity to it, which is usually the first sign that it is completely missing the underlying plumbing. The market treats AMD as an all-or-nothing call option on displacing the dominant GPU incumbent. In doing so, it overlooks what happens when a semiconductor business scales annual top-line revenue by 50.10%, compounds free cash flow, and quietly builds a net cash reserve approaching $9 billion.
Wall Street portfolio managers hold AMD in large part because of index benchmark gravity. Representing roughly 1.5% of the S&P 500, under-allocating to AMD during a momentum squeeze introduces acute career risk. Yet behind that forced institutional buying lies genuine operational momentum. AMD is not surviving on breadcrumbs; it is running a textbook enterprise hardware playbook, converting hyperscaler anxiety into commercial leverage. When both AMD and Nvidia recently anchored a $6 billion funding vehicle for an emerging artificial intelligence venture, it signaled that hyperscalers and venture ecosystems are desperate for a viable counterweight in the compute market. Being the undisputed alternative in a supply-starved, multi-hundred-billion-dollar secular market is not a consolation prize. It is an extraordinary business.
Multi-Year Financial Trajectory, ROIC & Cash-Flow Mechanics
To understand why the trailing multiple looks astronomical while the business is actually cheapening on a forward basis, you have to look at the progression of AMD’s operating income since 2022. During the post-pandemic semiconductor hangover, operating income compressed to a meager $401 million in FY2023, dragging GAAP operating margins down to 1.8%. That historical trough continues to distort trailing valuation metrics.
| Period | Revenue | Operating Income | Operating Margin | Free Cash Flow | SBC Expense |
|---|---|---|---|---|---|
| FY2022 | $23.60B | $1.26B | 5.4% | $3.12B | $1.08B |
| FY2023 | $22.68B | $401.0M | 1.8% | $1.12B | $1.38B |
| FY2024 | $25.79B | $2.09B | 8.1% | $2.40B | $1.41B |
| FY2025 | $34.64B | $3.69B | 10.7% | $6.74B | $1.64B |
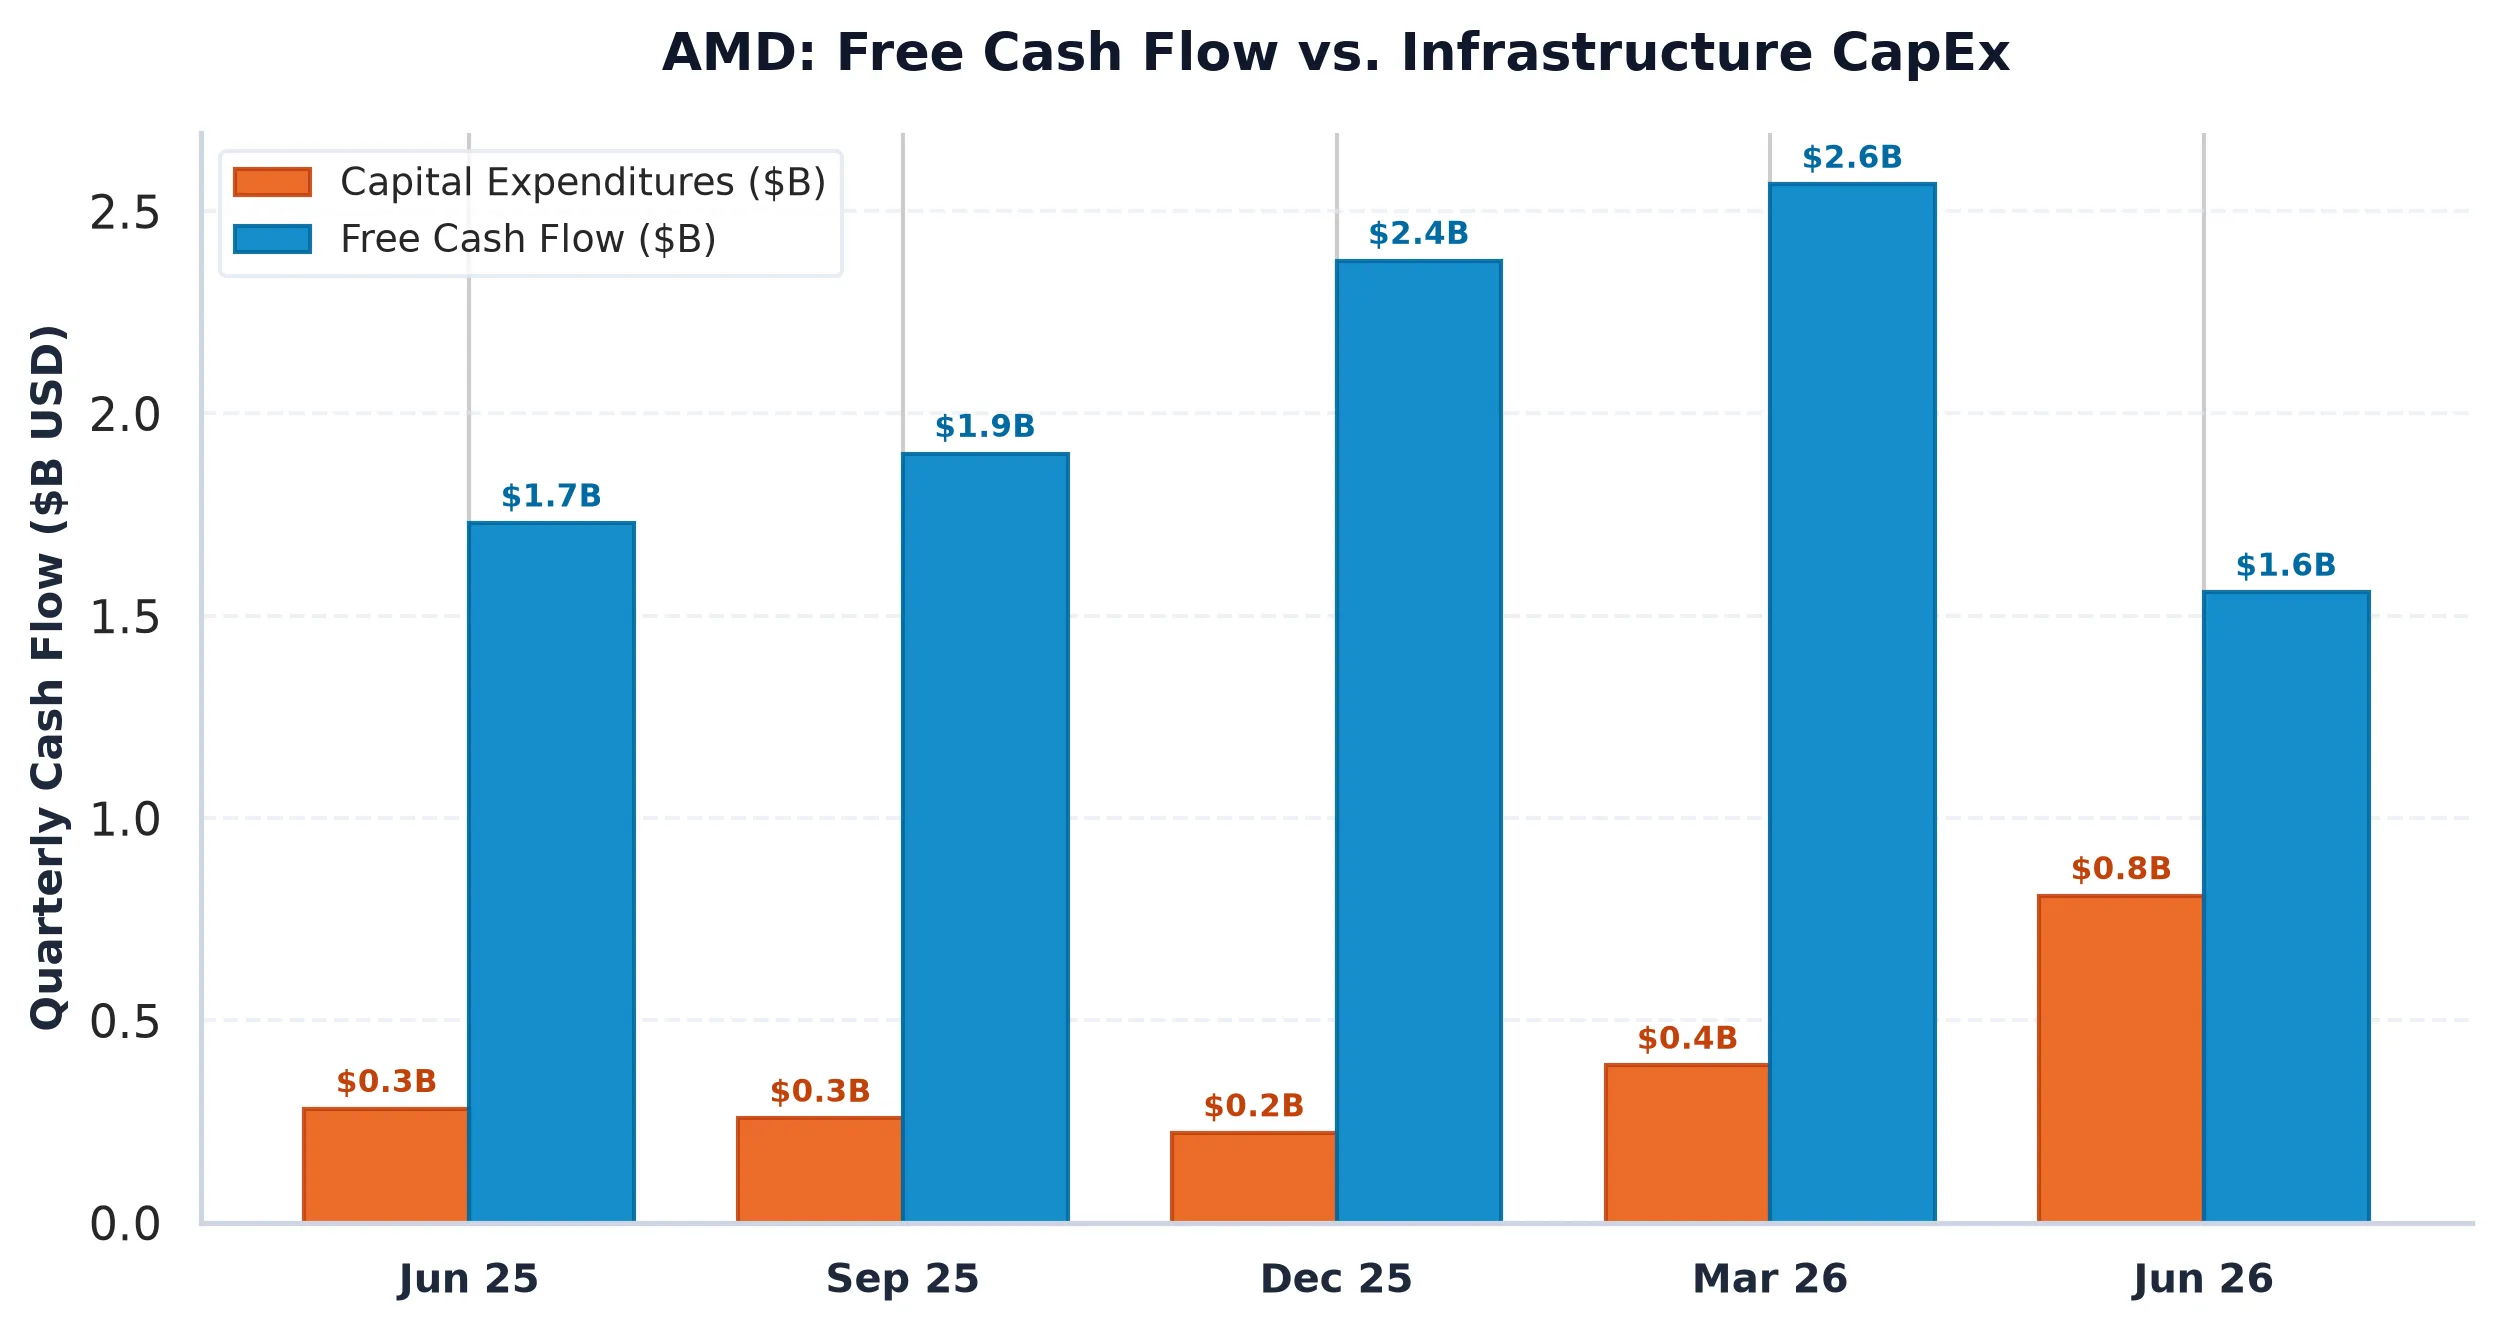
Over the trailing twelve months, revenue reached $41.31 billion, while operating margins expanded to 17.25%. Generating $8.84 billion in reported free cash flow puts AMD in rare operational air. Even when you apply forensic discipline by subtracting the $1.64 billion in annual stock-based compensation, real economic free cash flow stands at a robust $7.20 billion.
On capital allocation, AMD avoids the trap of debt-funded financial engineering. Its balance sheet holds $13.11 billion in cash and short-term liquid investments against $4.28 billion in total debt, leaving a pristine net cash position of $8.84 billion. Net debt to EBITDA sits at -0.92x. While a static free cash flow yield of 1.11% looks lean against a 10-Year Treasury yield hovering near 4.90%, static metrics fail to capture hyper-growth reinvestment. AMD boasts an elite Rule of 40 score of 71.5%, powered by 50.10% top-line expansion and a 21.4% cash flow margin.
Return on invested capital has climbed to 9.64%, comfortably clearing its weighted average cost of capital hurdle of 8.5%. Unlike capital-heavy integrated foundries, AMD’s fabless model restricts capital expenditures to just 3.00% of revenue ($1.24 billion). This allows incremental operating leverage to drop directly to the bottom line as the data-center compute ramp accelerates.
Peer Relative Valuation & Competitive Moat
The conventional bear thesis assumes AMD’s high forward earnings multiple makes it vulnerable relative to enterprise peers. A line-by-line examination of the semiconductor landscape reveals a different reality:
| Company (Ticker) | Market Cap | Forward P/E | EV/EBITDA | Rev Growth (YoY) | Operating Margin | FCF Yield |
|---|---|---|---|---|---|---|
| Advanced Micro Devices (AMD) | $799.7B | 30.6x | 85.3x | 50.10% | 17.25% | 1.11% |
| NVIDIA (NVDA) | $5.00T | 13.0x | 24.4x | 105.9% | 66.2% | 0.84% |
| Intel (INTC) | $334.8B | 34.9x | 18.9x | 20.9% | 15.6% | 0.24% |
| Broadcom (AVGO) | $1.58T | 17.0x | 30.5x | 85.5% | 54.3% | 1.94% |
Intel trades at 34.9 times forward earnings with lower revenue growth (20.9%) and an inferior operating margin (15.6%), burdened by massive foundry subsidies and capital equipment obligations. Broadcom generates phenomenal 54.3% operating margins and a 1.94% free cash flow yield, but trades heavily on its custom silicon ASIC pipeline and software acquisitions.
Nvidia remains the benchmark juggernaut, yet AMD does not need to unseat Nvidia to generate extraordinary returns for shareholders. AMD trades at 30.6 times forward earnings with a price-to-earnings-to-growth (PEG) ratio of just 0.5. In modern technology equities, a PEG ratio below 1.0 indicates that forward earnings revisions are outpacing multiple expansion. Hyperscalers such as Microsoft, Meta, and Alphabet are actively engineering software abstraction layers, such as ROCm and open-source Triton kernels, specifically to prevent vendor lock-in. AMD is the immediate beneficiary of this structural enterprise desire for supply-chain redundancy.
Options Gamma Pinning, Risk Bounds & Verdict
As AMD approaches its imminent earnings report, options market structure reveals balanced dealer inventory rather than runaway speculation. The put-to-call open interest ratio stands at 1.01 across the front weekly expirations, reflecting an even distribution of defensive puts and speculative calls.
Implied volatility sits at an elevated 101.99%, reflecting the classic pre-earnings volatility pump. This prices in a 30-day expected move of plus or minus $143.26, or approximately 29.24% in either direction. However, the underlying plumbing tells a stabilizing story. Primary put support rests heavily at the $480, $450, and $320 strikes, while upside call resistance stacks up at $540, $550, and $600.
Crucially, the options Max Pain strike is positioned at $527.50, representing a 7.66% upward pull from the current spot price of $490.00. With dealers holding balanced net gamma, downside momentum is mechanically cushioned by dealer hedging at the $480 and $450 put walls. Meanwhile, any upside earnings surprise that breaches the $527.50 Max Pain strike will force market makers to rapidly buy underlying stock to hedge short upside calls.
The market consensus sees AMD as an expensive runner-up caught in an impossible fight against a trillion-dollar monopolist. The quantitative reality reveals a company with a pristine balance sheet, zero net debt, accelerating operating margins, and a PEG ratio of 0.5. Far from being a structural trap, AMD represents one of the cleanest growth compounders in enterprise hardware.
Advanced Micro Devices, Inc. (AMD)
Trailing P/E
Marcus Wolfe Screen
Leverage Profile
30D Channel
Pristine cash flow conversion (1.78x) and healthy accrual ratio (-4.39%). Zero accounting anomalies detected (LOW ANOMALY RISK).
Fortress Balance Sheet (Net Cash Position; zero net refinancing distress).
Negative yield spread (-3.78% vs 5.10% Treasury); equity requires robust multiple expansion or growth.
Max Pain: $527.50 (+7.66%) | P/C Ratio: 1.01 | 30D Channel: $346.75 – $633.26. Dealer gamma bounded between $320 Put Wall and $600 Call Wall.
AMD represents a core ~1.5% index pillar. Institutional managers face persistent benchmark drag if under-allocated during sector rallies, biasing sell-side consensus toward institutional overweight.
$313.60 – $326.40 (Options Support Pinning)
Sustained weekly close below $320.00 (Put Wall) or gross margin compression below 55.72%.
Sources & References
- SEC EDGAR Official Filings: Advanced Micro Devices, Inc. (CIK 0000002488)
- Latest Annual Report: AMD Form 10-K
- Latest Quarterly Report: AMD Form 10-Q
- Material Definitive Agreements & Capital Disclosures: AMD Form 8-K
- Corporate Portal: Advanced Micro Devices Investor Relations
Regulatory Disclaimer: This publication is provided for institutional informational and educational purposes only and does not constitute an offer, solicitation, or recommendation to purchase or sell any security or financial instrument. All investments involve substantial risk of capital loss. Past performance is not indicative of future returns. Analysts may maintain active positions in the securities, derivatives, or companies discussed herein.