
When an offshore cryptocurrency exchange experiences a $4.6 billion customer withdrawal stampede following a major security breach, the traditional market playbook suggests a straightforward outcome: capital flees non-compliant offshore venues and lands squarely with the premier US-regulated custodian. Coinbase Global, Inc. (COIN) is the obvious institutional beneficiary of this structural flight to safety. Yet, as sell-side analysts recently noted in trimming 12-month price targets down toward $196.50, turning offshore market share turbulence into sustainable equity compounding requires more than a temporary influx of panicked deposits.
Coinbase presents a complex balance sheet profile. On paper, liquidity appears exceptionally strong: the company maintains $8.82 billion in total cash against $6.89 billion in debt, yielding a net cash balance of $1.94 billion. The reported unadjusted Free Cash Flow yield sits at an eye-catching 10.09%. However, primary disclosures in recent SEC Form 10-Q filings reveal that Stock-Based Compensation (SBC) reached $0.84 billion over the trailing period, absorbing 59.6% of operating cash flow. Subtracting executive stock grants reduces the true economic FCF yield to 7.79%. While that still offers a positive spread over the 5.10% US 10-Year Treasury benchmark, top-line revenue contracted 34.20% year-over-year to $5.44 billion, pulling operating margins down to -1.42%.
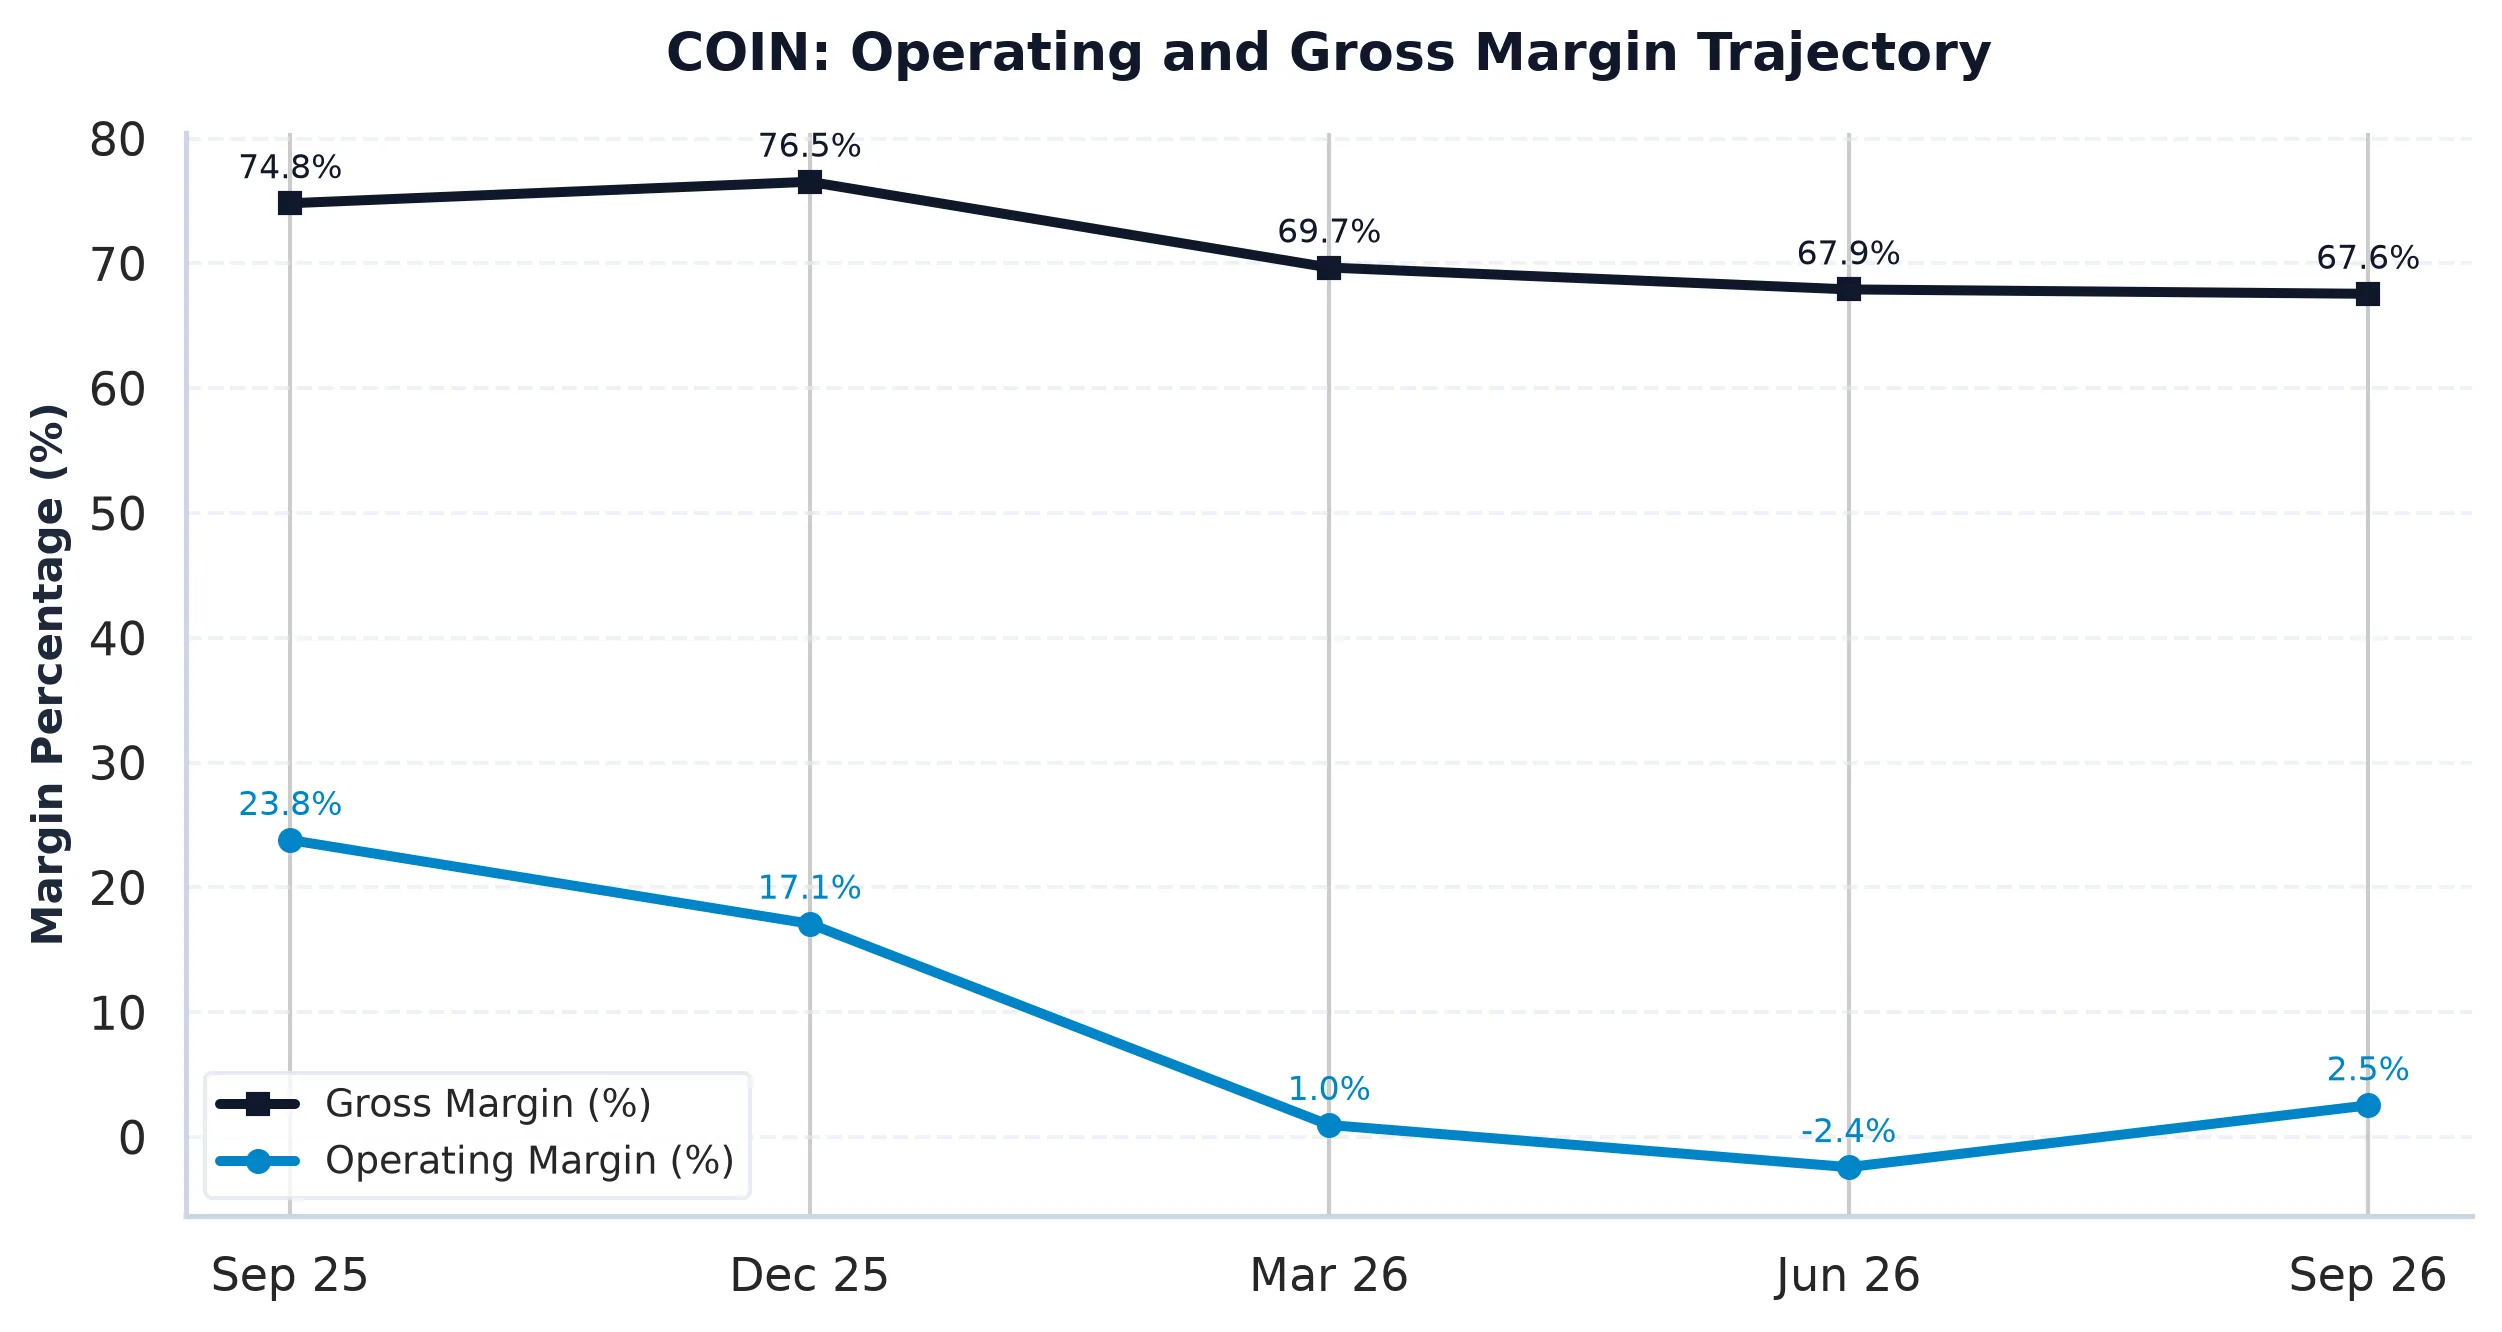
To understand why equity consensus remains cautious despite offshore market disruption, one must evaluate Coinbase alongside traditional exchange operators. Coinbase trades at a demanding forward P/E multiple of 55.8x and an EV/EBITDA of 132.8x. Contrast this with Robinhood Markets (HOOD), which trades at 24.8x forward earnings while generating 11.8% revenue growth and an operating margin of 48.1%. Institutional exchange benchmarks like CME Group (CME) and Intercontinental Exchange (ICE) command forward P/E multiples of 23.1x and 19.3x, respectively, while delivering operating margins well above 50%. CME Group yields 2.78% in free cash flow with minimal stock dilution, underscoring the valuation premium currently built into Coinbase’s stock price of $137.83.
From a quantitative market structure perspective, option dealer positioning reflects balanced inventory rather than speculative excess. The Put/Call Open Interest ratio stands at 0.78, with total call open interest leading puts 145,854 to 114,487 contracts. Option market makers face a Max Pain strike of $147.00, roughly 6.65% above current spot prices, providing a mild upward magnet into near-term expirations. However, heavy Call Resistance sits at $142 and $148, while primary Put Support rests at $130 and $110. With 30-day ATM implied volatility elevated at 78.93%, option market makers are pricing in a 30-day expected move of +/- $31.19 (or +/- 22.63%).
The long-term case for Coinbase Global rests on its role as an institutional gatekeeper. However, with return on invested capital at -0.62% against an estimated 8.5% hurdle rate, investors are paying 55.8x forward earnings for cyclical transaction volumes. Until revenue growth re-accelerates and operating margins recover toward their FY2024 peak of 34.1%, capital allocation discipline warrants a patient approach.
Coinbase Global, Inc. (COIN)
Trailing P/E
Marcus Wolfe Screen
Leverage Profile
30D Channel
MODERATE WATCHLIST (1 flag): Receivables growth outstripped revenue growth by >15%, pointing to potential revenue recognition or collection friction.
Fortress Balance Sheet (Net Cash Position; zero net refinancing distress).
Favorable equity risk premium (+5.20% FCF yield spread over 5.10% US 10-Yr Treasury benchmark).
Max Pain: $147.00 (+6.65%) | P/C Ratio: 0.78 | 30D Channel: $106.64 – $169.02. Dealer gamma bounded between $90 Put Wall and $170 Call Wall.
COIN operates with negligible index gravitational pull. Sell-side ratings reflect pure idiosyncratic fundamental consensus without passive indexing distortion.
$88.20 – $91.80 (Options Support Pinning)
Sustained weekly close below $90.00 (Put Wall) or gross margin compression below 85.32%.
Sources & References
- Official SEC Form 10-K Annual Report (Filed 2026-02-12)
- Primary Corporate Filings: SEC EDGAR Browse Database (CIK: 0001679788)
- Corporate Investor Relations: Coinbase Global, Inc. Investor Relations Portal
- Official Disclosure Documents: Form 10-Q Quarterly Report (Filed October 29, 2026)
Regulatory Disclaimer: All analytical commentary and quantitative data points presented herein are compiled solely for institutional research and educational evaluation. Nothing contained in this dispatch constitutes personalized investment, legal, or financial advice. Past fundamental performance and options market positioning offer no guarantee of future equity returns.