
⚡ Executive Morning Takeaways
- Overnight Futures & Rates Impulse: E-Mini S&P 500 futures are down 0.14 percent while Nasdaq 100 futures edge up 0.29 percent, reflecting a bifurcated open as the 10-Year Treasury yield holds steady at 4.89 percent.
- Sector Rotation Leaders & Laggards: Consumer Discretionary (XLY) and Financials (XLF) are leading the morning charge, while Energy (XLE) and Technology (XLK) face selling pressure amid shifting growth expectations.
- Primary Corporate Catalyst: Pfizer Inc. (PFE) reports Q3 earnings this morning with a focus on its oncology pivot via the Seagen integration and progress on its oral obesity pipeline, sitting on a massive 4.88 Put/Call ratio.
🌐 Pre-Market Macro, Futures & Rates Dashboard
| Asset / Benchmark | Ticker | Current Price / Level | Change (%) | 52-Week Low | 52-Week High |
|---|---|---|---|---|---|
| E-Mini S&P 500 Futures (ES=F) | ES=F | $7564.00 | -0.14% | $6353.25 | $7897.50 |
| E-Mini Nasdaq 100 Futures (NQ=F) | NQ=F | $28209.75 | +0.29% | $22961.50 | $31616.50 |
| S&P 500 (SPY) | SPY | $752.10 | -0.48% | $629.28 | $781.62 |
| Nasdaq 100 (QQQ) | QQQ | $681.09 | -1.36% | $555.60 | $762.86 |
| Russell 2000 (IWM) | IWM | $279.14 | -0.07% | $228.90 | $305.18 |
| 20+ Year Treasury (TLT) | TLT | $81.73 | +0.29% | $76.43 | $90.86 |
| High Yield Corporate (HYG) | HYG | $76.89 | -0.18% | $76.39 | $81.24 |
| Gold (GLD) | GLD | $361.65 | +1.65% | $354.67 | $509.70 |
| WTI Crude Oil (CL=F) | CL=F | $98.41/bbl | +2.02% | $54.98 | $119.48 |
| US Dollar Index Bullish (UUP) | UUP | $28.96 | -0.14% | $26.40 | $29.25 |
| CBOE Volatility Index (^VIX) | ^VIX | 21.28 | +0.61% | 13.38 | 35.30 |
| 2-Yr US Treasury Yield (2YY=F) | 2YY=F | 4.75% | +0.00% | 3.38% | 4.88% |
| 10-Yr US Treasury Yield (^TNX) | ^TNX | 4.89% | -0.71% | 3.96% | 5.36% |
The macro environment remains a tug-of-war between resilient equity indices and a sovereign bond market that refuses to offer a reprieve on the cost of capital. With the 10-Year Treasury yield at 4.89 percent, the equity risk premium is essentially invisible for high-multiple growth stocks. This explains the morning rotation out of Technology (XLK) and into more tangible, cash-generating sectors.
Gold and WTI Crude are both showing strength, suggesting that while the Fed may be nearing a plateau, inflationary tail-risks are not entirely extinguished. For a company like Pfizer, which operates with significant debt following its Seagen acquisition, the stabilization of the 10-Year yield is a critical prerequisite for equity rerating.
📊 Sector Rotation Leaders & Laggards
| Rotation Rank | Sector ETF | Ticker | Price | Change (%) | Trailing P/E | Dividend Yield | 52-Week Low | 52-Week High |
|---|---|---|---|---|---|---|---|---|
| Leader (#1) | Consumer Discretionary (XLY) | XLY | $118.16 | +2.41% | 26.1x | 0.86% | $105.19 | $125.01 |
| Leader (#2) | Financials (XLF) | XLF | $57.56 | +1.86% | 16.4x | 1.55% | $47.67 | $58.60 |
| Leader (#3) | Materials (XLB) | XLB | $53.67 | +1.76% | 25.0x | 1.77% | $42.03 | $54.19 |
| Laggard (#8) | Healthcare (XLV) | XLV | $184.60 | -0.15% | 32.9x | 1.52% | $141.97 | $187.99 |
| Laggard (#9) | Technology (XLK) | XLK | $174.22 | -2.95% | 28.5x | 0.43% | $126.68 | $203.25 |
| Laggard (#10) | Energy (XLE) | XLE | $67.25 | -3.96% | 19.2x | 2.48% | $43.19 | $70.15 |
Institutional capital is currently fleeing the high-beta volatility of Energy and Technology in favor of “old economy” sectors like Materials and Financials. The Healthcare sector (XLV) is lagging slightly, largely due to the uncertainty surrounding major earnings releases from giants like Pfizer. However, with a sector Trailing P/E of 32.9x, the dispersion between high-multiple biotech and low-multiple value pharma like Pfizer is becoming an institutional talking point.
📅 Today’s Earnings & Economic Radar
Imminent Corporate Earnings Releases
| Company / Ticker | Timing | Consensus EPS | Consensus Revenue | Key Strategic Theme |
|---|---|---|---|---|
| Advanced Micro Devices (AMD) | Today (AMC) | $1.94 | $13.09B | MI300/MI400 Data-Center GPU Ramp vs Client PC Mix |
| Pfizer Inc. (PFE) | Today (BMO) | $0.73 | $15.88B | Oncology Seagen Integration & Post-COVID Cost Realignment |
| Amgen (AMGN) | Today (AMC) | $5.78 | $10.06B | MariTide Obesity Pipeline Readouts & Horizon Rare Disease Mix |
| Qualcomm (QCOM) | Tomorrow (Pre) | $2.16 | $10.15B | Handset Licensing Royalties & Automotive Snapdragon Pipeline |
| McDonald’s (MCD) | Tomorrow (Pre) | $3.38 | $7.28B | Value-Menu Traffic Elasticity vs Franchisee Cash Flow |
High-Impact Economic Data & Central Bank Actions
| Time (ET) | Event | Impact | Key Institutional Focus |
|---|---|---|---|
| 10:00 AM | JOLTS Job Openings | CRITICAL | Labor Demand Ratio vs Wage Stickiness |
| 10:00 AM | US Factory Orders | HIGH | Core Capital Goods Shipments |
| 04:30 PM | API Crude Inventory | MEDIUM | Cushing Storage & Refinery Utilization |
The 10:00 AM JOLTS print is the primary hurdle for the morning session. Any sign of labor market cooling would likely bolster the case for a more accommodative Fed, potentially easing the pressure on the 10-Year yield and providing a tailwind for yield-sensitive equities.
🎯 Pre-Market Spotlight: Pfizer Inc. (PFE)
Pfizer Inc. (PFE) enters its Q3 earnings release in a state of existential transition. For the better part of two years, the market has treated the company as a depreciating asset, a victim of its own success during the COVID era. However, the fundamental reality is beginning to diverge from the narrative of decline. Pfizer currently offers a Free Cash Flow yield of 7.14 percent, which provides a healthy 2.25 percent spread over the 10-Year Treasury yield. In an era where many “growth” companies provide a negative equity risk premium, Pfizer’s cash flow profile is increasingly difficult for institutional value desks to ignore.
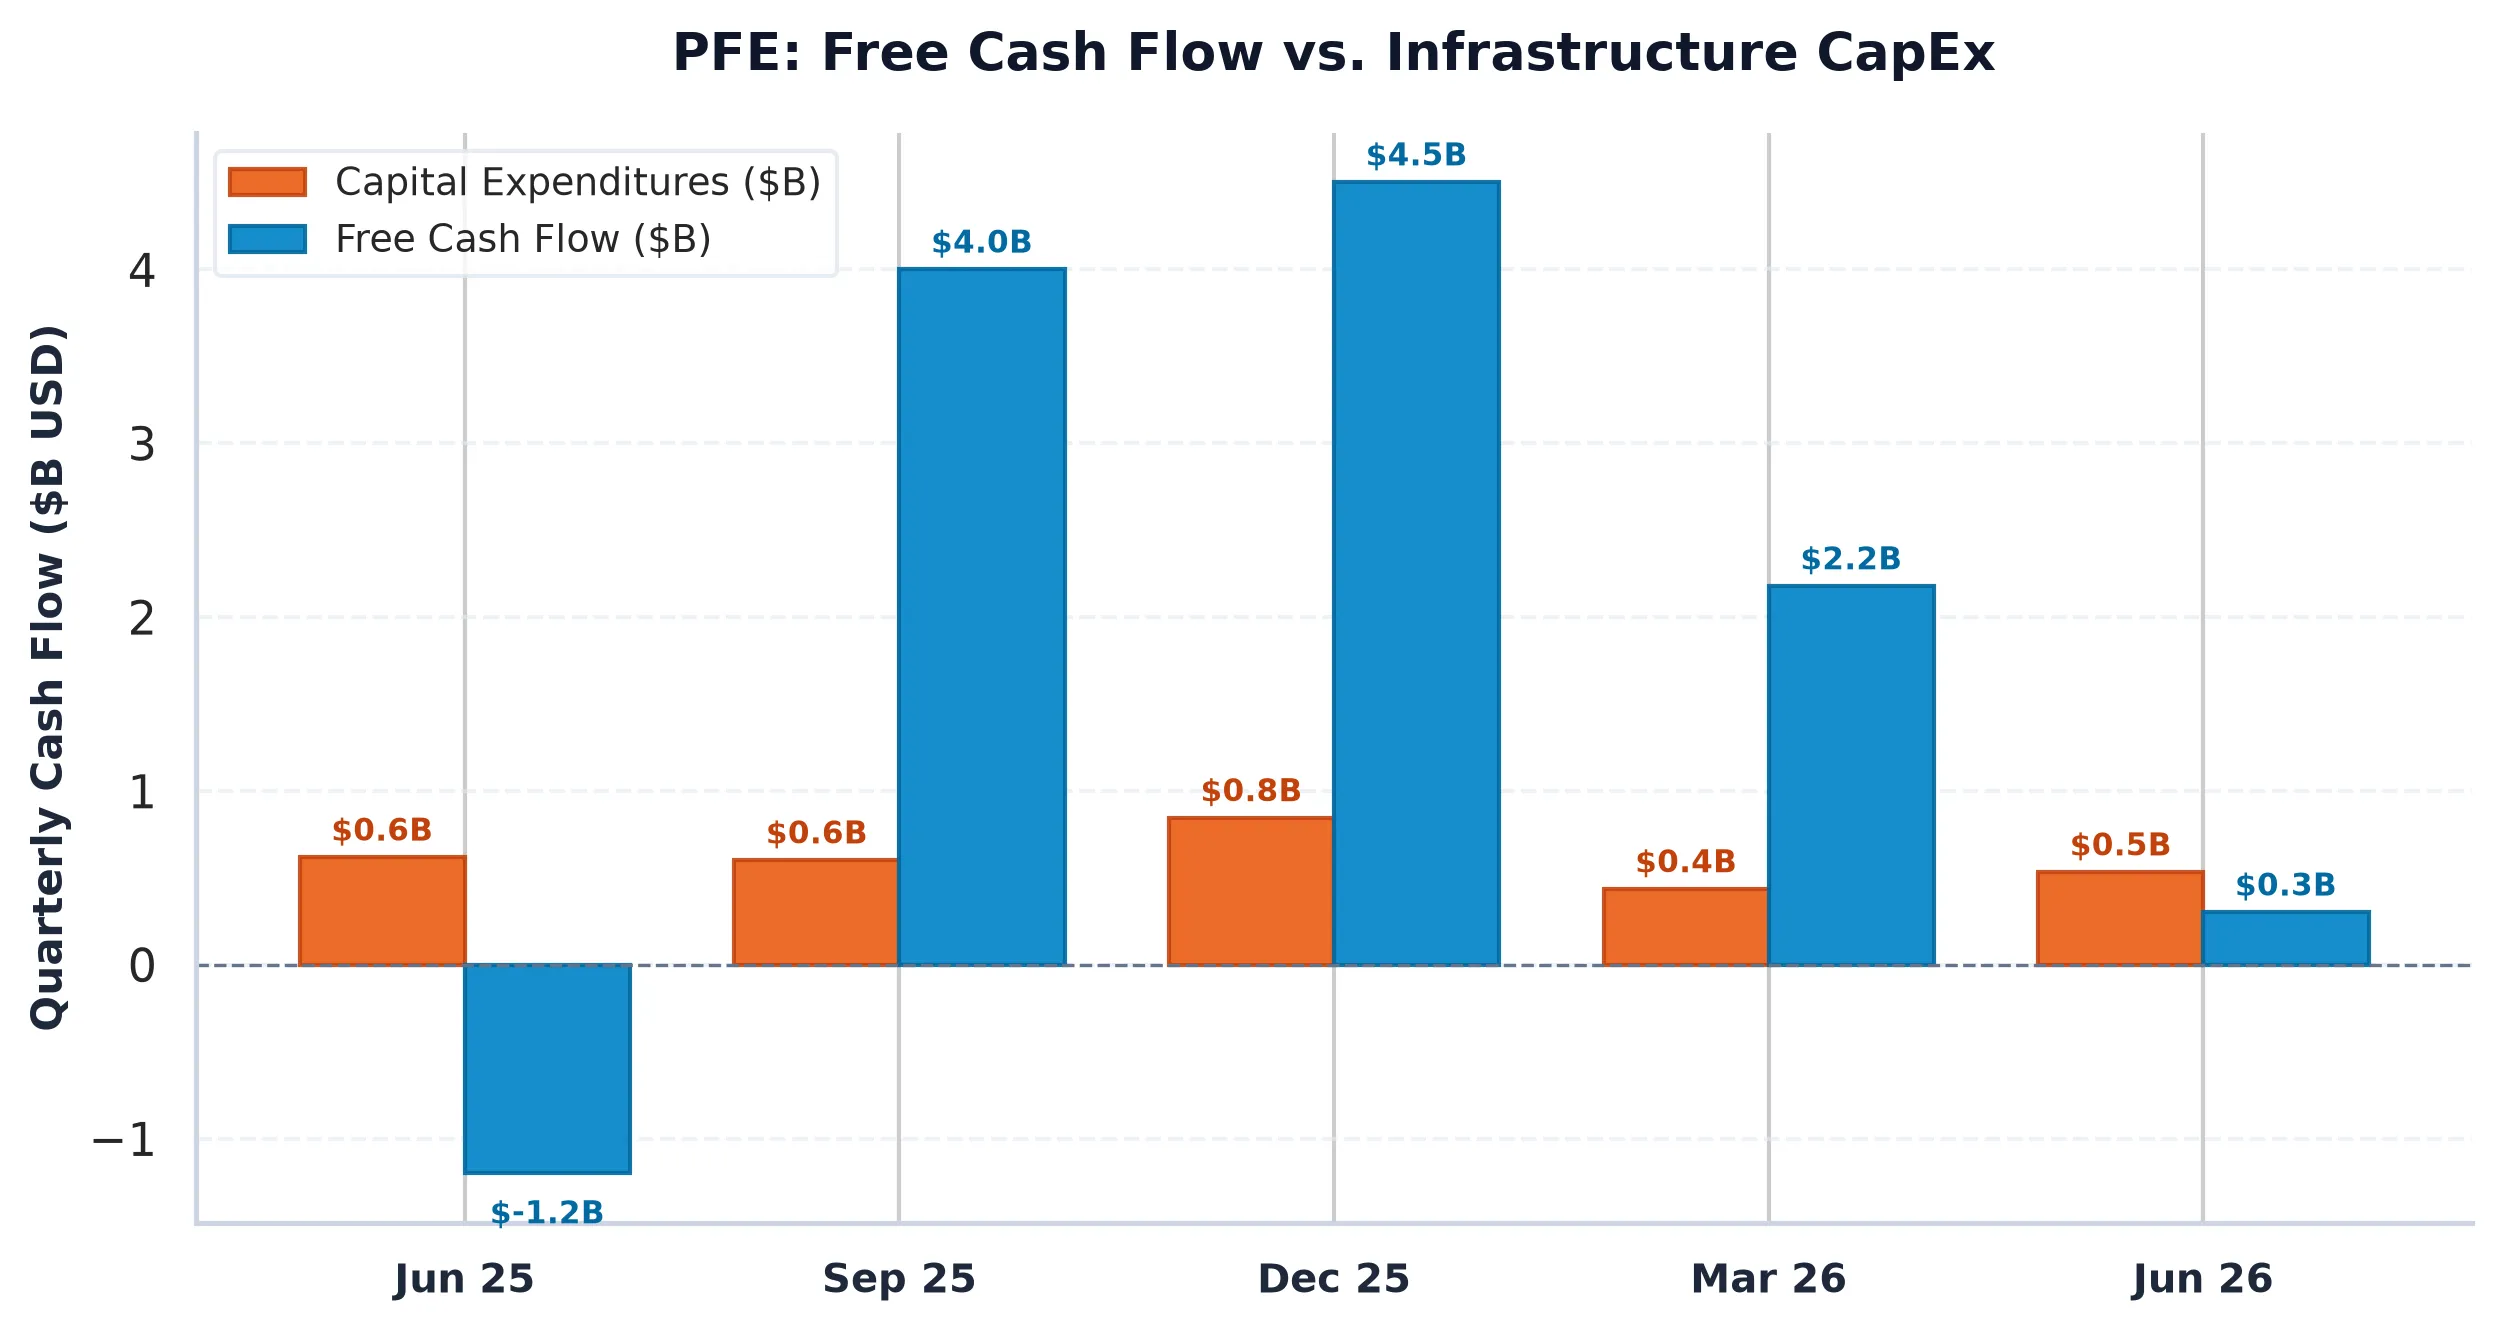
The company is trading at a forward P/E of just 10.6x, a significant discount to peers like Merck (16.4x) and Gilead (16.9x). While Pfizer’s revenue growth of 2.60 percent is modest, its operating margin of 27.88 percent and a Return on Invested Capital (ROIC) of 10.24 percent suggest that the underlying business remains highly efficient despite the Seagen acquisition debt. The integration of Seagen is the pivot point: management is betting $43 billion that they can replace fading vaccine revenues with a world-class oncology franchise. If today’s results show even a glimmer of margin expansion in the cancer portfolio, the “value trap” thesis starts to crumble.
The options market, however, is braced for impact. The Put/Call open interest ratio is a staggering 4.88, indicating a deep defensive skew from institutional players. This level of bearish positioning often sets the stage for a violent “short-covering” rally if the news is anything better than catastrophic. With the stock pinned near $30.67 and a 30-day expected move of only $1.10, the market is pricing in a dull affair, yet the massive put wall at $30.50 suggests that dealers will be forced to buy back delta hedges if the price breaks to the upside.
While Wall Street consensus remains anchored at a “Market Weight” gravity, AllWallSt sees a company returning over 5 percent to shareholders via dividends with a clear path to debt deleveraging. Pfizer is essentially a high-yield bond with an embedded call option on an oncology and obesity pipeline. At these multiples, you are being paid to wait for the market to realize that the COVID hangover is finally over.
AllWallSt Investment Verdict: BUY
Pfizer Inc. (PFE)
Trailing P/E
Marcus Wolfe Screen
Leverage Profile
30D Channel
Pristine cash flow conversion (1.51x) and healthy accrual ratio (-1.89%). Zero accounting anomalies detected (LOW ANOMALY RISK).
Moderate Leverage (2.04x Net Debt/EBITDA); manageable through operating cash generation.
Favorable equity risk premium (+2.25% FCF yield spread over 5.10% US 10-Yr Treasury benchmark).
Max Pain: $20.00 (-34.79%) | P/C Ratio: 4.88 | 30D Channel: $29.57 – $31.77. Dealer gamma bounded between $30.5 Put Wall and $37 Call Wall.
PFE carries standard index weighting (< 0.6% SPY footprint); sell-side consensus reflects standard earnings momentum rather than index-tracking mandates.
$29.89 – $31.11 (Options Support Pinning)
Sustained weekly close below $30.50 (Put Wall) or gross margin compression below 74.72%.
Sources & References
Regulatory Disclaimer: This report is for informational purposes only and does not constitute financial, legal, or investment advice. All investments involve risk, including the possible loss of principal. The analysis provided is based on primary source data and market conditions at the time of writing. AllWallSt and its analysts are not responsible for any financial losses resulting from the use of this information. Past performance is not indicative of future results. Consult with a qualified financial advisor before making any investment decisions.