
The thing about modern biotechnology is that it has essentially become a high stakes game of competitive weight loss. If you are a legacy pharmaceutical giant and you do not have a GLP-1 receptor agonist in your pocket, or at least a very expensive PowerPoint presentation explaining why you will have one soon, the market tends to treat you like a utility company with worse margins. Amgen Inc. (AMGN) is currently the primary beneficiary of this narrative. The consensus view, echoed across the usual financial news terminals today, is that Amgen is the sleeper hit of the obesity race. The company has its MariTide asset, it has a trove of Icelandic DNA from its deCODE Genetics subsidiary, and it has a quarterly earnings report due this afternoon that everyone expects to be a referendum on whether it can actually challenge the Eli Lilly and Novo Nordisk duopoly.
The problem with being a sleeper hit is that once everyone starts talking about you, you are no longer a sleeper. You are just a stock with a 19x forward earnings multiple and a free cash flow yield that is significantly lower than what the United States Treasury will pay you to sit on your hands. When the 10-Year Treasury yield sits at 4.95 percent, a 3.45 percent free cash flow yield represents a negative equity risk premium. You are essentially paying Amgen for the privilege of taking clinical trial risk, which is a fascinating way to allocate capital in a world where cash is no longer free.
The DNA Trove and the Margin Squeeze
Amgen is not a startup. It is a $250 billion enterprise that has spent decades perfecting the art of biologics manufacturing. Its recent narrative pivot toward the obesity market is backed by its 2012 acquisition of deCODE Genetics, which provides a massive database of Icelandic genomic data. The theory is simple: if you own the data on why people get sick, you can build better drugs to stop them from being sick. This is a great long term strategy. In the short term, however, building a massive obesity pipeline while integrating the $27.8 billion acquisition of Horizon Therapeutics is an expensive endeavor.
If we look at the historical fundamental trajectory, the strain is visible on the income statement. In 2022, Amgen operated with a healthy 36.3 percent operating margin. By 2024, that margin had compressed to 21.7 percent. While it recovered slightly to 24.7 percent in 2025, the trend suggests that growth is becoming more expensive to buy and build.
| Period | Revenue | Operating Income | Operating Margin | Free Cash Flow | SBC Expense |
|---|---|---|---|---|---|
| FY2022 | $26.32B | $9.57B | 36.3% | $8.79B | $401.0M |
| FY2023 | $28.19B | $7.90B | 28.0% | $7.36B | $431.0M |
| FY2024 | $33.42B | $7.26B | 21.7% | $10.39B | $530.0M |
| FY2025 | $36.75B | $9.08B | 24.7% | $8.10B | $494.0M |
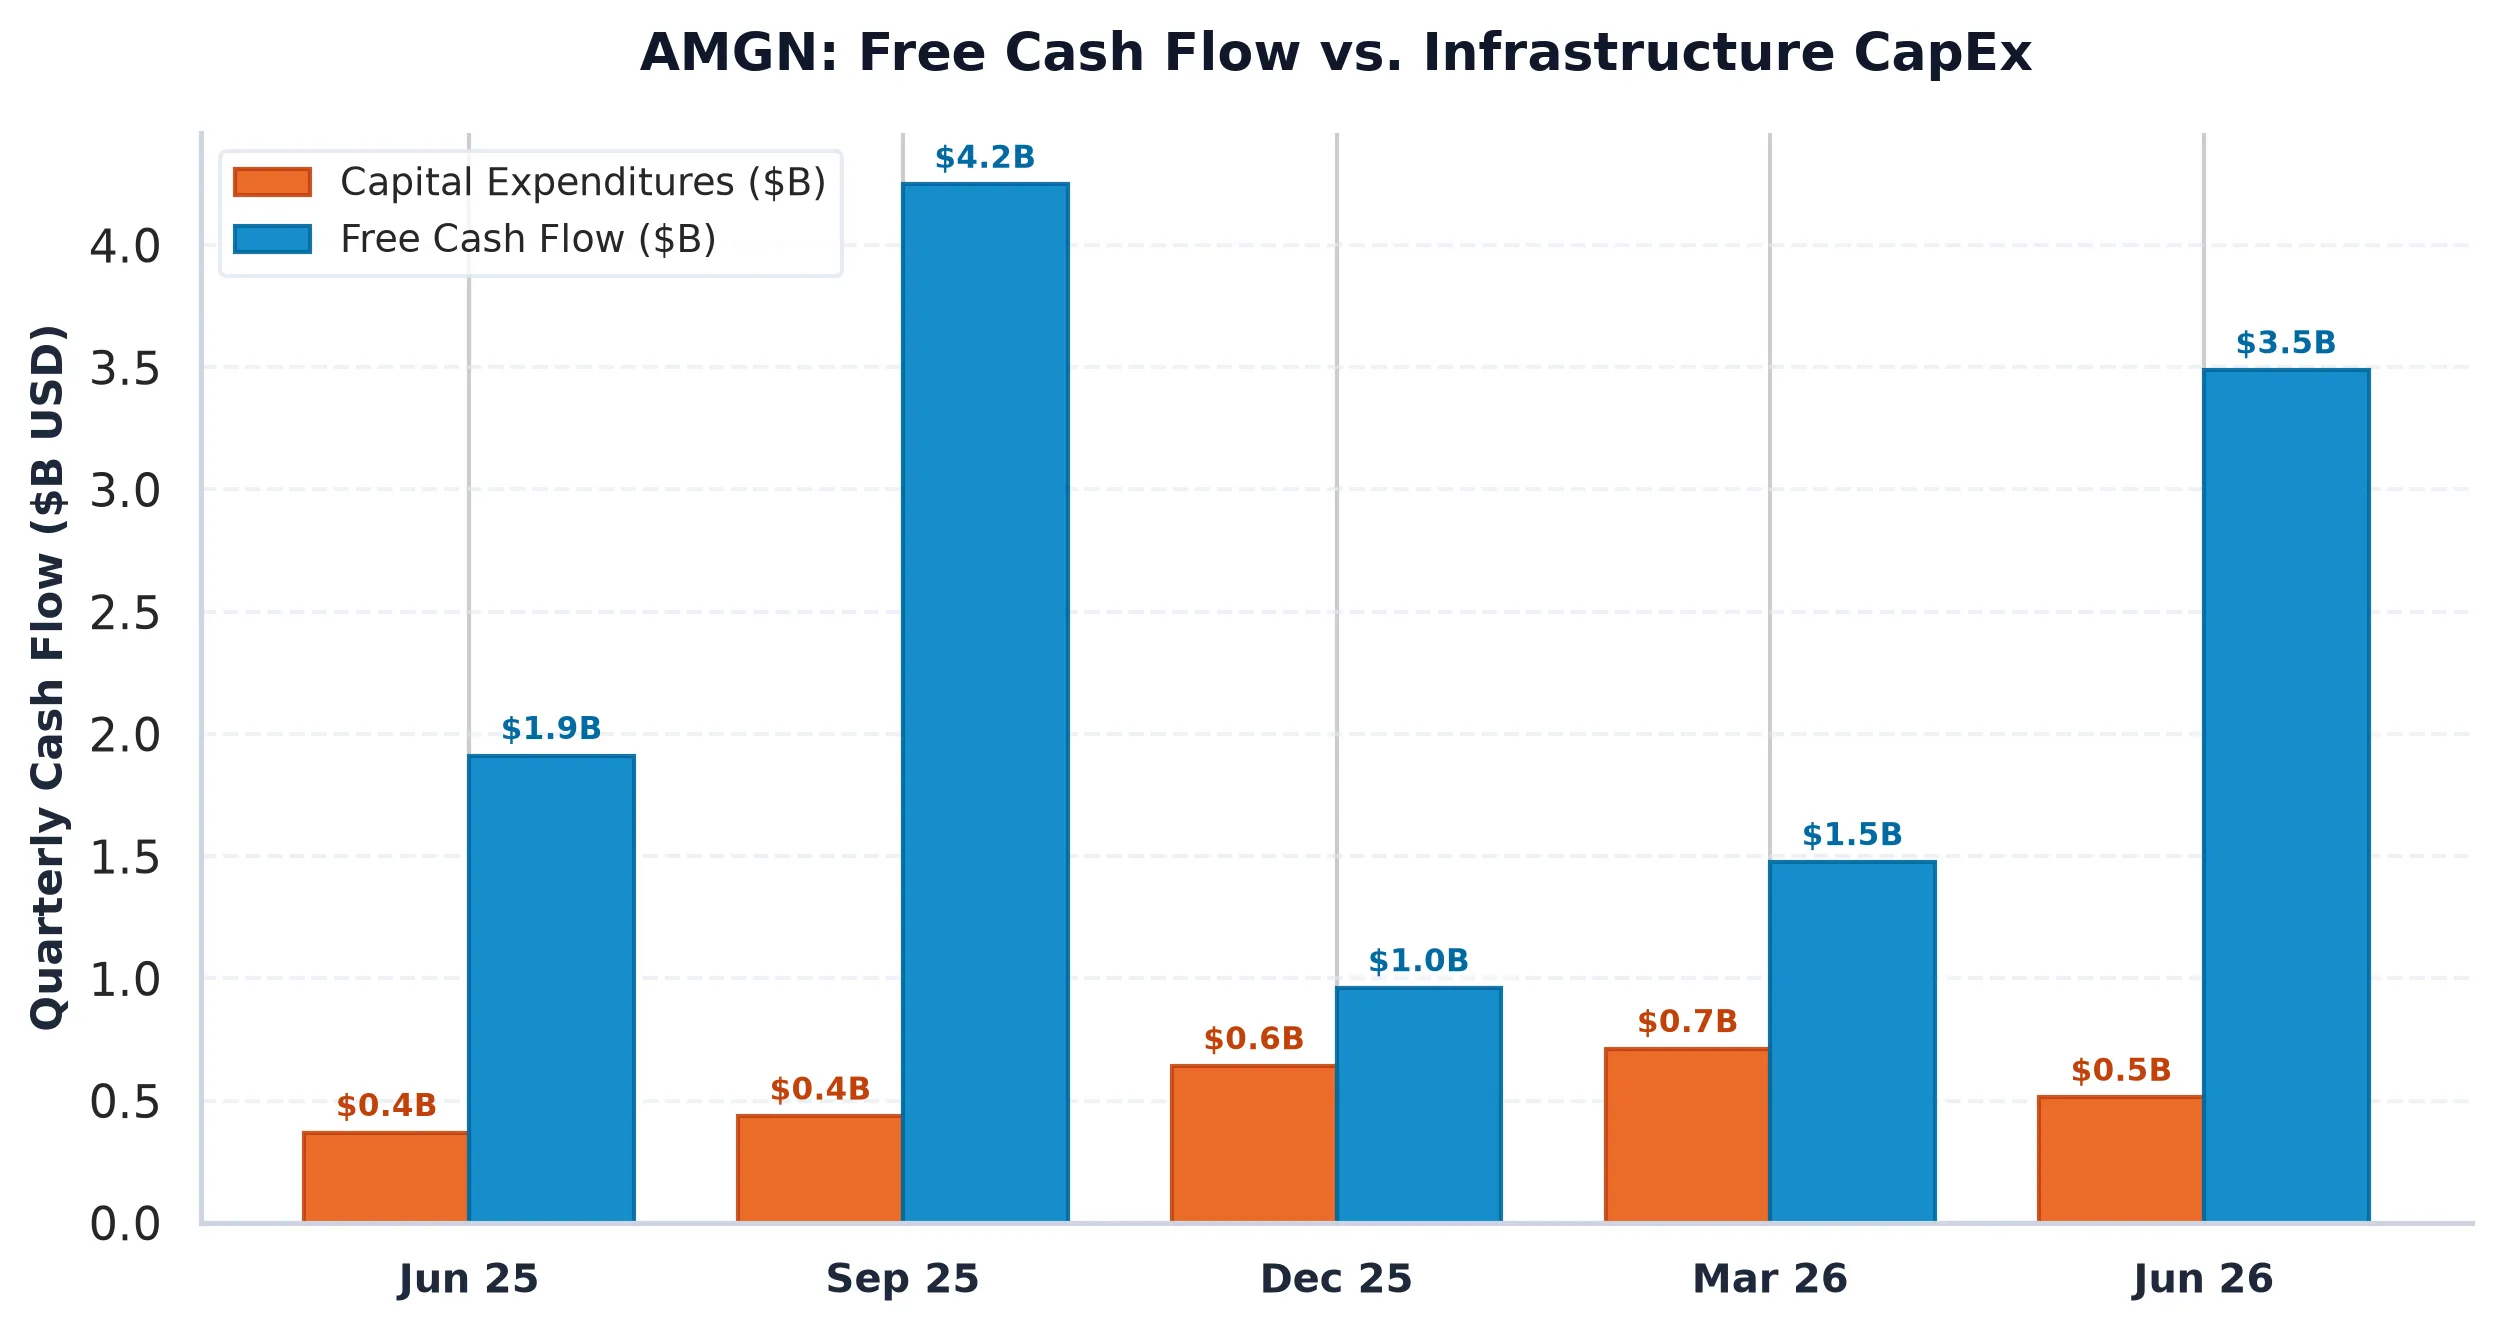
The company generated $8.6 billion in free cash flow over the last twelve months, but it is also carrying $57.3 billion in total debt. In a low interest rate environment, this leverage was a masterstroke of capital structure engineering. In the current environment, it means Amgen has to run much faster just to keep its enterprise value stable. The Return on Invested Capital (ROIC) of 19.45 percent is respectable, comfortably exceeding the 8.5 percent weighted average cost of capital, but it does not leave a massive margin for error if the MariTide clinical data comes back as anything less than spectacular.
Peer Relative Valuation and the Growth Gap
To understand why the market is so obsessed with the obesity pipeline, you have to look at what else is available in the healthcare sector. When you compare Amgen to its direct peers, you see a company trying to bridge the gap between a value play and a growth story.
| Company (Ticker) | Market Cap | Forward P/E | EV/EBITDA | Rev Growth (YoY) | Operating Margin | FCF Yield |
|---|---|---|---|---|---|---|
| Amgen (AMGN) | $250.9B | 18.9x | 17.1x | 9.50% | 35.55% | 3.45% |
| Gilead Sciences (GILD) | $210.5B | 16.8x | 15.7x | 6.8% | 42.4% | 5.07% |
| Vertex Pharmaceuticals (VRTX) | $135.6B | 26.2x | 26.3x | 12.5% | 38.1% | 1.94% |
| Regeneron Pharmaceutic (REGN) | $100.1B | 13.7x | 15.9x | 36.3% | 40.5% | 2.58% |
Gilead Sciences (GILD) offers a much higher free cash flow yield at 5.07 percent, which actually beats the Treasury hurdle, but it lacks the explosive obesity catalyst that investors are currently craving. Vertex Pharmaceuticals (VRTX) trades at a much higher multiple because its monopoly in cystic fibrosis is viewed as an impenetrable fortress. Amgen sits in the middle: more expensive than the legacy drug makers, but not quite as “pure” a growth play as the specialty biotech firms.
The market is currently pricing Amgen as if MariTide is a guaranteed success. The 9.5 percent revenue growth is solid, but it is not “obesity gold rush” growth yet. Most of that growth is coming from the Horizon integration and legacy products like Enbrel and Prolia. For the stock to move higher from here, the company has to prove that it can maintain its 35.5 percent operating margins while spending billions to compete with the marketing machines of Lilly and Novo.
Options Gamma and the Earnings Pin
When you look at the market structure heading into this afternoon’s earnings report, the situation becomes even more precarious for the bulls. The options market is currently leaning into a speculative long skew. The Put/Call Open Interest ratio is a low 0.57, meaning there are nearly two call options for every one put option. This suggests a high level of retail and institutional optimism.
The problem with everyone being on the same side of a trade is that there is no one left to buy the news. There is a massive Call Wall at the $505 strike price. For the stock to break above that level, the earnings report would likely need to include not just a beat and raise, but also a definitive, positive timeline for MariTide Phase 3 results that exceeds all expectations.
On the downside, the Max Pain strike sits at $425, which is roughly 8.4 percent below the current price. If the earnings call is merely “fine,” or if management is vague about the obesity pipeline, those speculative call options will begin to lose value rapidly. As they decay, options dealers who are long the stock to hedge those calls will be forced to sell, creating a mechanical downward pressure. The expected 30 day move is plus or minus 13.23 percent, which is a massive envelope for a blue chip healthcare company. It suggests that the market is treating this earnings report more like a binary clinical trial readout than a standard corporate update.
Given the negative spread between the free cash flow yield and the risk free rate, the compressing historical margins, and the crowded speculative positioning in the options market, the risk reward profile for Amgen at these levels is balanced at best. We are waiting for the clinical reality to catch up to the genomic hype.
AllWallSt Investment Verdict: HOLD
Amgen Inc. (AMGN)
Trailing P/E
Marcus Wolfe Screen
Leverage Profile
30D Channel
MODERATE WATCHLIST (1 flag): Receivables growth outstripped revenue growth by >15%, pointing to potential revenue recognition or collection friction.
Moderate Leverage (2.51x Net Debt/EBITDA); manageable through operating cash generation.
Negative yield spread (-1.50% vs 5.10% Treasury); equity requires robust multiple expansion or growth.
Max Pain: $425.00 (-8.41%) | P/C Ratio: 0.57 | 30D Channel: $402.62 – $525.40. Dealer gamma bounded between $430 Put Wall and $505 Call Wall.
AMGN carries standard index weighting (< 0.6% SPY footprint); sell-side consensus reflects standard earnings momentum rather than index-tracking mandates.
$421.40 – $438.60 (Options Support Pinning)
Sustained weekly close below $430.00 (Put Wall) or gross margin compression below 71.89%.
Sources & References
- Amgen Inc. SEC EDGAR Filings
- Amgen Investor Relations
- SEC Form 10-Q (Filed August 5, 2026)
- SEC Form 10-K (Filed February 13, 2026)
Regulatory Disclaimer: This analysis is for informational purposes only and does not constitute financial, investment, or legal advice. All equity investments involve substantial risk, including the possible loss of principal. The author and AllWallSt are not registered investment advisors. All data is sourced from primary SEC filings and exchange feeds; however, accuracy cannot be guaranteed. Please consult with a qualified financial professional before making any investment decisions.