
The Core Thesis & Market Dislocation
There is a charmingly persistent fiction on Wall Street that pure-play oil and gas producers are essentially unhedged call options on West Texas Intermediate crude. According to this view, when spot commodity prices wobble, equity valuations must immediately follow them down the elevator shaft. As ConocoPhillips (COP) prepares to deliver its third-quarter earnings report tomorrow, mainstream financial media has dutifully dusted off this standard playbook. Headlines fret over near-term realizations, variable dividend swings, and the energy sector’s laggard status, with the Energy Select Sector SPDR Fund (XLE) retreating 5.55% during recent sector rotation.
The consensus view, manifested in a cautious Market Weight index footprint, treats ConocoPhillips as a passive victim of global supply curves. Index-tracking portfolio managers see a company exposed to cyclical duration risks in an era where the 10-Year US Treasury yield hovers around 5.10%. They look at a Free Cash Flow yield of 4.73% and conclude that an equity yield trading slightly inside the sovereign benchmark offers insufficient risk premium.
This perspective misses the entire structural transformation of modern corporate energy. ConocoPhillips is not a passive commodity speculation vehicle. It is a scaled, technology-driven upstream manufacturing engine that converts sub-surface geology into free cash flow with extreme capital efficiency.
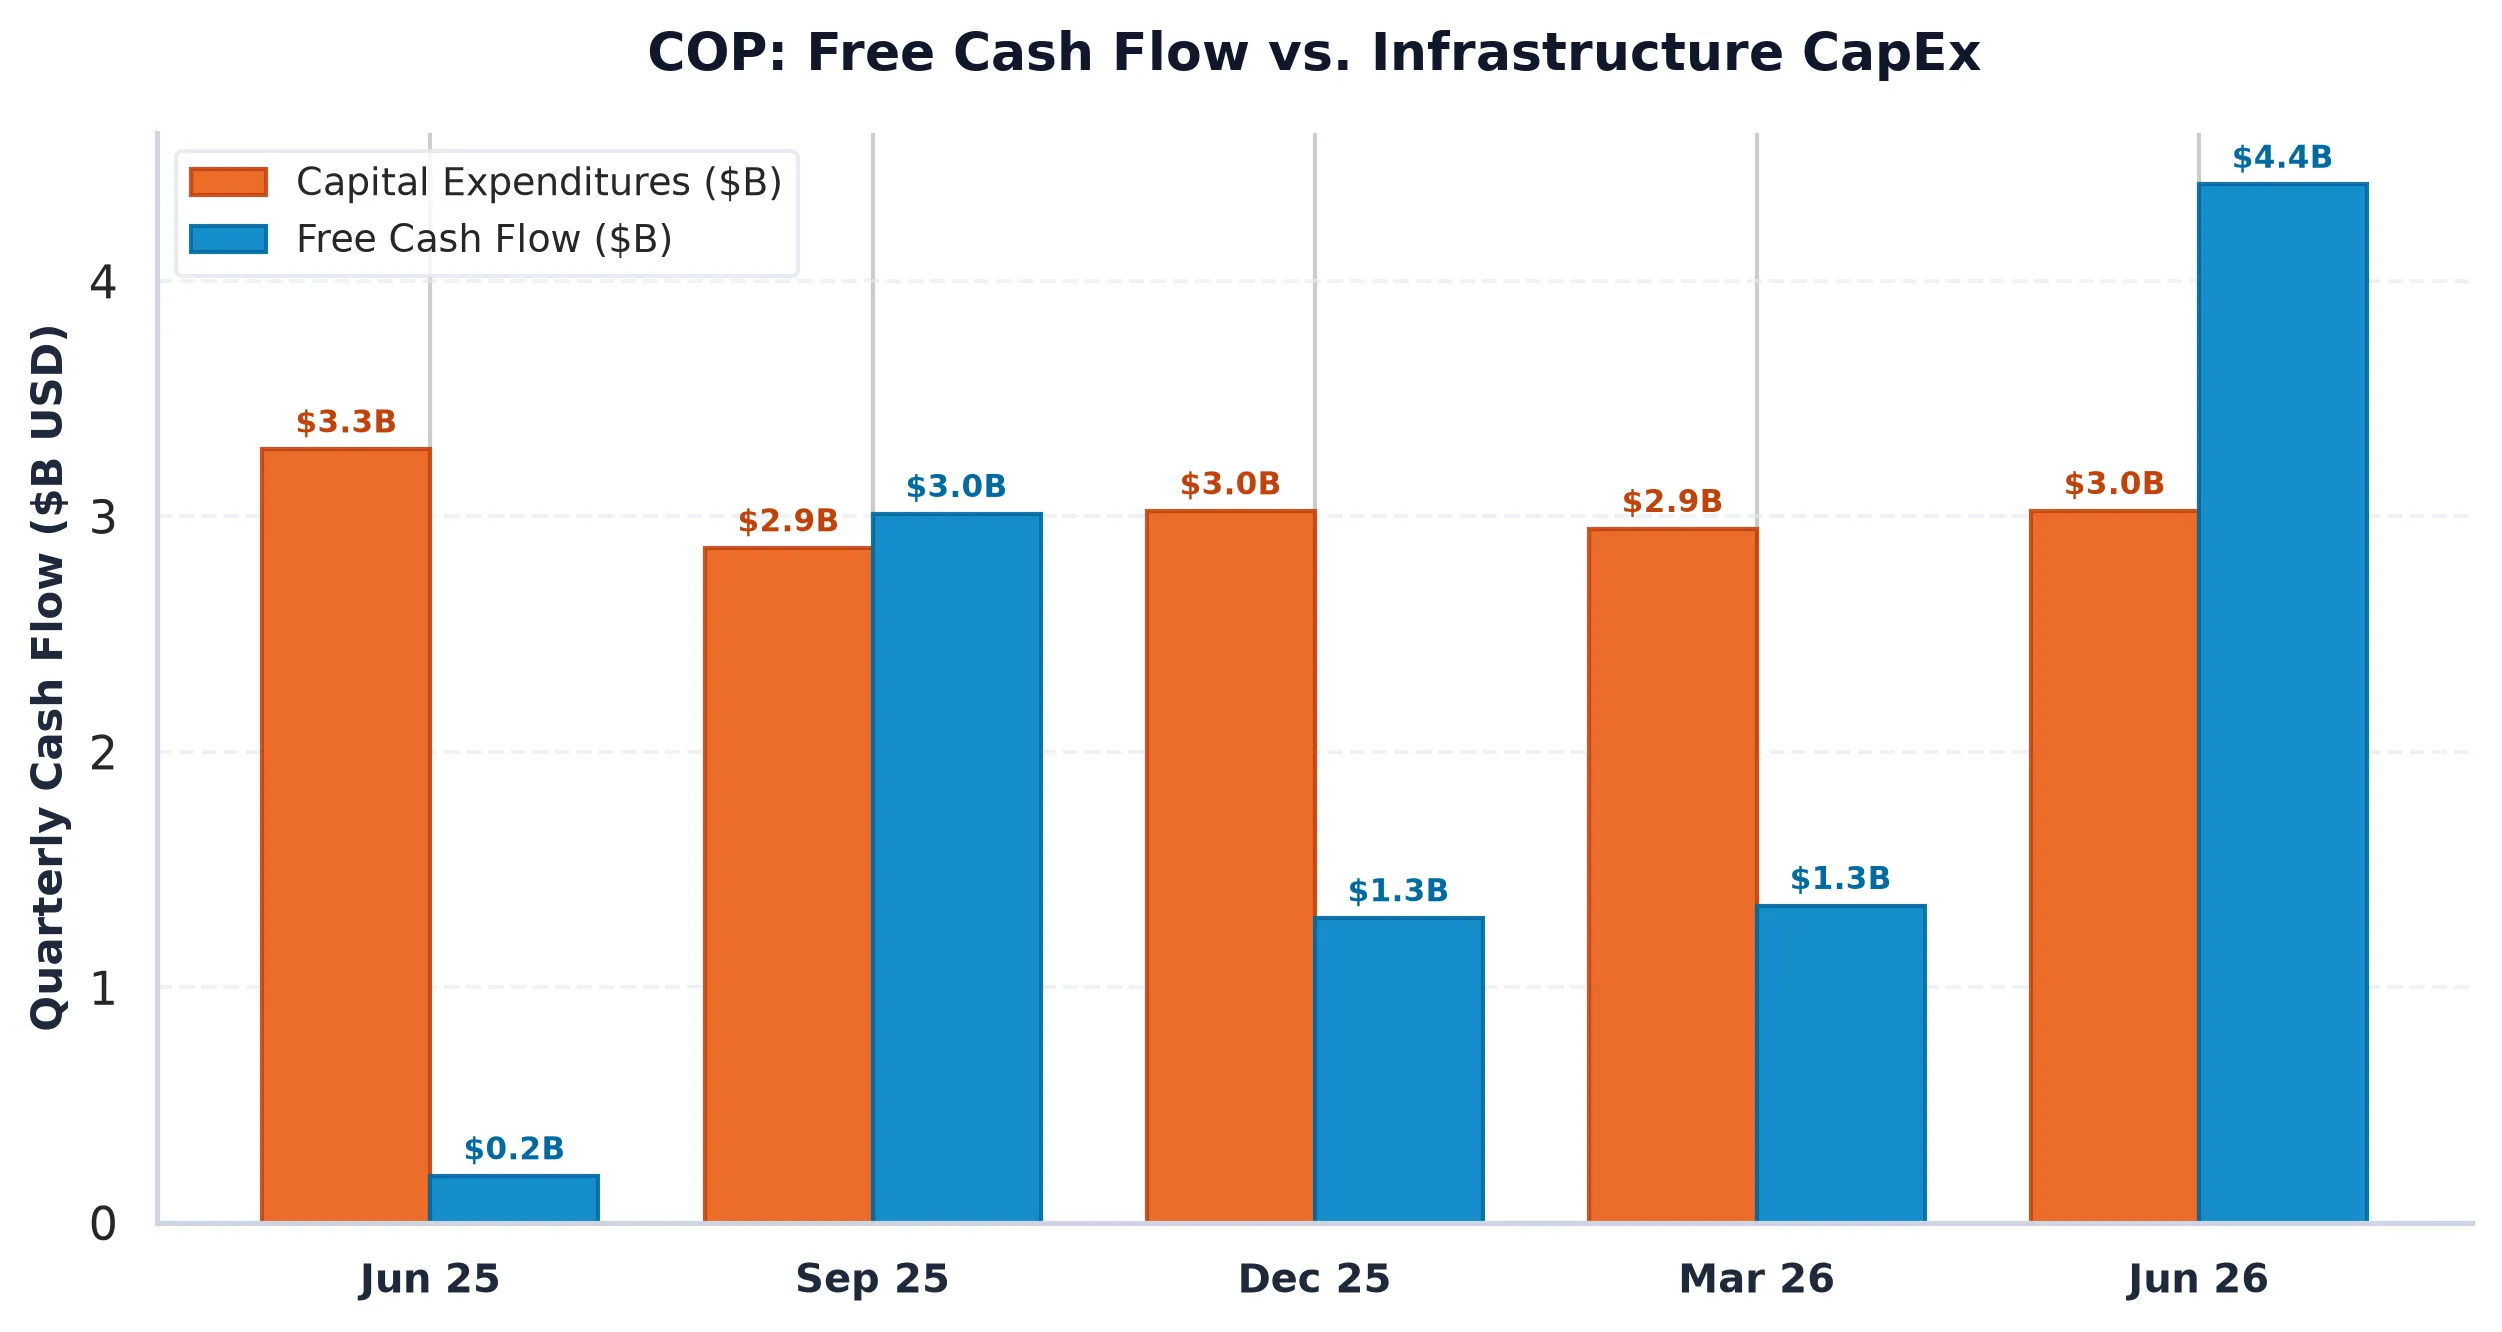
When an industrial enterprise generates a Return on Invested Capital (ROIC) of 19.82% against a Weighted Average Cost of Capital (WACC) hurdle of roughly 8.5%, it is not merely floating on commodity tides. It is actively compounding shareholder wealth. The fundamental dislocation today stems from Wall Street evaluating ConocoPhillips through the rear-view mirror of legacy commodity cycles, failing to price in the massive cash-flow leverage generated by its recent Lower-48 expansion and global liquefied natural gas (LNG) assets.
Multi-Year Financial Trajectory, ROIC & Cash-Flow Mechanics
To understand why consensus is mispricing the equity, one must trace how management navigated the post-2022 normalization. Following the unprecedented energy supply shock of FY2022, when revenue crested at $78.49 billion and free cash flow hit $18.16 billion, top-line figures compressed as natural gas and crude prices normalized. Revenue fell to $56.14 billion in FY2023 and $54.74 billion in FY2024, with operating margins moderating from 32.4% down to 23.4%.
Many sell-side models extrapolated this compression, assuming that free cash flow had permanently structural lower bounds. However, trailing twelve-month operational disclosures reveal a dramatic operational inflection.
| Period | Revenue | Operating Income | Operating Margin | Free Cash Flow | SBC Expense |
|---|---|---|---|---|---|
| FY2022 | $78.49B | $25.46B | 32.4% | $18.16B | N/A |
| FY2023 | $56.14B | $15.03B | 26.8% | $8.72B | N/A |
| FY2024 | $54.74B | $12.78B | 23.4% | $8.01B | N/A |
| FY2025 | $58.94B | $11.34B | 19.2% | $7.24B | N/A |
Over the trailing twelve months, total revenue re-accelerated to $64.46 billion, representing a 35.50% year-over-year expansion. Operating margins rebounded to 31.51%, driving net income to $9.25 billion. Combining 35.50% revenue growth with an 11.9% Free Cash Flow margin yields a Rule of 40 score of 47.4%, placing ConocoPhillips in elite fundamental territory typically reserved for enterprise software platforms, yet trading at a fraction of tech multiples.
Critically, this growth was achieved without torching the balance sheet. Management deployed $14.23 billion in capital expenditures, representing a CapEx intensity of 22.08% relative to revenue. While sell-side skeptics fixate on this absolute reinvestment dollar figure, the return metrics justify every cent spent. Generating an ROIC of 19.82% demonstrates that new capital deployed in the Delaware Basin, Midland Basin, and international gas projects creates substantial economic spread over corporate capital costs.
Furthermore, leverage remains exceptionally low. Total debt of $23.29 billion is offset by $7.69 billion in total cash, yielding net debt of $15.60 billion. This translates to a Net Debt to EBITDA ratio of just 0.58x, providing immense balance sheet insulation against macroeconomic volatility.
Rather than hoarding cash or funding unaccretive vanity projects, ConocoPhillips returned $5.12 billion via annual share repurchases over the trailing period (a 3.14% buyback yield) alongside a 2.33% dividend yield. This yields a total shareholder return yield of 5.47%, fully backed by underlying operational cash flows.
Peer Relative Valuation & Competitive Moat
When evaluating ConocoPhillips against its major peer group, the structural valuation disparity becomes glaring. The market continues to lump ConocoPhillips together with integrated mega-majors or pure Lower-48 onshore operators, failing to reward its superior operating margin profile.
| Company (Ticker) | Market Cap | Forward P/E | EV/EBITDA | Rev Growth (YoY) | Operating Margin | FCF Yield |
|---|---|---|---|---|---|---|
| ConocoPhillips (COP) | $162.7B | 12.4x | 7.1x | 35.50% | 31.51% | 4.73% |
| EOG Resources (EOG) | $77.2B | 9.1x | 5.8x | 58.7% | 40.7% | 5.80% |
| ExxonMobil Holdings (XOM) | $687.0B | 14.0x | 9.5x | 32.6% | 17.0% | 4.21% |
| Chevron (CVX) | $421.6B | 13.2x | 8.1x | 34.8% | 18.0% | N/A |
ConocoPhillips trades at a forward Price-to-Earnings multiple of 12.4x and an Enterprise Value to EBITDA multiple of 7.1x. Compare this to integrated majors like ExxonMobil (14.0x Forward P/E, 9.5x EV/EBITDA) and Chevron (13.2x Forward P/E, 8.1x EV/EBITDA). Despite trading at lower valuation multiples, ConocoPhillips generates an operating margin of 31.51%, nearly double the operating efficiency of ExxonMobil (17.0%) and Chevron (18.0%). Integrated majors suffer from downstream refining drags and bureaucratic capital bloat, whereas ConocoPhillips operates a streamlined, high-margin upstream model.
Conversely, when contrasted with pure-play Lower-48 peers like EOG Resources, which trades at 9.1x forward earnings, ConocoPhillips commands a well-deserved premium. Unlike localized onshore operators, ConocoPhillips possesses deep global LNG exposure and decades of long-life international production that act as a low-decline baseload against shale field decline rates. The market currently prices ConocoPhillips at a discount to sluggish integrated majors while ignoring its vastly superior margin architecture.
Options Gamma Pinning, Risk Bounds & Verdict
While fundamental metrics highlight long-term value, option market structure provides important context for near-term trading dynamics ahead of tomorrow’s earnings release. The options derivatives surface reveals a pronounced speculative long call skew. Total Call Open Interest stands at 48,407 contracts compared to Put Open Interest of 22,136 contracts, yielding a Put/Call Open Interest ratio of 0.46.
This call-heavy positioning creates immediate dealer hedging mechanics. The primary Call Resistance Walls are established at $135 (3,859 contracts), $145 (4,359 contracts), and $150 (14,501 contracts). On the downside, Put Support Walls are anchored at $130 (3,008 contracts) and $120 (1,742 contracts). The options Max Pain strike currently sits at $130.00, roughly 4.04% below the current trading price of $135.47.
At-the-money implied volatility is elevated at 60.52%, driving a deterministic 30-day expected move of +/-$23.50 (or +/-17.35%). Because options dealers are net short calls at upper strike levels, any immediate upside earnings surge toward the $145-$150 zone will force systematic dealer share buying. Conversely, if earnings trigger a initial knee-jerk selloff, dealer hedging is likely to pin spot price toward the heavy $130 Put Wall and Max Pain level, where value buyers will step in.
The mainstream consensus view that ConocoPhillips is trapped in cyclical stagnation overlooks its 19.82% ROIC, pristine 0.58x balance sheet leverage, 31.51% operating margins, and 5.47% total shareholder yield. Any near-term volatility driven by earnings headlines or options market pinning represents a compelling entry point into one of the most efficient capital allocation stories in global energy.
ConocoPhillips (COP)
Trailing P/E
Marcus Wolfe Screen
Leverage Profile
30D Channel
Pristine cash flow conversion (2.48x) and healthy accrual ratio (-9.68%). Zero accounting anomalies detected (LOW ANOMALY RISK).
Prudent Leverage (0.58x Net Debt/EBITDA); well within investment-grade covenant headroom.
Negative yield spread (-0.17% vs 5.10% Treasury); equity requires robust multiple expansion or growth.
Max Pain: $130.00 (-4.04%) | P/C Ratio: 0.46 | 30D Channel: $111.97 – $158.97. Dealer gamma bounded between $130 Put Wall and $150 Call Wall.
COP carries standard index weighting (< 0.6% SPY footprint); sell-side consensus reflects standard earnings momentum rather than index-tracking mandates.
$127.40 – $132.60 (Options Support Pinning)
Sustained weekly close below $130.00 (Put Wall) or gross margin compression below 47.57%.
Sources & References
- ConocoPhillips SEC EDGAR Regulatory Filings (CIK: 0001163165)
- ConocoPhillips Official Investor Relations Portal
- ConocoPhillips Form 10-Q Quarterly Report (Filed August 6, 2026)
- ConocoPhillips Form 10-K Annual Report (Filed February 17, 2026)
Regulatory Disclaimer: The information contained in this dispatch is provided solely for information and educational purposes and does not constitute investment advice, financial analysis, or an offer or solicitation to buy or sell securities. Past performance is no guarantee of future results. All investments involve risk, including the loss of principal. Quantitative metrics and operational data are derived from public SEC EDGAR disclosures and primary market feeds.