
The Core Thesis & Market Dislocation
If you spend enough time reading financial statements, you eventually encounter a specific type of corporate magic called the accrual. In theory, accruals are a sensible way to match revenue with the period in which it was earned. In practice, at Super Micro Computer, Inc. (SMCI), they have become a sort of gravitational anomaly. The company is currently reporting some of the most spectacular growth numbers in the history of the computing industry, yet its bank account appears to be headed in the opposite direction at a similar velocity.
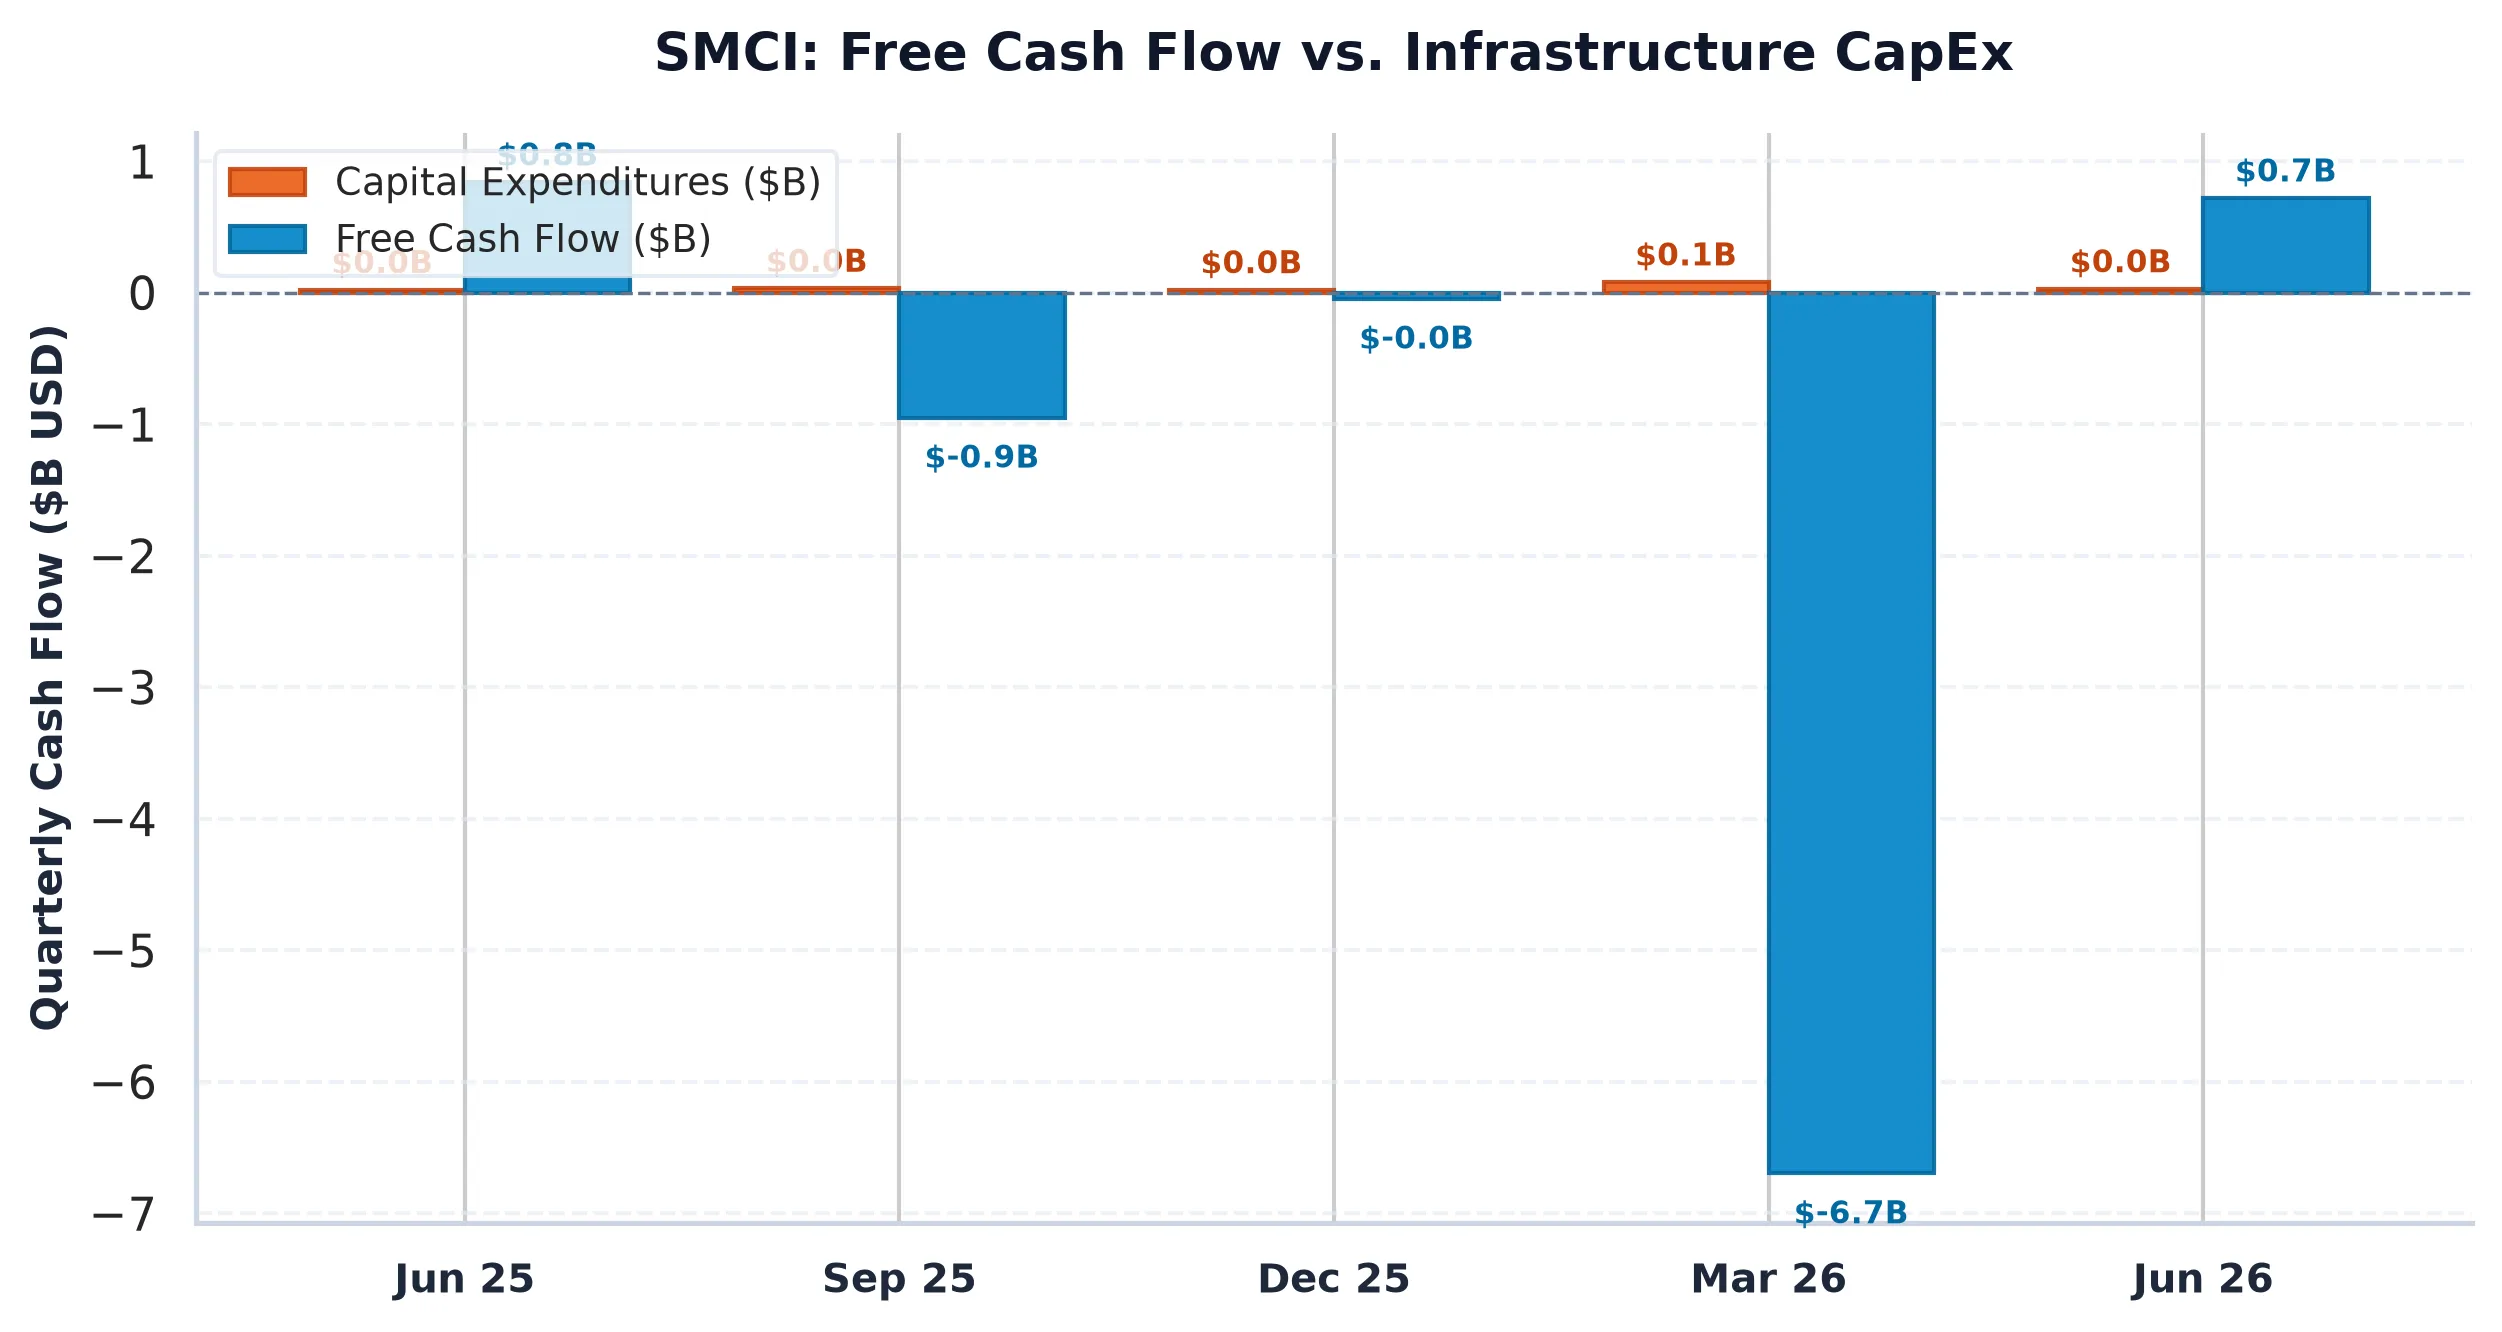
The fundamental tension here is simple: Super Micro is selling AI servers faster than almost anyone else on the planet, but it is not actually collecting cash. In the most recent fiscal year, the company reported a net income of over $3.2 billion. Usually, when a company makes $3 billion in profit, it has more money at the end of the year than it did at the beginning. Super Micro, however, managed to finish the period with a free cash flow of negative $8.06 billion. That is an $11 billion gap between what the accountants say happened and what the corporate treasury actually experienced.
This is what we call a divergence in earnings quality. When you dig into the SEC filings, specifically the recent Form 10-K and the subsequent 8-K disclosures, you find a business that is essentially consuming itself to stay ahead of the AI curve. The market has noticed: the stock trades at a forward P/E of just 4.7x. For a company growing revenue at nearly 300 percent, that multiple is not a bargain; it is a scream of terror from the credit markets.
Multi-Year Financial Trajectory and Cash-Flow Mechanics
To understand how Super Micro got here, you have to look at the transition from being a boring server box maker to an AI infrastructure titan. A few years ago, the company was a modest, cash-flow positive enterprise. Today, it is a high-speed funnel for Nvidia chips, where the chips come in the back door and the finished servers go out the front door, but the cash stays stuck in the plumbing.
| Period | Revenue | Operating Income | Operating Margin | Free Cash Flow | SBC Expense |
|---|---|---|---|---|---|
| FY2023 | $7.12B | $761.1M | 10.7% | $626.8M | $54.4M |
| FY2024 | $14.99B | $1.21B | 8.1% | $-2.61B | $231.5M |
| FY2025 | $21.97B | $1.25B | 5.7% | $1.53B | $314.5M |
| FY2026 | $39.06B | $2.77B | 7.1% | $-6.97B | $412.1M |
The trajectory is alarming. In FY2023, the company was actually generating cash. By FY2026, revenue had quintupled, but free cash flow had collapsed to a nearly $7 billion deficit. Our forensic screening flagged five critical red flags, the most prominent being that accounts receivable and inventory growth are wildly outstripping revenue growth.
When receivables grow faster than sales, it often means a company is pulling forward demand or offering increasingly generous terms to customers who might not be in a hurry to pay. When inventory grows faster than the cost of goods sold, it means the warehouse is filling up with parts that haven’t been turned into sales yet. In the fast-moving world of AI, where a state-of-the-art GPU can become a legacy component in eighteen months, holding $5 billion in inventory is less like an asset and more like a ticking time bomb of potential write-downs.
Furthermore, the accrual ratio has spiked to 30.19 percent. In institutional research, any accrual ratio over 10 percent is considered a high-risk indicator for earnings manipulation or, at the very least, very low earnings persistence. Super Micro is effectively telling the world it is highly profitable while simultaneously needing to borrow billions of dollars just to keep the lights on. The net debt has ballooned to $2.34 billion, and while the Net Debt to EBITDA ratio looks manageable at 0.50x, that ratio assumes the EBITDA is real. If the cash isn’t there, the leverage is much heavier than it appears.
Peer Relative Valuation and Competitive Moat
The bull case for Super Micro is that they are the first movers in liquid-cooled AI racks and that their speed to market justifies the cash burn. However, when you look at the peer group, the “speed” looks more like a lack of capital discipline. Dell and Hewlett Packard Enterprise (HPE) are also benefiting from the AI boom, but they are doing so while maintaining positive free cash flow and vastly superior margin profiles.
| Company (Ticker) | Market Cap | Forward P/E | EV/EBITDA | Rev Growth (YoY) | Operating Margin | FCF Yield |
|---|---|---|---|---|---|---|
| Super Micro Computer (SMCI) | $18.0B | 4.7x | 5.5x | 297.50% | 10.35% | -44.85% |
| Dell Technologies (DELL) | $212.9B | 11.1x | 14.7x | 57.7% | 12.0% | 2.83% |
| Hewlett Packard Enterp (HPE) | $60.6B | 9.6x | 11.7x | 33.7% | 12.6% | 7.82% |
| NVIDIA (NVDA) | $4.60T | 12.0x | 23.8x | 105.9% | 66.2% | 0.91% |
Super Micro’s operating margin of 10.35 percent is lower than both Dell and HPE, despite the fact that Super Micro claims to be the “pure play” leader in the highest-margin segment of the market. Even more damning is the free cash flow yield comparison. While Dell and HPE offer positive yields (2.83 percent and 7.82 percent respectively), Super Micro is sitting at a negative 44.85 percent.
In a world where the 10-Year Treasury yield is 5.10 percent, an equity investor is essentially paying Super Micro for the privilege of watching them burn through capital. The forward P/E of 4.7x is the market’s way of saying it expects a massive revision downward. If you normalize Super Micro’s earnings to account for the actual cash being generated (or lost), the company isn’t trading at 4.7x earnings: it is trading at an infinite multiple of non-existent cash.
The competitive moat is also under fire. As Dell and HPE ramp up their AI server offerings, the “first mover” advantage is evaporating. Super Micro is stuck in a vice: it must keep buying expensive GPUs to satisfy its growth narrative, but it cannot seem to convert those sales into a sustainable cash cycle. This is the classic “growth at any cost” model, but the cost has now exceeded the market capitalization of the company.
Options Gamma Pinning, Risk Bounds and Verdict
The options market is currently a theater of pure speculation. The Put/Call Open Interest ratio is a measly 0.42, which tells us that retail traders and momentum chasers are still piling into calls, hoping for a “short squeeze” or a sudden return to the glory days of 2024. However, the market structure tells a different story.
There is a massive Call Wall at $34.50 and $36.50. These are levels where dealers have sold calls to the public and are likely long the stock as a hedge. If the price fails to move toward these strikes, the “charm” and “vanna” flows will force dealers to sell their hedges, creating a mechanical drag on the stock price. The Max Pain strike is currently $32.00, which is nearly 17 percent above the current spot price. While that might look like “upside,” in a high-volatility environment (103 percent IV), it more likely represents the point where the most option buyers lose the most money.
The expected 30-day move is a staggering +/- 29.53 percent. This is not the volatility of a stable technology company: it is the volatility of a biotech firm awaiting an FDA decision or a company awaiting a forensic audit result. Given the recent Form 8-K filing on October 15 regarding the departure of principal officers and the continued delay in filing finalized audited financials, the risk is decidedly to the downside.
When a company grows revenue by 297 percent and manages to lose $8 billion in the process, it is not a business: it is a logistics operation for Nvidia that has forgotten to charge for its services. The divergence between net income and operating cash flow is too large to ignore, and the inventory bloat suggests that a massive impairment charge is looming on the horizon. Until Super Micro can prove that its “profits” can actually be deposited into a bank account, it remains a high-conviction short candidate.
AllWallSt Investment Verdict: SELL
Super Micro Computer, Inc. (SMCI)
Trailing P/E
Marcus Wolfe Screen
Leverage Profile
30D Channel
CRITICAL / HIGH ALERT (5 flags): Net income is positive while operating cash flow is negative (-6,809,886,000 vs 2,230,453,000), indicating aggressive earnings quality and activating Marcus Wolfe forensic scrutiny. Receivables growth outstripped revenue growth by >15%, pointing to potential revenue recognition or collection friction. Accruals represent 30.19% of total assets (exceeding 10% severe threshold), signaling low earnings persistence. Inventory growth outpaced COGS growth by >15%, signaling potential inventory bloat or pending margin compression.
Prudent Leverage (0.50x Net Debt/EBITDA); well within investment-grade covenant headroom.
Negative yield spread (-49.75% vs 5.10% Treasury); equity requires robust multiple expansion or growth.
Max Pain: $32.00 (+16.92%) | P/C Ratio: 0.42 | 30D Channel: $19.29 – $35.45. Dealer gamma bounded between $20 Put Wall and $34.5 Call Wall.
SMCI operates with negligible index gravitational pull. Sell-side ratings reflect pure idiosyncratic fundamental consensus without passive indexing distortion.
$19.60 – $20.40 (Options Support Pinning)
Sustained weekly close below $20.00 (Put Wall) or gross margin compression below 11.67%.
Sources & References
- Official SEC Form 10-Q Quarterly Report (Filed 2026-05-11)
- SEC EDGAR Filings for Super Micro Computer, Inc.: https://www.sec.gov/edgar/browse/?CIK=0001375365
- Super Micro Investor Relations: https://www.supermicro.com/en/investor
- SEC Form 10-K (Filed 2026-08-31): https://www.sec.gov/Archives/edgar/data/1375365/000137536526000022/smci-20260630.htm
- SEC Form 8-K (Filed 2026-11-03): https://www.sec.gov/Archives/edgar/data/1375365/000137536526000026/smci-20261103.htm
Regulatory Disclaimer: This report is for informational purposes only and does not constitute financial, legal, or investment advice. The AllWallSt quantitative and forensic models are based on primary SEC filings and exchange data which are subject to change. Short selling involves significant risk, including the potential for unlimited loss. AllWallSt and its affiliates may hold positions in the securities mentioned. Past performance is not indicative of future results. Consult with a licensed financial advisor before making any investment decisions.