
The prevailing wisdom on Wall Street regarding Tesla, Inc. (TSLA) has recently shifted from a debate about autonomous driving software to a debate about political lobbying as a capital asset. The consensus narrative, pushed heavily across terminal feeds and cable news, suggests that Elon Musk has effectively purchased a regulatory moat. By aligning himself and his capital with specific political outcomes, the theory goes, Tesla has secured a permanent seat at the table for EV tax credit negotiations and environmental policy drafting. This is what we might call the Regulatory Insurance Policy.
However, recent reports from the US midterm elections suggest that this insurance policy might have a very high deductible and very little actual coverage. Reuters recently noted that Musk has little to show for his record spending on Republican campaigns. If the goal was to buy a friendly legislative landscape, the return on invested capital for those political donations looks remarkably similar to Tesla’s own internal return on invested capital: underwhelming.
When you strip away the political theater, you are left with a car company that is currently experiencing the financial equivalent of a slow-motion skid. The market is pricing Tesla as a sovereign technology entity, yet the primary SEC filings describe a business that is struggling to grow revenue while its margins compress toward the level of a legacy mid-market manufacturer.
The Fundamental Decay and the Rule of 40 Failure
To understand the disconnect at Tesla, Inc. (TSLA), one must look past the social media headlines and into the Form 10-Q filed on October 22, 2026. The numbers tell a story of a business that has reached a plateau. Revenue growth for the most recent period was negative 0.20 percent. For a company trading at a forward price to earnings multiple of 159.8x, zero growth is not just a disappointment: it is a mathematical crisis.
The Rule of 40 is a standard metric used to evaluate the health of high-growth technology companies by adding their revenue growth rate to their free cash flow margin. A healthy tech firm should score above 40 percent. Tesla currently scores a 4.6 percent. This is the result of adding that flat revenue growth to a thin 4.8 percent free cash flow margin. By this metric, Tesla is not a high-growth tech company. It is a mature industrial concern with a very expensive marketing department.
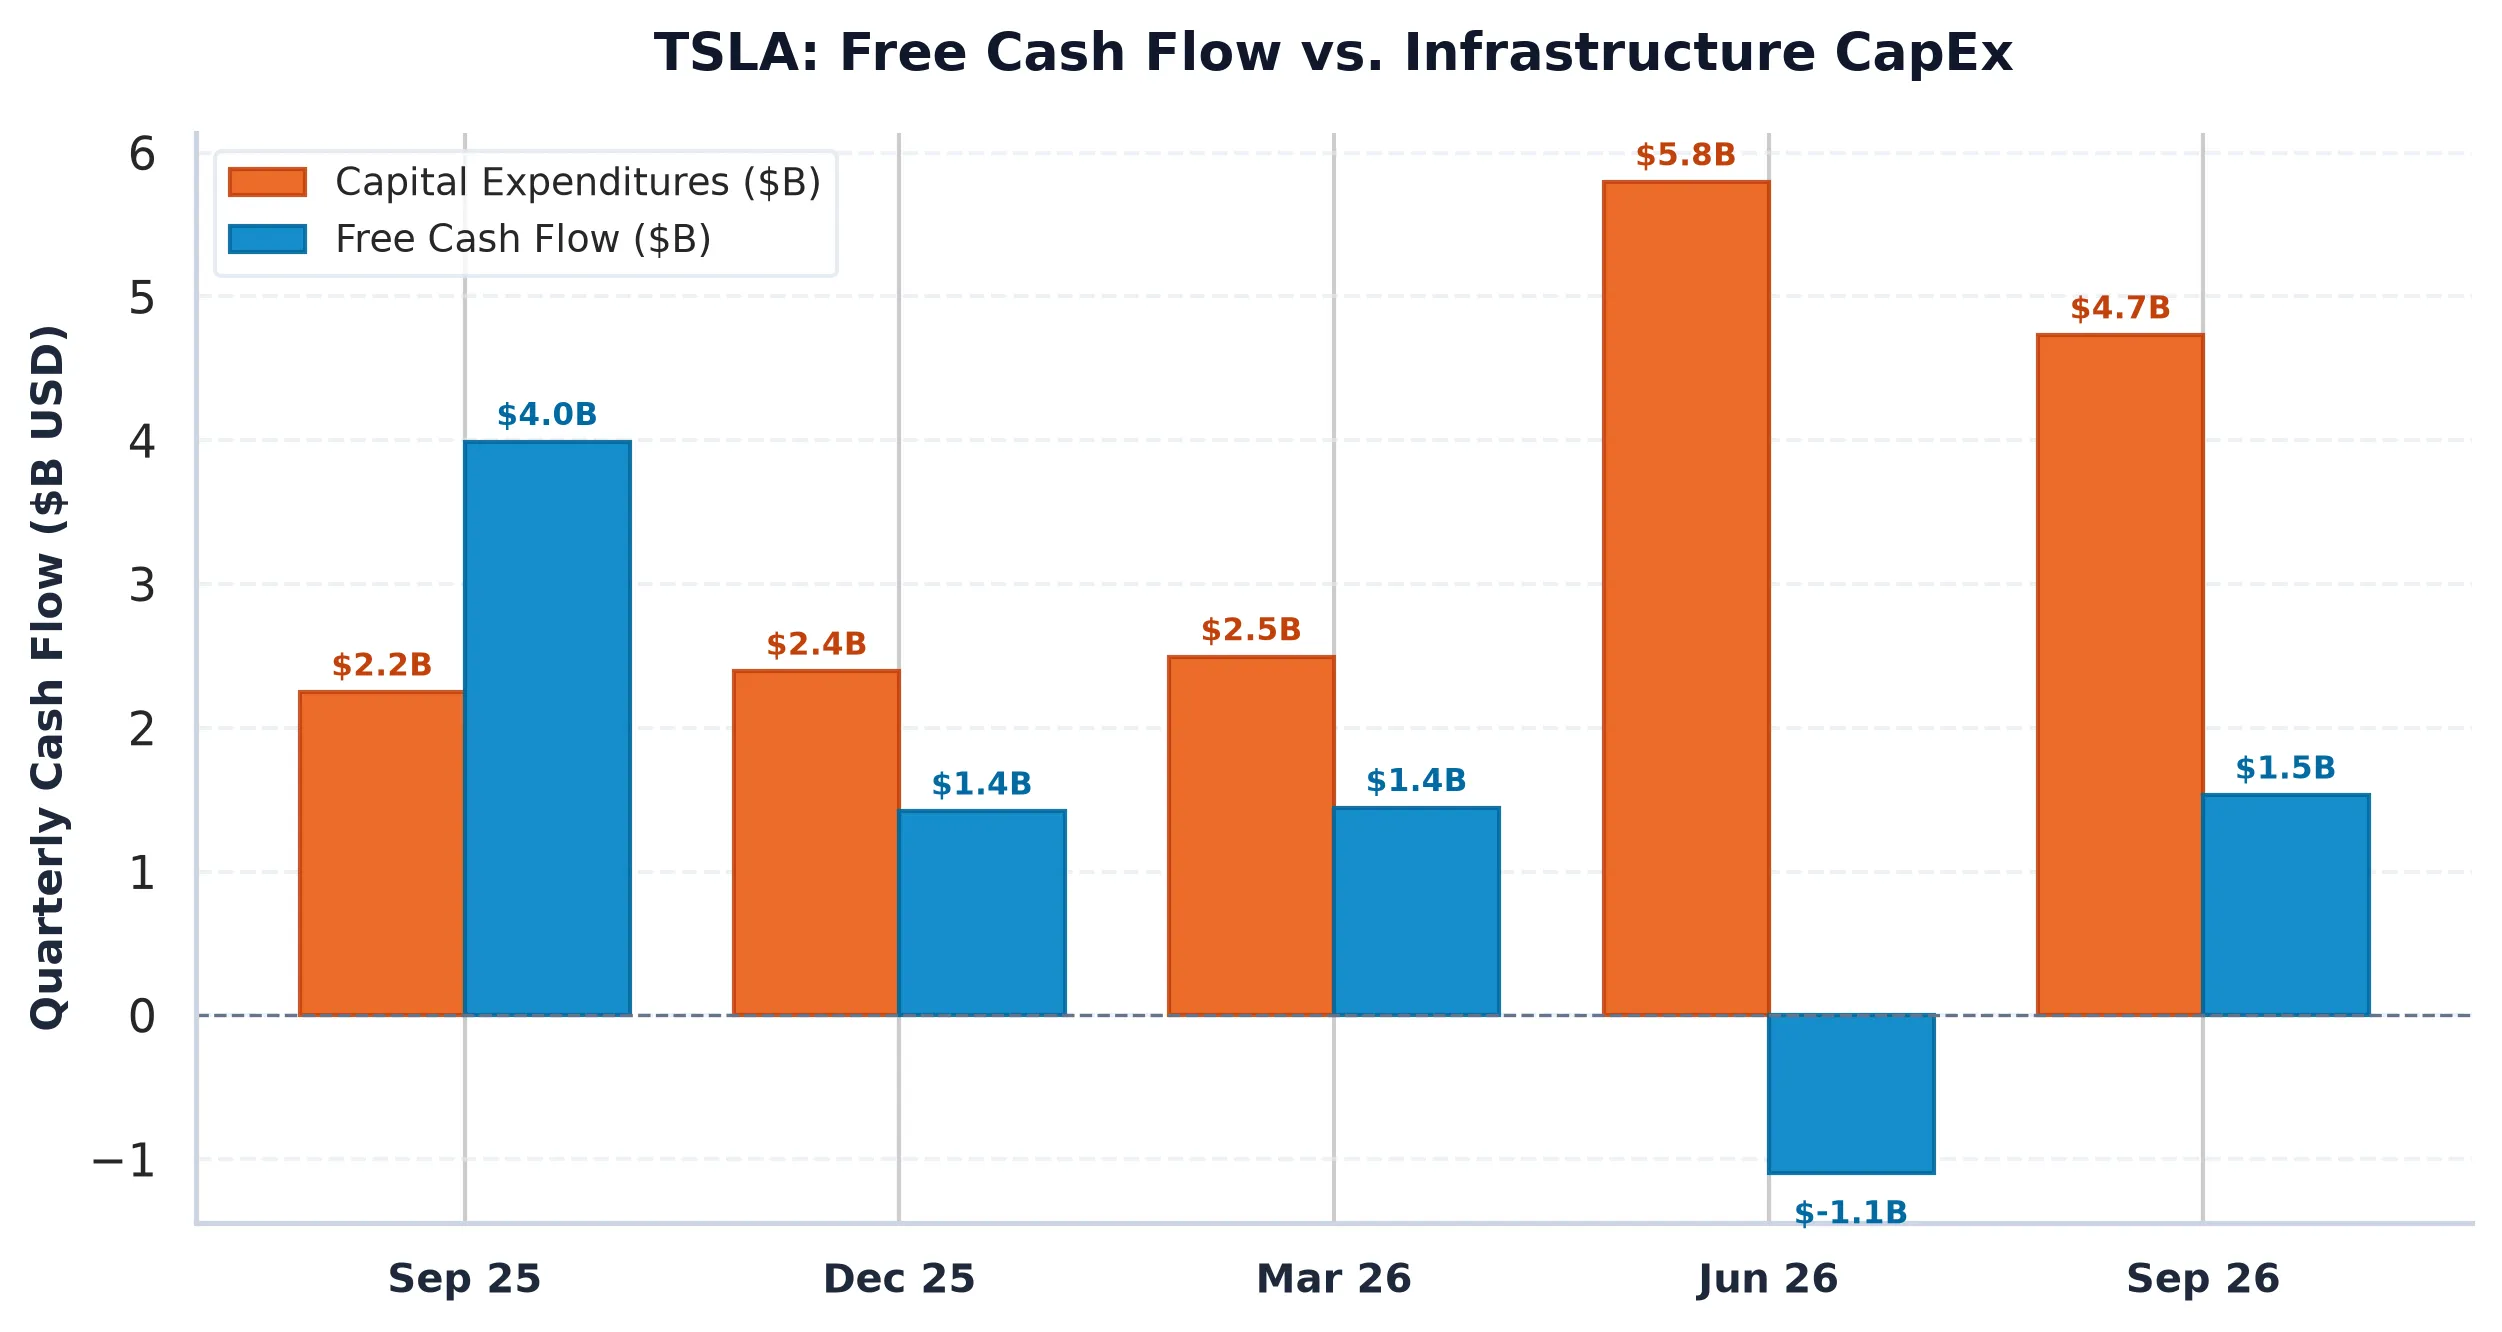
The multi-year trajectory is even more concerning. In fiscal year 2022, Tesla enjoyed an operating margin of 17.0 percent. By fiscal year 2025, that margin had withered to 5.1 percent. This compression is the direct result of aggressive price cutting required to move inventory in a saturated market. While the company spent 13.27 percent of its revenue on capital expenditures, roughly 13.74 billion dollars, the return on that invested capital (ROIC) stands at 7.28 percent. Given that Tesla’s weighted average cost of capital is estimated at 8.5 percent, the company is effectively destroying value with every new factory it builds.
Furthermore, the quality of the reported free cash flow is questionable. Of the 4.97 billion dollars in free cash flow, 2.83 billion dollars, or over 57 percent, is actually stock-based compensation. When you adjust for this dilution, the real economic cash flow available to shareholders is negligible. In an environment where the 10-Year Treasury yield is 5.10 percent, an equity with a 0.36 percent free cash flow yield represents a massive negative risk premium. Investors are essentially paying Tesla for the privilege of owning a volatile asset that yields less than a risk-free government bond.
Peer Relative Valuation and the Competitive Reality
The consensus often argues that Tesla has no peers because it is a robotics and AI company. However, the income statement insists that it is an auto manufacturer. When we compare Tesla to its actual competitors, the valuation disparity becomes impossible to justify through fundamental analysis alone.
| Company (Ticker) | Market Cap | Forward P/E | EV/EBITDA | Rev Growth (YoY) | Operating Margin | FCF Yield |
|---|---|---|---|---|---|---|
| Tesla (TSLA) | $1.36T | 159.8x | 151.9x | -0.20% | 5.36% | 0.36% |
| General Motors Company (GM) | $75.8B | 6.0x | 9.7x | 2.9% | 7.3% | 37.63% |
| Ford Motor Company (F) | $49.9B | 6.6x | 24.4x | -2.0% | 3.1% | -12.42% |
| Rivian Automotive (RIVN) | $18.9B | N/A | N/A | 38.3% | -40.9% | -11.60% |
General Motors currently generates a higher operating margin (7.3 percent) than Tesla (5.36 percent) and trades at a forward P/E of 6.0x. Tesla trades at 159.8x. To justify this gap, Tesla would need to prove it can scale its non-automotive businesses, such as energy storage or robotics, to a level that dwarfs its car business. Yet, the 10-K filings show that the vast majority of revenue remains tied to vehicle sales and regulatory credits.
Even SpaceX (SPCX), which is now a publicly traded reporting entity on Nasdaq, provides a cautionary tale. While SpaceX has successfully navigated its own capital intensity, it does not provide a fundamental lift to Tesla’s balance sheet. The two entities are legally and financially distinct. The “Musk Premium” that investors apply to Tesla assumes a level of cross-pollination and political leverage that the recent midterm results have called into question. If the political leverage is failing and the car margins are converging with Ford and GM, the only thing supporting the 1.36 trillion dollar market cap is institutional index mandates.
Options Market Structure and the Gamma Trap
The current market structure for Tesla, Inc. (TSLA) suggests that professional traders are increasingly skeptical of the current price levels. The Put/Call open interest ratio has climbed to 1.36, indicating a significant defensive skew. Institutional investors are buying protection in size. The primary put support, or the Put Wall, is situated far below at 240 dollars, suggesting a massive air pocket if the current support levels fail.
The Max Pain strike is currently 392.50 dollars, which is nearly 14 percent above the current spot price. In a typical market, this might exert a magnetic upward pull. However, the implied volatility is sitting at a staggering 77.72 percent. This suggests that the market is pricing in a 30-day expected move of plus or minus 22 percent. When volatility is this high, dealer gamma hedging becomes a source of instability rather than a pinning force. If Tesla breaks below the 330 dollar support level, dealers who are short puts will be forced to sell the underlying stock to remain delta neutral, potentially accelerating any downward move.
We first issued a SELL rating on Tesla fifteen days ago when the price was 386.85 dollars. Since then, the stock has entered what Bloomberg calls a deepening post-election slump. The fundamental reality we highlighted then, the 0.32 percent yield mirage, has only become more evident as the political catalyst has failed to materialize. The company is now caught between a weakening consumer discretionary environment and a valuation that requires perfection.
The “Benchmark Gravity” mentioned by sell-side analysts is the only remaining pillar of support. Because Tesla represents roughly 2.5 percent of the S&P 500, index fund managers are forced to buy it regardless of the valuation. This creates a structural bid that has nothing to do with free cash flow or operating margins. It is a game of musical chairs where the music is provided by passive index flows. When those flows turn, as they often do during periods of rising interest rates and macro uncertainty, the exit door for a 1.36 trillion dollar company is remarkably narrow.
AllWallSt Investment Verdict: SELL (Reaffirmed)
Tesla, Inc. (TSLA)
Trailing P/E
Marcus Wolfe Screen
Leverage Profile
30D Channel
Pristine cash flow conversion (3.89x) and healthy accrual ratio (-7.95%). Zero accounting anomalies detected (LOW ANOMALY RISK).
Fortress Balance Sheet (Net Cash Position; zero net refinancing distress).
Negative yield spread (-4.46% vs 5.10% Treasury); equity requires robust multiple expansion or growth.
Max Pain: $392.50 (+13.77%) | P/C Ratio: 1.36 | 30D Channel: $268.12 – $421.84. Dealer gamma bounded between $240 Put Wall and $400 Call Wall.
TSLA commands a massive ~2.5% S&P 500 benchmark footprint. Wall Street sell-side consensus reflects structural career-risk defense: institutional funds face severe benchmark tracking penalties for underweighting mega-cap heavyweights, forcing mandatory allocations regardless of current Free Cash Flow yield.
$235.20 – $244.80 (Options Support Pinning)
Sustained weekly close below $240.00 (Put Wall) or gross margin compression below 19.29%.
Sources & References
- Official SEC Form 10-K Annual Report (Filed 2026-01-29)
- Tesla, Inc. Investor Relations: https://www.tesla.com
- SEC EDGAR Filings for Tesla, Inc. (CIK 0001318605): https://www.sec.gov/edgar/browse/?CIK=0001318605
- Tesla Form 10-Q Filed October 22, 2026: https://www.sec.gov/Archives/edgar/data/1318605/000162828026066775/tsla-20260930.htm
- Reuters: Musk political spending analysis (November 2026)
Disclaimer: This report is for informational purposes only and does not constitute financial, legal, or tax advice. The analytical contents reflect institutional market structure and fundamental data as of the date of publication. Investing in equities and derivatives involves significant risk, including the potential loss of principal. AllWallSt and its contributors are not registered investment advisors. Past performance is not indicative of future results.