
The current consensus regarding JPMorgan Chase & Co. (JPM) is that the bank is currently navigating a rather messy intersection of political theater and macroeconomic luck. On one hand, you have a Senate subcommittee dusting off old files to investigate the bank’s historical relationship with Jeffrey Epstein. This has the predictable effect of making for very exciting cable news segments and very boring, albeit expensive, legal bills. On the other hand, the U.S. labor market just printed a jobs report that looks less like a cooling economy and more like a rocket ship with a 4.1% unemployment rate.
The mainstream narrative suggests that the 6.2% single-session drop earlier this week was a rational reaction to regulatory risk. If you spend enough time reading the headlines, you might believe that a few subpoenas from Washington are enough to dismantle the largest credit machine in the Western world. However, if you look at the mechanics of the balance sheet, a different story emerges. JPMorgan Chase is not just a bank: it is a functional proxy for the U.S. economy. When the labor market refuses to quit, the bank’s Net Interest Income (NII) remains in a state of perpetual high-altitude cruising.
The Core Thesis and Market Dislocation
The primary dislocation here is between the noise of political optics and the signal of interest rate durability. While the market panicked over the Senate probe, it largely ignored the fact that a resilient labor market effectively forces the Federal Reserve to keep rates higher for longer. For a bank with a total cash pile of $1.59 trillion, higher rates are not a headwind: they are a gift. Every day that the “no landing” scenario remains the base case for the U.S. economy, JPMorgan Chase continues to extract massive spreads from its loan book while delaying the credit normalization cycle that usually eats into bank margins during a recession.
The recent 6.2% dip represents a classic narrative-driven air pocket. Institutional investors, particularly the 42 ETFs that added to their positions on November 4, seem to understand that the structural power of the fortress balance sheet outweighs the temporary embarrassment of a congressional hearing. The bank is currently trading around $338.15, which is remarkably close to the options market “Max Pain” strike of $340.00. This suggests that the price action is being pinned by dealer hedging rather than a fundamental exodus of capital.
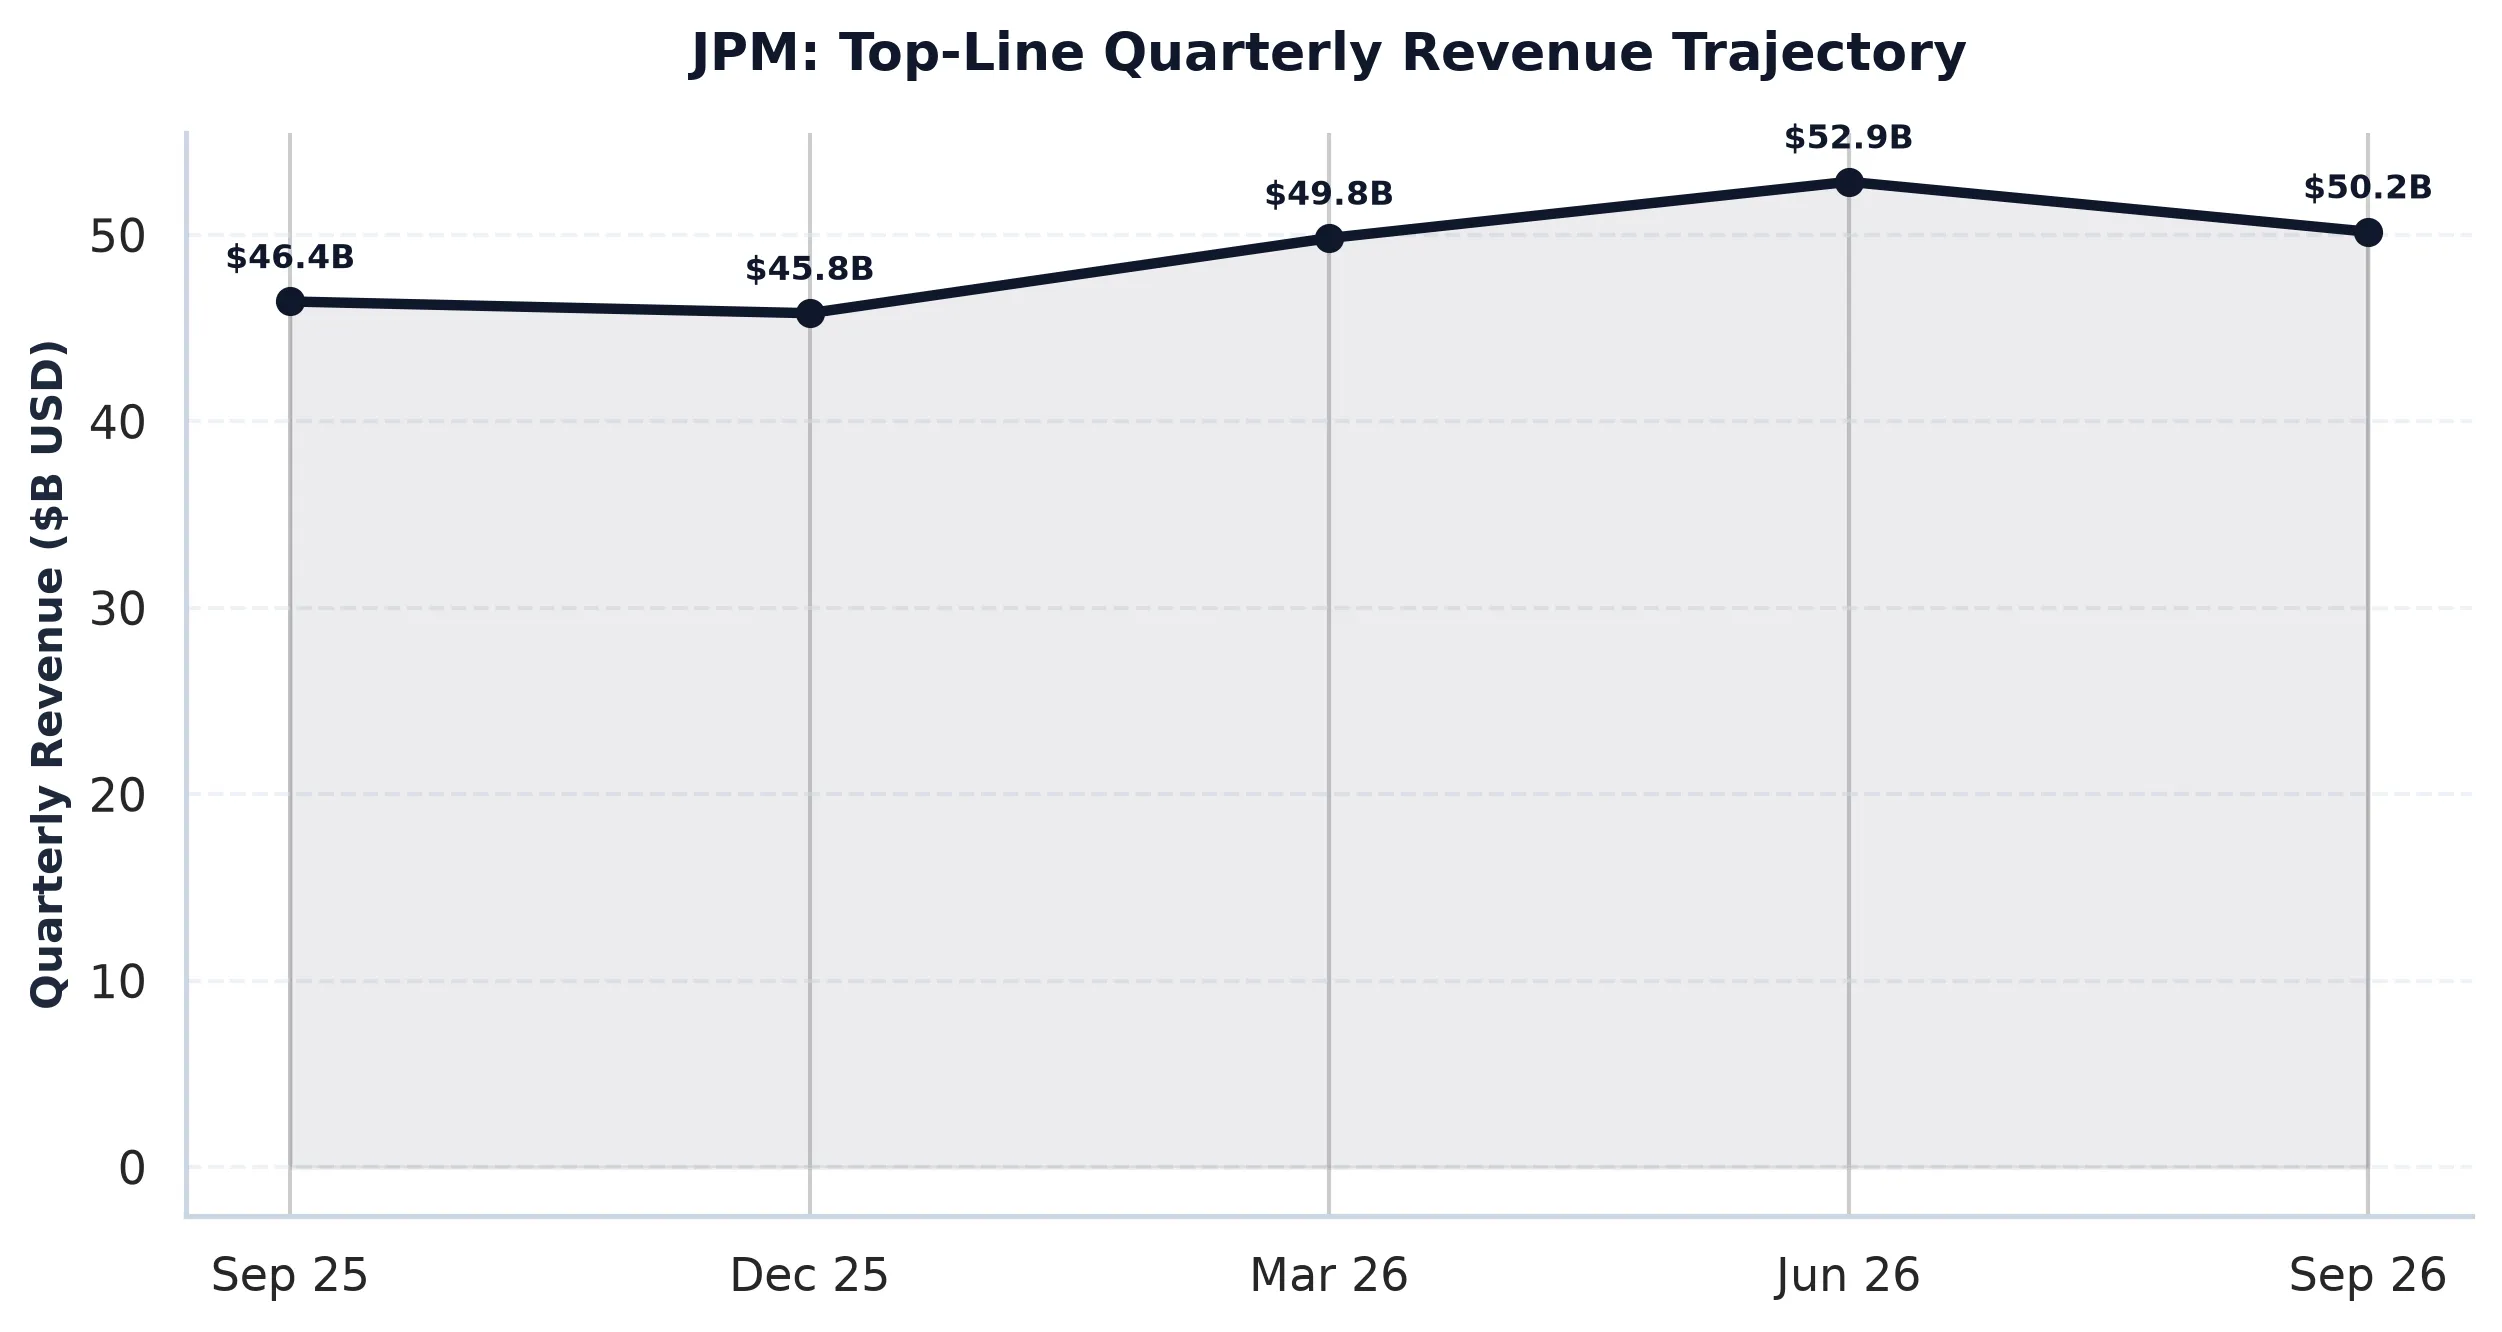
Multi-Year Financial Trajectory and Cash-Flow Mechanics
To understand JPMorgan Chase, you have to ignore the way people usually talk about Free Cash Flow (FCF). In a software company, negative FCF means you are burning investor money to buy ping-pong tables and cloud credits. In a bank, reported FCF of -$147.78 billion, as seen in the FY2025 trajectory, often simply means the bank is doing its job: lending money. When a bank grows its loan book or moves cash into securities, that shows up as an outflow. It is not “burning” cash; it is deploying it into interest-bearing assets.
The real metric to watch is the Return on Equity (ROE), which stands at a robust 18.01%. For a firm with nearly $900 billion in market capitalization, generating an 18% return on its equity base is a feat of industrial-scale compounding. The Return on Invested Capital (ROIC) of 67.49% is even more staggering, though it reflects the highly leveraged nature of a regulated depository institution. When your cost of capital (WACC) is roughly 8.5%, and you are generating returns far in excess of that, you are creating massive economic value.
The revenue trajectory from $127.73 billion in 2022 to $181.85 billion in 2025 shows a compound annual growth rate that would make many tech companies blush. More importantly, operating margins have expanded from 29.5% to 31.4% over the same period. This margin expansion occurred even as the bank invested $63.62 billion in capital expenditures, much of which goes toward a technology budget that exceeds the entire market cap of some regional competitors. JPMorgan Chase is effectively outspending the competition into submission.
Peer Relative Valuation and Competitive Moat
When we compare JPMorgan Chase to its peers, the “Fortress Premium” becomes immediately apparent. The bank trades at a Price to Book (P/B) ratio of 2.56x, which is a significant markup compared to the rest of the “Big Four.” This premium is not a mistake: it is a reflection of the bank’s diversified revenue streams. Unlike a pure-play investment bank or a pure-play commercial lender, JPMorgan Chase is a universal bank that wins regardless of the weather.
| Company (Ticker) | Market Cap | Forward P/E | EV/EBITDA | Rev Growth (YoY) | Operating Margin | FCF Yield |
|---|---|---|---|---|---|---|
| JPMorgan Chase & Co. (JPM) | $898.0B | 13.2x | N/A | 10.20% | 42.58% | -16.46% |
| Bank of America (BAC) | $345.1B | 9.7x | N/A | 3.4% | 31.3% | N/A |
| Goldman Sachs Group (GS) | $253.9B | 11.9x | N/A | 23.3% | 38.4% | N/A |
| Morgan Stanley (MS) | $288.2B | 13.5x | N/A | 10.8% | 39.9% | N/A |
As the table illustrates, Bank of America trades at a much cheaper 9.7x forward earnings, but it lacks the same operating efficiency, with a 31.3% margin compared to JPMorgan’s 42.58%. Goldman Sachs and Morgan Stanley are more comparable on a margin basis, but they are far more sensitive to capital market volatility. JPMorgan Chase provides the stability of a massive retail deposit base with the upside of an elite investment banking franchise. At 13.2x forward earnings, you are paying a fair price for a company that has essentially become too large and too efficient to fail.
The total shareholder yield of 5.81% is the final piece of the valuation puzzle. The bank returned $34.59 billion to shareholders through repurchases over the last year. In the world of high finance, a buyback yield of 3.85% on top of a nearly 2% dividend is the institutional equivalent of a steady heartbeat. It signals that management sees the stock as undervalued even as it trades near all-time highs.
Options Gamma Pinning, Risk Bounds and Verdict
The options market structure for JPMorgan Chase currently reflects a state of equilibrium. With a Put/Call Open Interest ratio of 1.0, there is no extreme speculative skew in either direction. The “Max Pain” strike at $340.00 acts as a magnetic anchor for the stock price. Dealers are currently in a “long gamma” position, which means they are likely to buy dips and sell rips, effectively dampening volatility and keeping the stock in a tight range between the $330 support wall and the $350 resistance wall.
The expected 30-day move of +/- 8.20% provides a wide enough envelope for the stock to absorb any further headline noise from the Senate probe without breaking the long-term bullish trend. The real risk is not a subpoena; it is a sudden, sharp downturn in the labor market that forces the Fed to cut rates aggressively, thereby crushing NII. However, with unemployment at 4.1% and job growth surging, that risk remains a theoretical outlier rather than a present danger.
JPMorgan Chase has spent the last decade building a moat out of capital, technology, and sheer scale. The current consensus is distracted by the ghost of Jeffrey Epstein and the theater of Washington. We prefer to focus on the 18% ROE and the $1.59 trillion in cash. The bank is the ultimate compounder in a “higher for longer” world, and the recent price dip is a gift for those who can distinguish between a headline and a balance sheet.
AllWallSt Investment Verdict: BUY
JPMorgan Chase & Co. (JPM)
Trailing P/E
Marcus Wolfe Screen
Leverage Profile
30D Channel
Dealer Gamma Pinning & Max Pain Alignment (JPM)
Banking liquidity & regulatory capital compliant (Basel III / CET1 governed); deposit & trading settlement flows normalized.
Tier 1 Regulatory Capital & Liquidity Coverage Ratio (LCR) compliant; balance sheet governed by Basel III capital buffers.
Evaluated against 5.10% US 10-Yr Benchmark; bank net interest margins sensitive to yield curve slope (2s10s spread) and deposit beta.
Max Pain: $340.00 (+0.57%) | P/C Ratio: 1.0 | 30D Channel: $310.43 – $365.87. Dealer gamma bounded between $320 Put Wall and $350 Call Wall.
JPM represents a core ~1.6% index pillar. Institutional managers face persistent benchmark drag if under-allocated during sector rallies, biasing sell-side consensus toward institutional overweight.
$313.60 – $326.40 (Options Support Pinning)
Sustained weekly close below $320.00 (Put Wall) or gross margin compression below 0.00%.
Sources & References
- Official SEC Form 10-K Annual Report (Filed 2026-02-13)
- Official SEC Form 10-Q Quarterly Report (Filed 2026-11-03)
- JPMorgan Chase & Co. Investor Relations: https://www.jpmorganchase.com
- SEC EDGAR Filings (CIK 0000019617): https://www.sec.gov/edgar/browse/?CIK=0000019617
- Reuters: US Job Growth Surges in October
- CNBC: Senate Probe into JPMorgan Epstein Ties
Regulatory Disclaimer: AllWallSt is a financial publisher, not an investment advisor. This analysis is for informational purposes only and does not constitute a recommendation to buy or sell any security. Banking institutions involve complex risks including interest rate sensitivity, credit risk, and regulatory changes. Past performance is not indicative of future results. Always consult with a certified financial professional before making significant capital allocations.