
The Goldman Sachs Group, Inc. (GS) is, among its many other identities, a very prestigious and incredibly expensive finishing school for people who eventually want to run a pod at a multi-manager hedge fund. This is a known feature of the ecosystem. Goldman hires the smartest graduates, trains them to endure eighty-hour weeks and the specific cadence of David Solomon’s PowerPoint expectations, and then, a few years later, a hedge fund offers them three times the salary to move across the street.
The news that aggressive buy-side firms are currently “attacking” Goldman’s talent pool is being treated by the market as a structural threat to margins. The logic is simple: if hedge funds are poaching your best people, you have to pay the ones who stay a lot more money to keep them from answering the phone. This pushes up the compensation-to-revenue ratio, which makes the equity analysts nervous. However, if you look at the actual mechanics of the business right now, this nervousness looks like a clerical error.
The Compensation Machine and the Revenue Engine
In the world of investment banking, “talent wars” are usually a lagging indicator of a very good environment for making money. People do not poach investment bankers when there are no deals to be done. The fact that the recruitment market is exploding suggests that the buy-side sees a massive pipeline of activity ahead.
According to recent filings, The Goldman Sachs Group, Inc. grew its revenue by 23.3% year-over-year, reaching over $71 billion. While the market focuses on the “war for talent” as a cost center, it is ignoring the operating leverage. Goldman’s operating margin stands at a robust 38.37%. For context, that is essentially in line with BlackRock (BLK) at 37.9% and only slightly behind the massive scale of JPMorgan Chase (JPM), which sits at 42.6%.
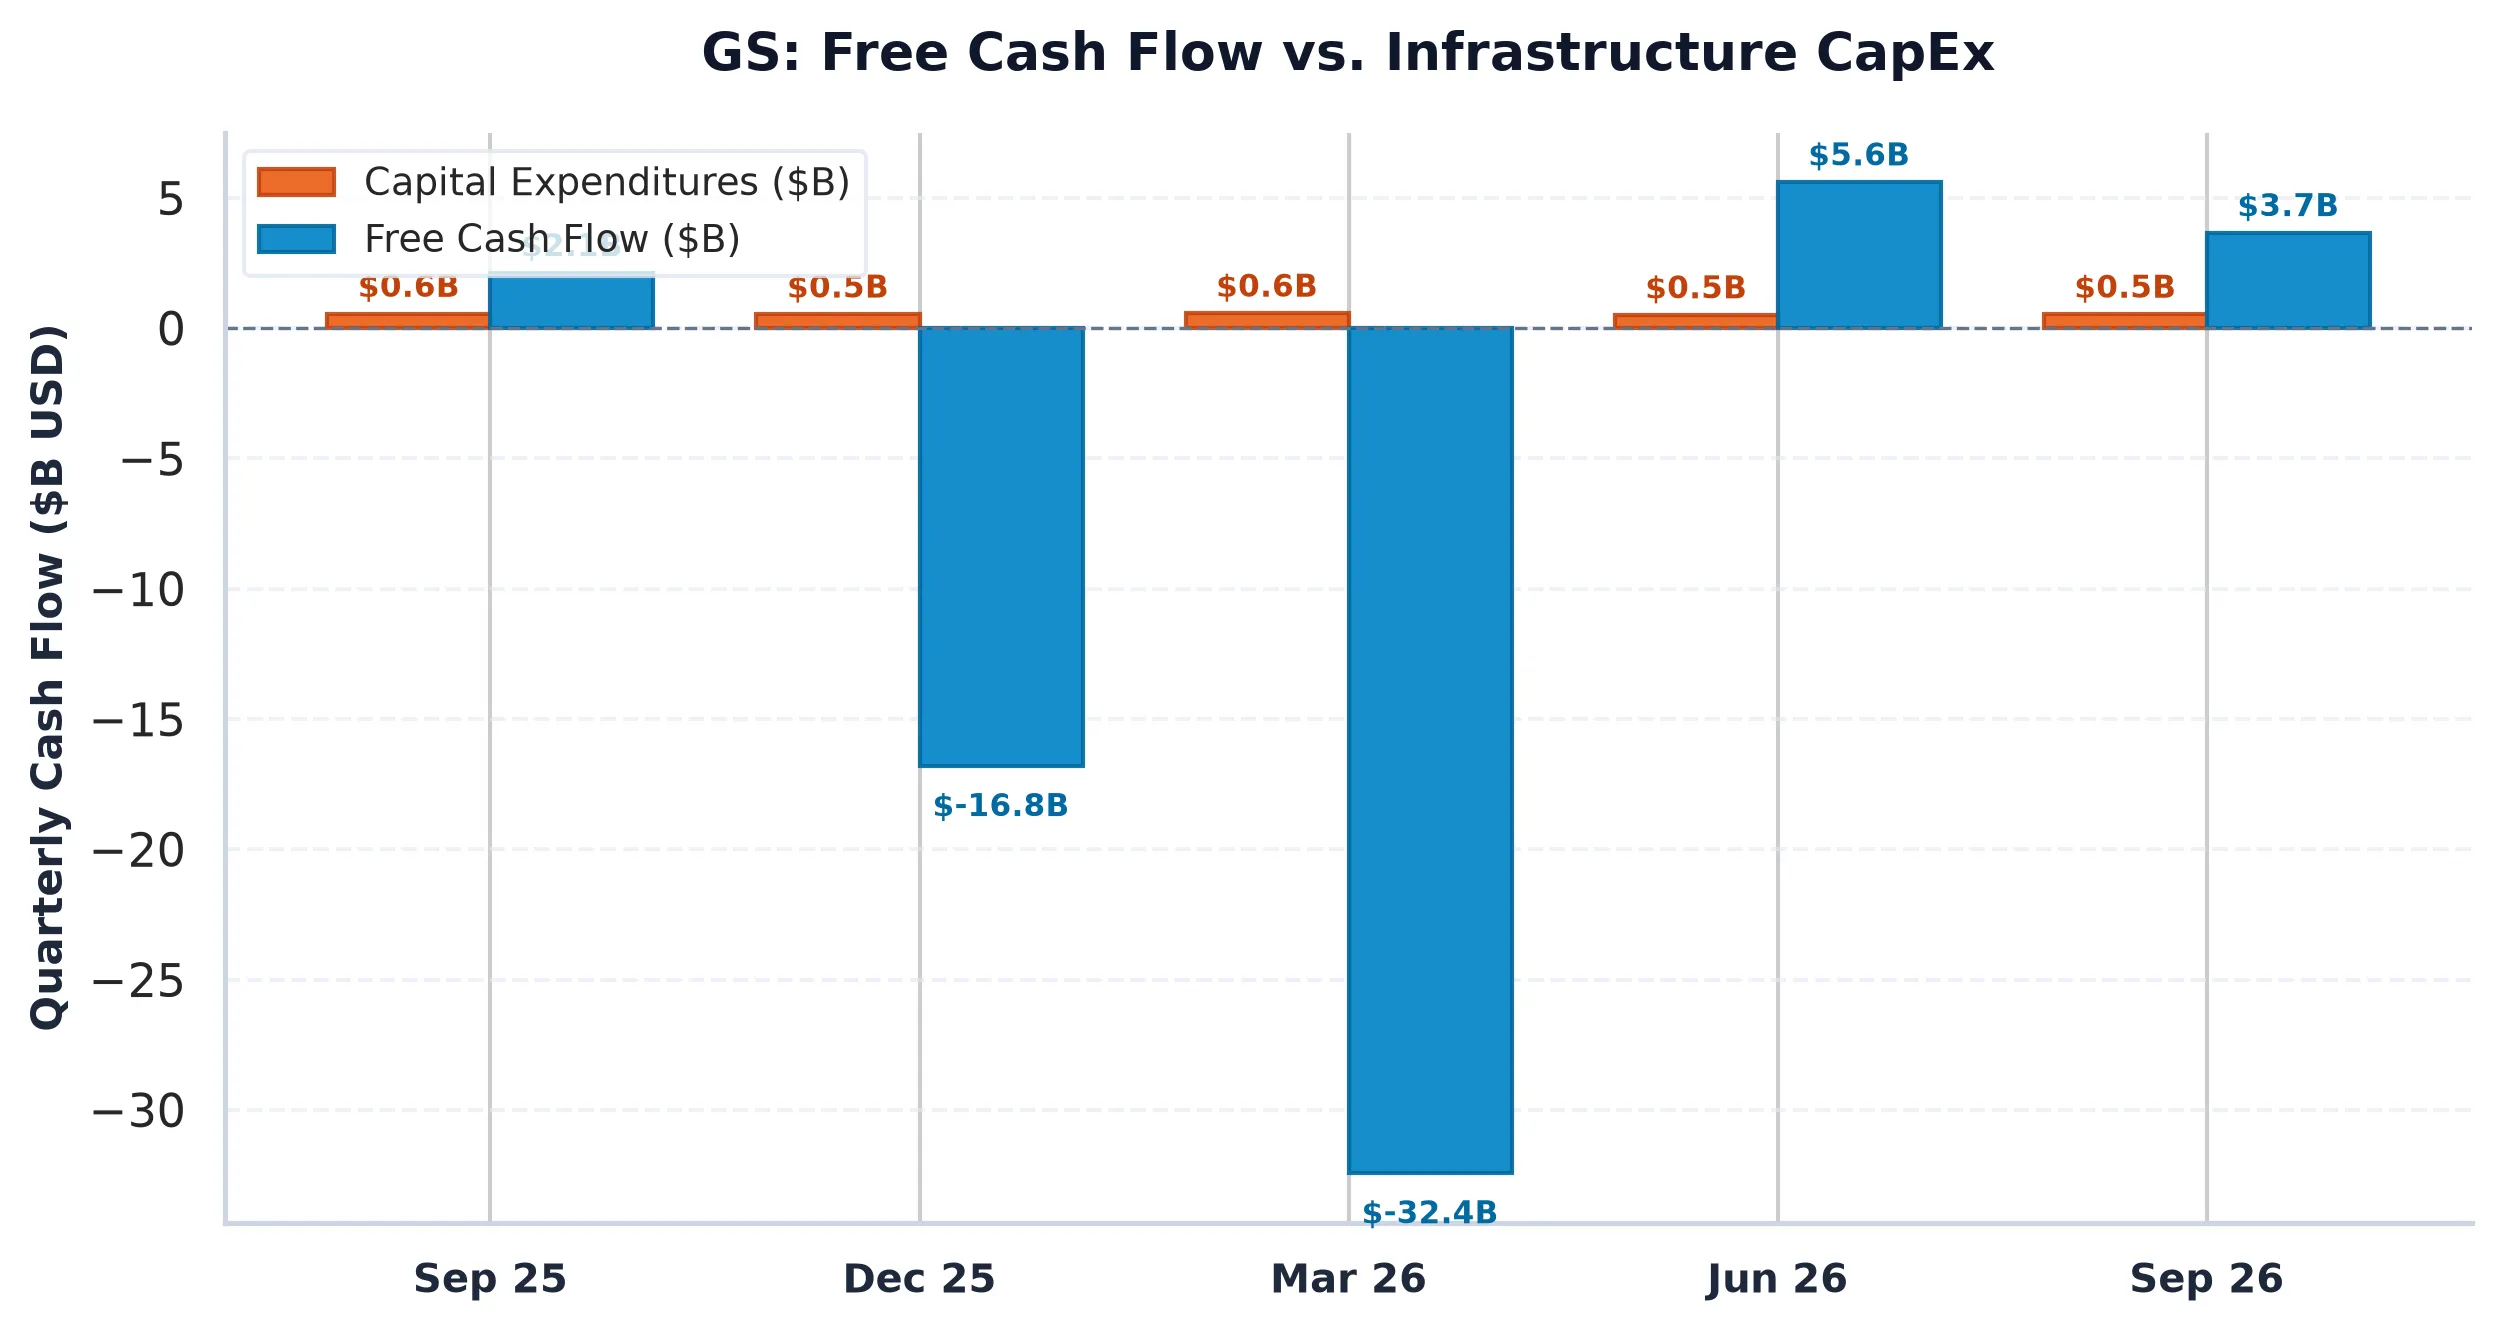
The real story in the 10-Q is not that Goldman is losing people, but that it is successfully pivoting back to its core identity as a capital markets powerhouse after the messy divorce from its consumer banking experiments. The company is generating a 17.7% return on equity (ROE), which is elite for a firm of this size. When you earn 17.7% on your capital, you can afford to pay your people enough to keep them from fleeing to a mid-sized hedge fund in Greenwich.
The Valuation Gap and Peer Realities
If we look at the peer group, the valuation of The Goldman Sachs Group, Inc. starts to look like a rounding error in its favor. GS currently trades at a forward P/E of 11.7x. Meanwhile, Morgan Stanley (MS) trades at 13.3x and JPMorgan Chase (JPM) sits at 13.1x.
The market is essentially charging Goldman a “volatility tax” because its earnings are more dependent on the whims of the capital markets than the steady interest income of a retail bank. But this tax is becoming excessive. Goldman is returning capital to shareholders at a rate that makes most of the S&P 500 look stingy. Between a 2.3% dividend and a 4.95% buyback yield, the total shareholder yield is 7.25%.
Compare that to the US 10-Year Treasury yield of approximately 5.10%. You are being paid a significant premium to own the premier brand in global finance while they buy back nearly 5% of their own stock every year. The “war for talent” might lead to a few billion more in stock-based compensation (SBC), which was $3.44 billion last year, but the $12.36 billion in share repurchases more than offsets that dilution.
The Quantitative Pin and Market Structure
From a market structure perspective, the options market is currently acting as a stabilizer for the share price. The current price of $865.82 is sitting comfortably below the “Max Pain” strike of $905. In the derivatives world, this $905 level acts as a magnetic anchor. As we approach expirations, dealer hedging often pulls the spot price toward that strike, suggesting a path of least resistance that is roughly 4.5% higher than current levels.
The Put/Call Open Interest ratio is 0.82, which is remarkably balanced for a stock that just saw a 6% decline. Institutional investors are not rushing to buy downside protection (puts), which implies they view the recent dip as a technical correction rather than the start of a fundamental collapse. The primary call resistance is up at $950, giving the stock plenty of room to run before it hits a structural ceiling.
Eighteen days ago, we held a neutral stance on Goldman at $882.35, citing concerns over balance sheet opacity. However, the latest 10-Q and the announcement of the 2026 Partner Class suggest a firm that is firing on all cylinders. The revenue growth is outstripping the peer group (23.3% for GS vs 10.8% for MS), and the valuation has compressed to a point where the risk-reward is heavily skewed to the upside.
AllWallSt Investment Verdict: BUY (Upgrade from HOLD)
The Goldman Sachs Group, Inc. (GS)
Trailing P/E
Marcus Wolfe Screen
Leverage Profile
30D Channel
Dealer Gamma Pinning & Max Pain Alignment (GS)
Banking liquidity & regulatory capital compliant (Basel III / CET1 governed); deposit & trading settlement flows normalized.
Tier 1 Regulatory Capital & Liquidity Coverage Ratio (LCR) compliant; balance sheet governed by Basel III capital buffers.
Evaluated against 5.10% US 10-Yr Benchmark; bank net interest margins sensitive to yield curve slope (2s10s spread) and deposit beta.
Max Pain: $905.00 (+4.53%) | P/C Ratio: 0.82 | 30D Channel: $772.83 – $958.81. Dealer gamma bounded between $880 Put Wall and $950 Call Wall.
GS carries standard index weighting (< 0.6% SPY footprint); sell-side consensus reflects standard earnings momentum rather than index-tracking mandates.
$862.40 – $897.60 (Options Support Pinning)
Sustained weekly close below $880.00 (Put Wall) or gross margin compression below 81.29%.
Sources & References
- Official SEC Form 10-K Annual Report (Filed 2026-02-25)
- The Goldman Sachs Group, Inc. Investor Relations: https://www.goldmansachs.com/investor-relations
- SEC EDGAR Filings for Goldman Sachs (CIK 0000886982): https://www.sec.gov/edgar/browse/?CIK=0000886982
- Latest Form 10-Q (Filed Nov 2, 2026): https://www.sec.gov/Archives/edgar/data/886982/000088698226000532/gs-20260930.htm
Regulatory Disclaimer: This article is provided for informational purposes only and does not constitute financial, investment, tax, or legal advice. The author and AllWallSt are not registered investment advisors. All investments involve risk, and past performance is not indicative of future results. Please consult with a qualified professional before making any investment decisions. All data is sourced from primary SEC filings and exchange feeds as of the date of publication.