
The AI Order Disconnect and the Margin of Reality
Cisco Systems, Inc. (CSCO) recently presented the market with a classic Rorschach test in its latest earnings cycle. On one hand, the company reported a staggering $9.3 billion in AI infrastructure orders, a figure that should, in theory, satisfy even the most ravenous growth investor. On the other hand, the stock experienced a violent 9% plunge toward the $112 level, and has since settled near $93.85. This price action suggests that the market is no longer willing to take top-line AI promises at face value when they come wrapped in the traditional packaging of a legacy hardware giant.
The tension here is not about whether Cisco can sell switches to hyperscalers. It clearly can. The tension lies in what it costs the company to generate that growth and how much of the resulting cash actually makes it into the pockets of common shareholders. When a company growing revenue at 17.6% sees its stock sold off, the market is usually pointing at the plumbing. In Cisco’s case, the plumbing is a complex system of stock-based compensation (SBC) and massive share repurchases that appear, upon forensic inspection, to be largely neutralizing one another.
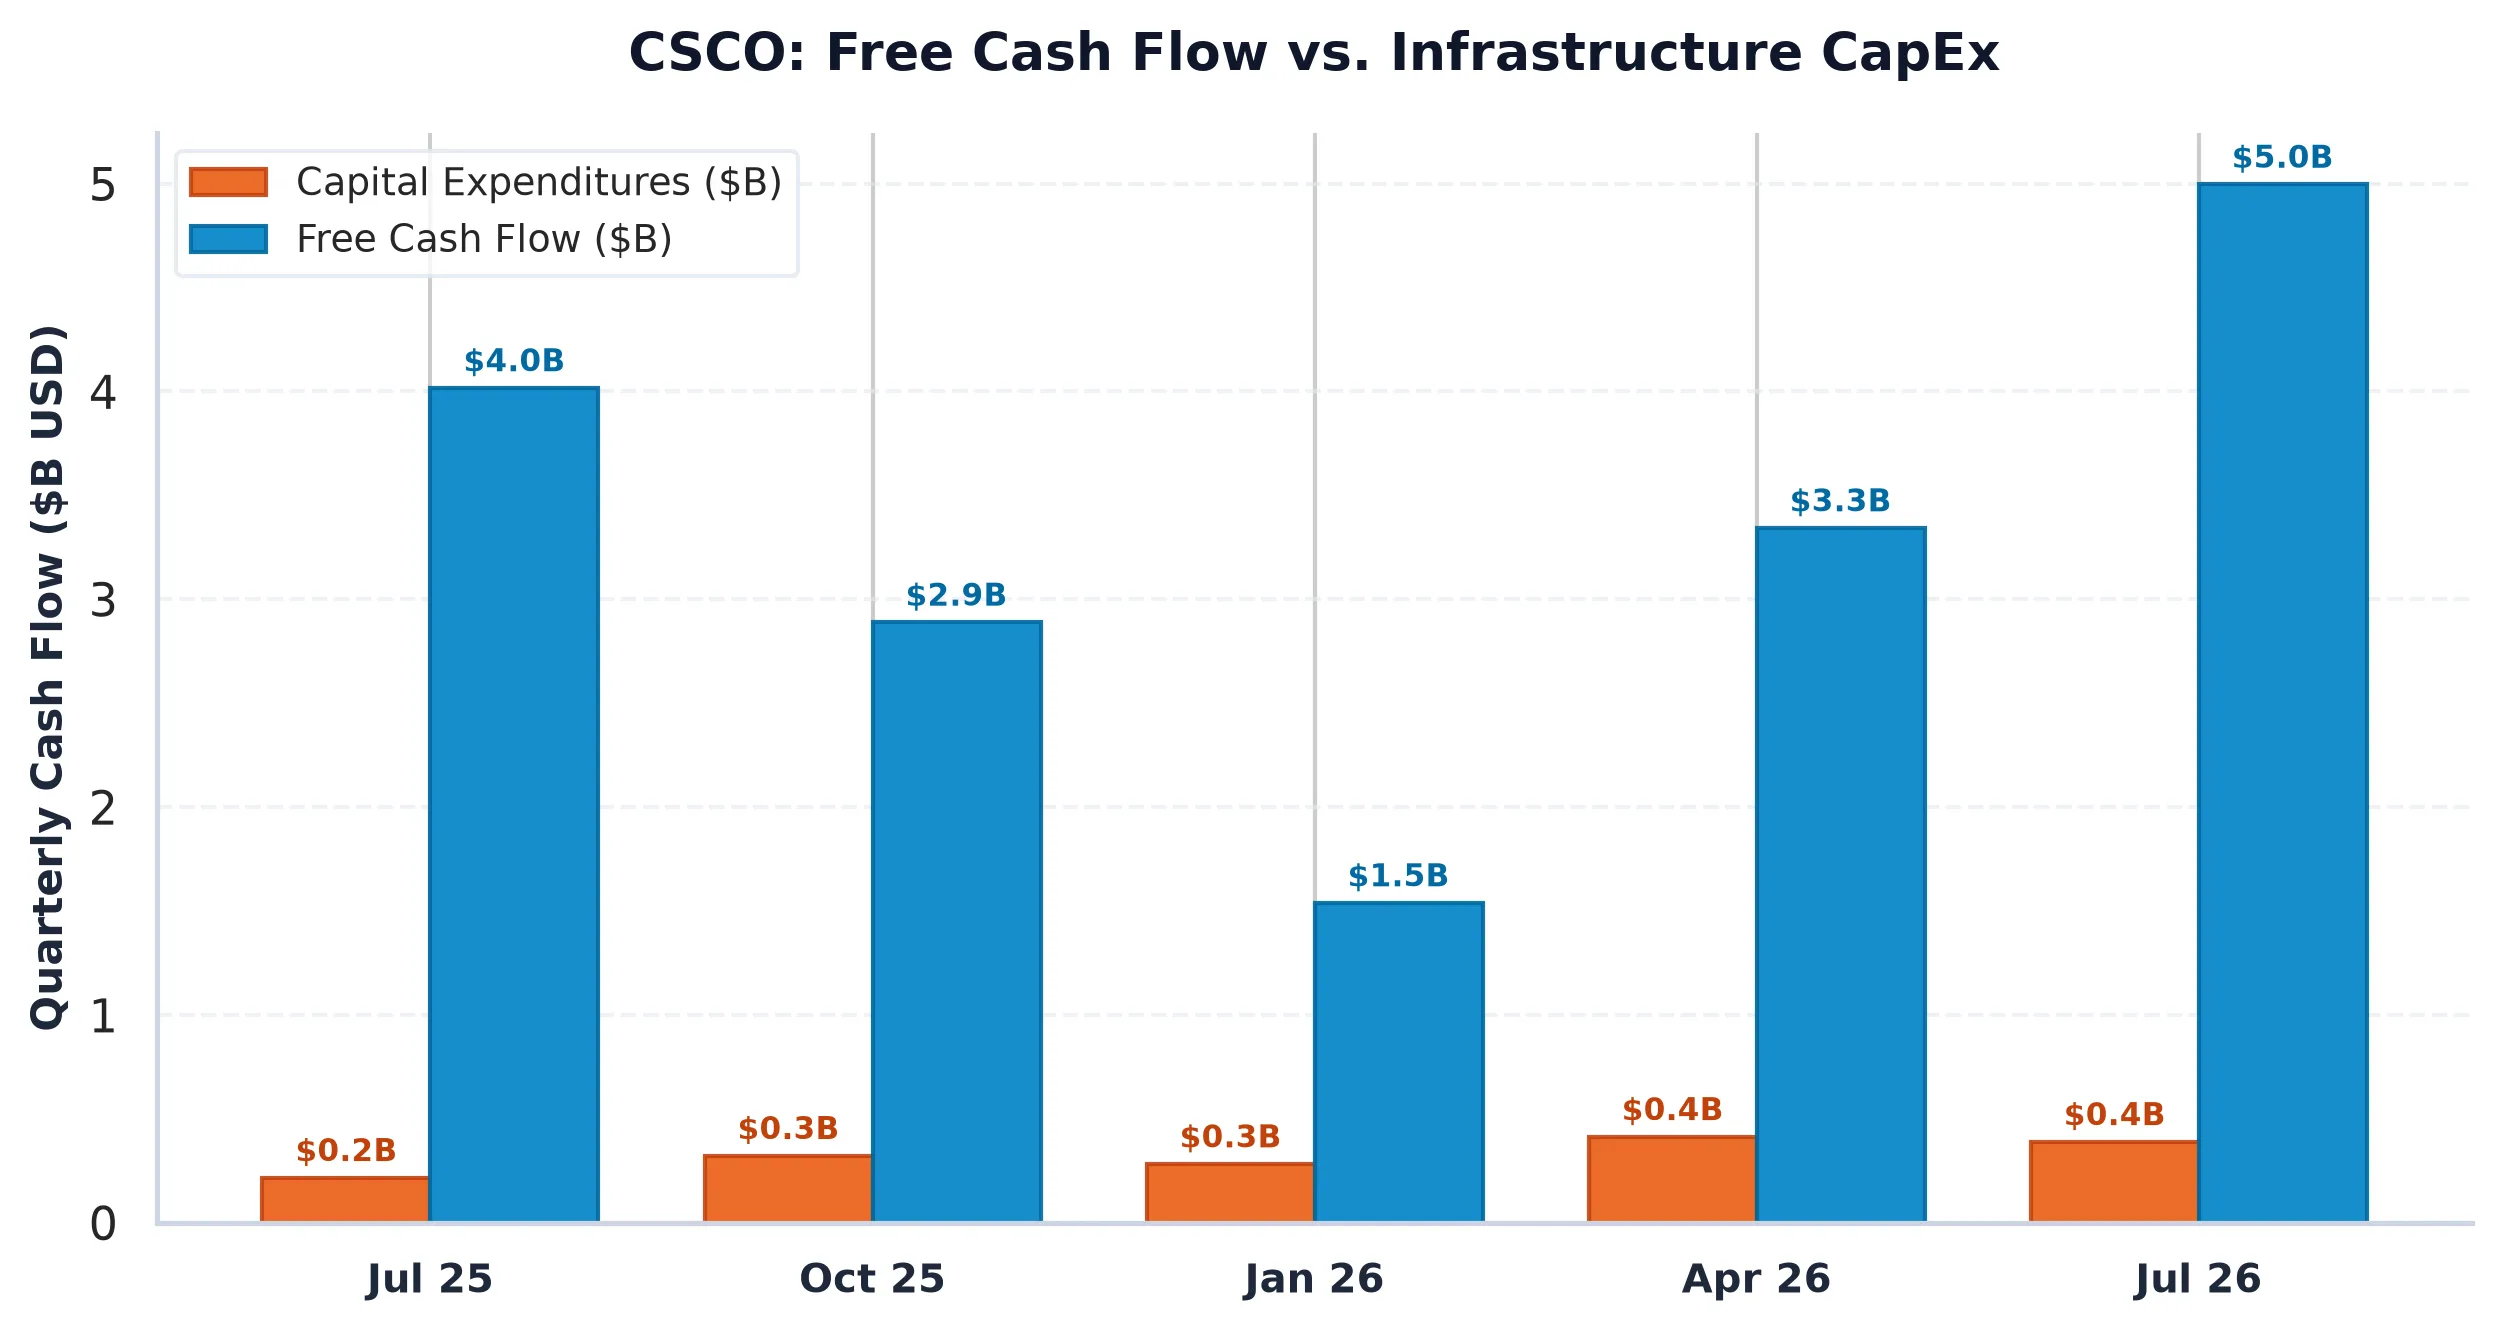
Operating in a macro environment where the 10-Year Treasury yield sits at a formidable 5.10%, the hurdle for equity risk has shifted. Investors are no longer comparing Cisco to its own 2019 multiples: they are comparing its free cash flow yield to the risk-free rate. With a reported free cash flow (FCF) yield of 3.02%, Cisco is already trading at a negative spread to sovereign debt. When you strip away the billions in stock given to employees, that yield drops to an even more precarious 1.99%. This is the fundamental gravity that no amount of AI order excitement can easily overcome.
The Forensic Audit: SBC Sterilization and Capital Velocity
To understand Cisco’s capital allocation, one must look at the relationship between its share buyback program and its compensation structure. In the 2026 fiscal year, Cisco Systems, Inc. deployed $7.98 billion into share repurchases. In a vacuum, this looks like a robust return of capital. However, during the same period, the company recognized $3.83 billion in stock-based compensation expense.
This means that approximately 48% of the cash sent out the door to buy back shares was not actually reducing the share count to benefit long-term holders. Instead, it was effectively a cash recycling program designed to soak up the dilution created by executive and employee equity grants. We call this “sterilization.” While it prevents the share count from exploding, it is a far less efficient use of capital than a buyback program in a company with disciplined equity incentives. When SBC represents 27% of your operating cash flow, you are effectively running a very expensive staffing agency that happens to sell high-end networking gear.
| Period | Revenue | Operating Income | Operating Margin | Free Cash Flow | SBC Expense |
|---|---|---|---|---|---|
| FY2023 | $57.00B | $15.56B | 27.3% | $19.04B | $2.35B |
| FY2024 | $53.80B | $12.97B | 24.1% | $10.21B | $3.07B |
| FY2025 | $56.65B | $12.50B | 22.1% | $13.29B | $3.64B |
| FY2026 | $63.33B | $16.06B | 25.4% | $12.77B | $3.83B |
The multi-year trajectory reveals a concerning trend in capital efficiency. While revenue has grown from $57 billion in 2023 to over $63 billion in 2026, free cash flow has actually contracted from $19.04 billion to $12.77 billion over the same period. Meanwhile, SBC expense has ballooned by 63% in three years. This divergence suggests that Cisco is working harder, and paying its people significantly more in equity, to produce less actual cash for the business. The Rule of 40 score of 35.3% is respectable, but it is being propped up by a recent revenue surge that has yet to translate into the high-margin flow-through that investors expect from a dominant platform.
Peer Relative Valuation and the Cost of Complexity
When we benchmark Cisco Systems, Inc. against its peers in the enterprise and cloud infrastructure space, the valuation narrative becomes even more complex. On a forward P/E basis, Cisco looks like a value play at 16.7x, especially when compared to Microsoft or Alphabet. However, the enterprise value to EBITDA multiple of 20.7x tells a different story: one of a company that is being priced like a growth utility but delivering the cash flow profile of a mature industrial.
| Company (Ticker) | Market Cap | Forward P/E | EV/EBITDA | Rev Growth (YoY) | Operating Margin | FCF Yield |
|---|---|---|---|---|---|---|
| Cisco Systems (CSCO) | $370.0B | 16.7x | 20.7x | 17.60% | 27.72% | 3.02% |
| Microsoft (MSFT) | $3.94T | 21.9x | 19.5x | 18.8% | 49.8% | 0.08% |
| Alphabet (GOOGL) | $3.50T | 18.5x | 18.4x | 24.7% | 31.8% | -0.03% |
| Oracle (ORCL) | $362.0B | 10.5x | 14.2x | 29.6% | 35.6% | -12.67% |
Oracle, a direct competitor in the race for enterprise AI backbones, is growing revenue at nearly 30% while trading at a significantly lower forward P/E of 10.5x. While Oracle’s negative FCF yield reflects its own massive CapEx cycle, it highlights the competitive pressure on Cisco. Cisco’s operating margin of 27.72% is healthy, but it lags the elite software-centric margins of Microsoft (49.8%) and even the hardware-heavy Oracle (35.6%).
The primary risk for Cisco is that it remains caught in the “middle child” of tech valuations: not cheap enough to be a deep-value turnaround, yet not growing fast enough to justify its current enterprise multiples given the rising cost of capital. The net debt to EBITDA ratio of 0.82x is low, providing a solid balance sheet cushion, but in a world of 5.10% risk-free returns, a solid balance sheet is a prerequisite, not a catalyst. The market is demanding a clearer path to margin expansion that isn’t immediately consumed by the compensation pool.
Options Market Structure and the Gamma Ceiling
As we look toward the near-term price action, the options market structure for Cisco Systems, Inc. suggests a period of consolidation. The Put/Call open interest ratio of 0.67 indicates a prevailing bullish sentiment among retail and institutional speculators, but the “Max Pain” strike at $106.00 sits nearly 13% above the current spot price. In the mechanical world of dealer hedging, this creates a magnetic pull toward the upside, but it is countered by formidable Call Walls at $110 and $115.
The implied volatility (IV) of 71.31% is exceptionally high for a mature networking company, implying that the market expects a 30-day move of roughly 20% in either direction. This level of volatility typically precedes a period of “gamma pinning,” where dealers sell into rallies and buy into dips to maintain neutrality, effectively trapping the stock in a range. With the primary Put Support Wall sitting at $80 and $95, the downside appears protected by institutional hedging, but the path to $110 is cluttered with supply.
The fundamental reality remains that Cisco is a high-quality business undergoing a difficult transition. It is successfully capturing AI-related orders, but it is doing so at the cost of its margin profile and through a compensation structure that penalizes the common shareholder. Until the company can demonstrate that its $9.3 billion in AI orders can flow through to free cash flow without being diverted into SBC or offset by the sovereign yield hurdle, the stock is likely to remain range-bound. We see no immediate catalyst for a breakout that would justify an aggressive buy at these levels, nor do we see a balance sheet collapse that would warrant a sell.
AllWallSt Investment Verdict: HOLD
Cisco Systems, Inc. (CSCO)
Trailing P/E
Marcus Wolfe Screen
Leverage Profile
30D Channel
Dealer Gamma Pinning & Max Pain Alignment (CSCO)
MODERATE WATCHLIST (1 flag): Inventory growth outpaced COGS growth by >15%, signaling potential inventory bloat or pending margin compression.
Prudent Leverage (0.82x Net Debt/EBITDA); well within investment-grade covenant headroom.
Negative yield spread (-1.84% vs 5.10% Treasury); equity requires robust multiple expansion or growth.
Max Pain: $106.00 (+12.95%) | P/C Ratio: 0.67 | 30D Channel: $74.67 – $113.03. Dealer gamma bounded between $80 Put Wall and $110 Call Wall.
CSCO represents a core ~0.7% index pillar. Institutional managers face persistent benchmark drag if under-allocated during sector rallies, biasing sell-side consensus toward institutional overweight.
Accumulation Deferred (Await Pullback toward $78.40 – $81.60 Support Pinning)
Sustained weekly close below $80.00 (Put Wall) or acceleration in margin compression.
Sources & References
- Official SEC Form 10-Q Quarterly Report (Filed 2026-05-19)
- Cisco Systems, Inc. SEC EDGAR Filings: https://www.sec.gov/edgar/browse/?CIK=0000858877
- Cisco Investor Relations: https://www.cisco.com/c/en/us/about/investor-relations.html
- SEC Form 10-K (Filed 2026-09-02): https://www.sec.gov/Archives/edgar/data/858877/000085887726000132/csco-20260725.htm
- SEC Form 8-K (Earnings Release 2026-08-12): https://www.sec.gov/Archives/edgar/data/858877/000085887726000106/csco-20260812.htm
Regulatory Disclaimer: This report is for informational purposes only and does not constitute financial, legal, or investment advice. AllWallSt and its analysts are not registered investment advisors. All equity investments carry significant risk, including the potential loss of principal. Quantitative metrics and options data are subject to rapid market changes and should be verified independently before making any investment decisions. Historical performance is not indicative of future results.