
The Core Thesis and Market Dislocation
If you are a regulated utility, your primary goal in life is usually to be as boring as humanly possible. You want to provide a service so essential and so predictable that investors treat your stock like a bond with a slightly better personality. Constellation Energy Corporation (CEG) has spent the last year doing the exact opposite. By pivoting into the epicenter of the artificial intelligence boom through nuclear power co-location deals, the company has transformed from a sleepy power generator into a high-beta proxy for the future of the American data center.
This week, the market reminded Constellation Energy that being exciting comes with a price. The stock fell 9% following a midterm election sweep that left investors sweating over the future of federal energy subsidies and the regulatory mood at the Federal Energy Regulatory Commission (FERC). When you trade at a forward P/E of 18.7x in a sector where 12x is often the ceiling, you are not being priced on your ability to keep the lights on in Baltimore. You are being priced on the hope that hyperscalers like Microsoft will pay a massive premium for carbon-free, 24/7 nuclear baseload power.
The current dislocation is palpable. While the S&P 500 hovered near all-time highs this Friday, Constellation Energy sat in a localized deep freeze, trading at $249.95. This is a sharp reversal from the euphoria we saw just a month ago. However, the options market is beginning to signal that the selling might be exhausted. With a Put/Call open interest ratio of 1.71, the “bearishness” has become so crowded that it is starting to look like a coiled spring.
Financial Trajectory and the Cash Flow Puzzle
To understand Constellation Energy, you have to look past the reported earnings and into the cavernous gap between its net income and its free cash flow. In the 2024 fiscal year, the company reported operating income of $4.85 billion, a massive jump from the operating loss it posted in 2022. On the surface, this is a spectacular turnaround. But if you look at the 2026 projections and recent 10-Q filings, you will see a free cash flow figure of negative $6.6 billion.
Where is the money going? It is being poured into the ground. Constellation Energy is currently running a capital expenditure program of $10.83 billion, representing a CapEx intensity of 34.6%. For context, most companies would be considered “high growth” if they spent 10% of revenue on CapEx. Constellation is spending more than a third of its top line to upgrade its fleet and prepare for the massive power demands of the next decade.
This creates a fascinating tension. The company’s Return on Invested Capital (ROIC) sits at a modest 3.83%, which is well below its estimated weighted average cost of capital (WACC) of roughly 8.5%. In a traditional valuation model, a company that earns less on its capital than it costs to raise that capital is “destroying value.” But the market is betting that the ROIC on these new investments, specifically the nuclear restart projects and co-location agreements, will be far higher than the legacy fleet. Our previous SELL thesis on October 9 was built on the idea that this “Nuclear Tollbooth” was an illusion. However, the recent 9% drawdown has significantly de-risked the entry point, bringing the valuation back to a level where the growth in operating margins (which climbed from -1.7% in 2022 to over 20% in 2024) can actually support the stock price.
Peer Relative Valuation and the Competitive Moat
Constellation Energy does not operate in a vacuum. It competes for capital against other independent power producers and massive regulated utilities. When we look at the peer group, the divergence in strategy becomes clear. While NextEra Energy (NEE) focuses on the broad build-out of renewables, Constellation has cornered the market on existing nuclear capacity, which is a much rarer and more reliable asset for data center operators who cannot afford for the sun to go down or the wind to stop blowing.
| Company (Ticker) | Market Cap | Forward P/E | EV/EBITDA | Rev Growth (YoY) | Operating Margin | FCF Yield |
|---|---|---|---|---|---|---|
| Constellation Energy (CEG) | $88.6B | 18.7x | 14.2x | 23.00% | 8.66% | -7.48% |
| Vistra (VST) | $42.3B | 13.2x | N/A | 27.7% | 31.1% | N/A |
| NRG Energy (NRG) | $18.6B | 8.4x | 13.1x | 11.0% | 12.8% | 4.16% |
| NextEra Energy (NEE) | $182.4B | 19.9x | 22.7x | 1.6% | 33.0% | -11.63% |
As the table demonstrates, Constellation Energy trades at a slight discount to NextEra on a forward P/E basis (18.7x vs 19.9x) despite having significantly higher year over year revenue growth (23% vs 1.6%). Vistra (VST) remains the “cheap” alternative in the space, but it lacks the same pure-play nuclear scale that Constellation commands. The negative free cash flow yield of -7.48% is the primary reason the stock isn’t trading at 30x earnings. Investors are essentially being asked to fund a multi-billion-dollar infrastructure project in exchange for a dominant position in the 2030 energy market. Given the structural deficit in US power generation, that is a trade that looks increasingly attractive after the recent sell-off.
Options Gamma Pinning and the Path to $270
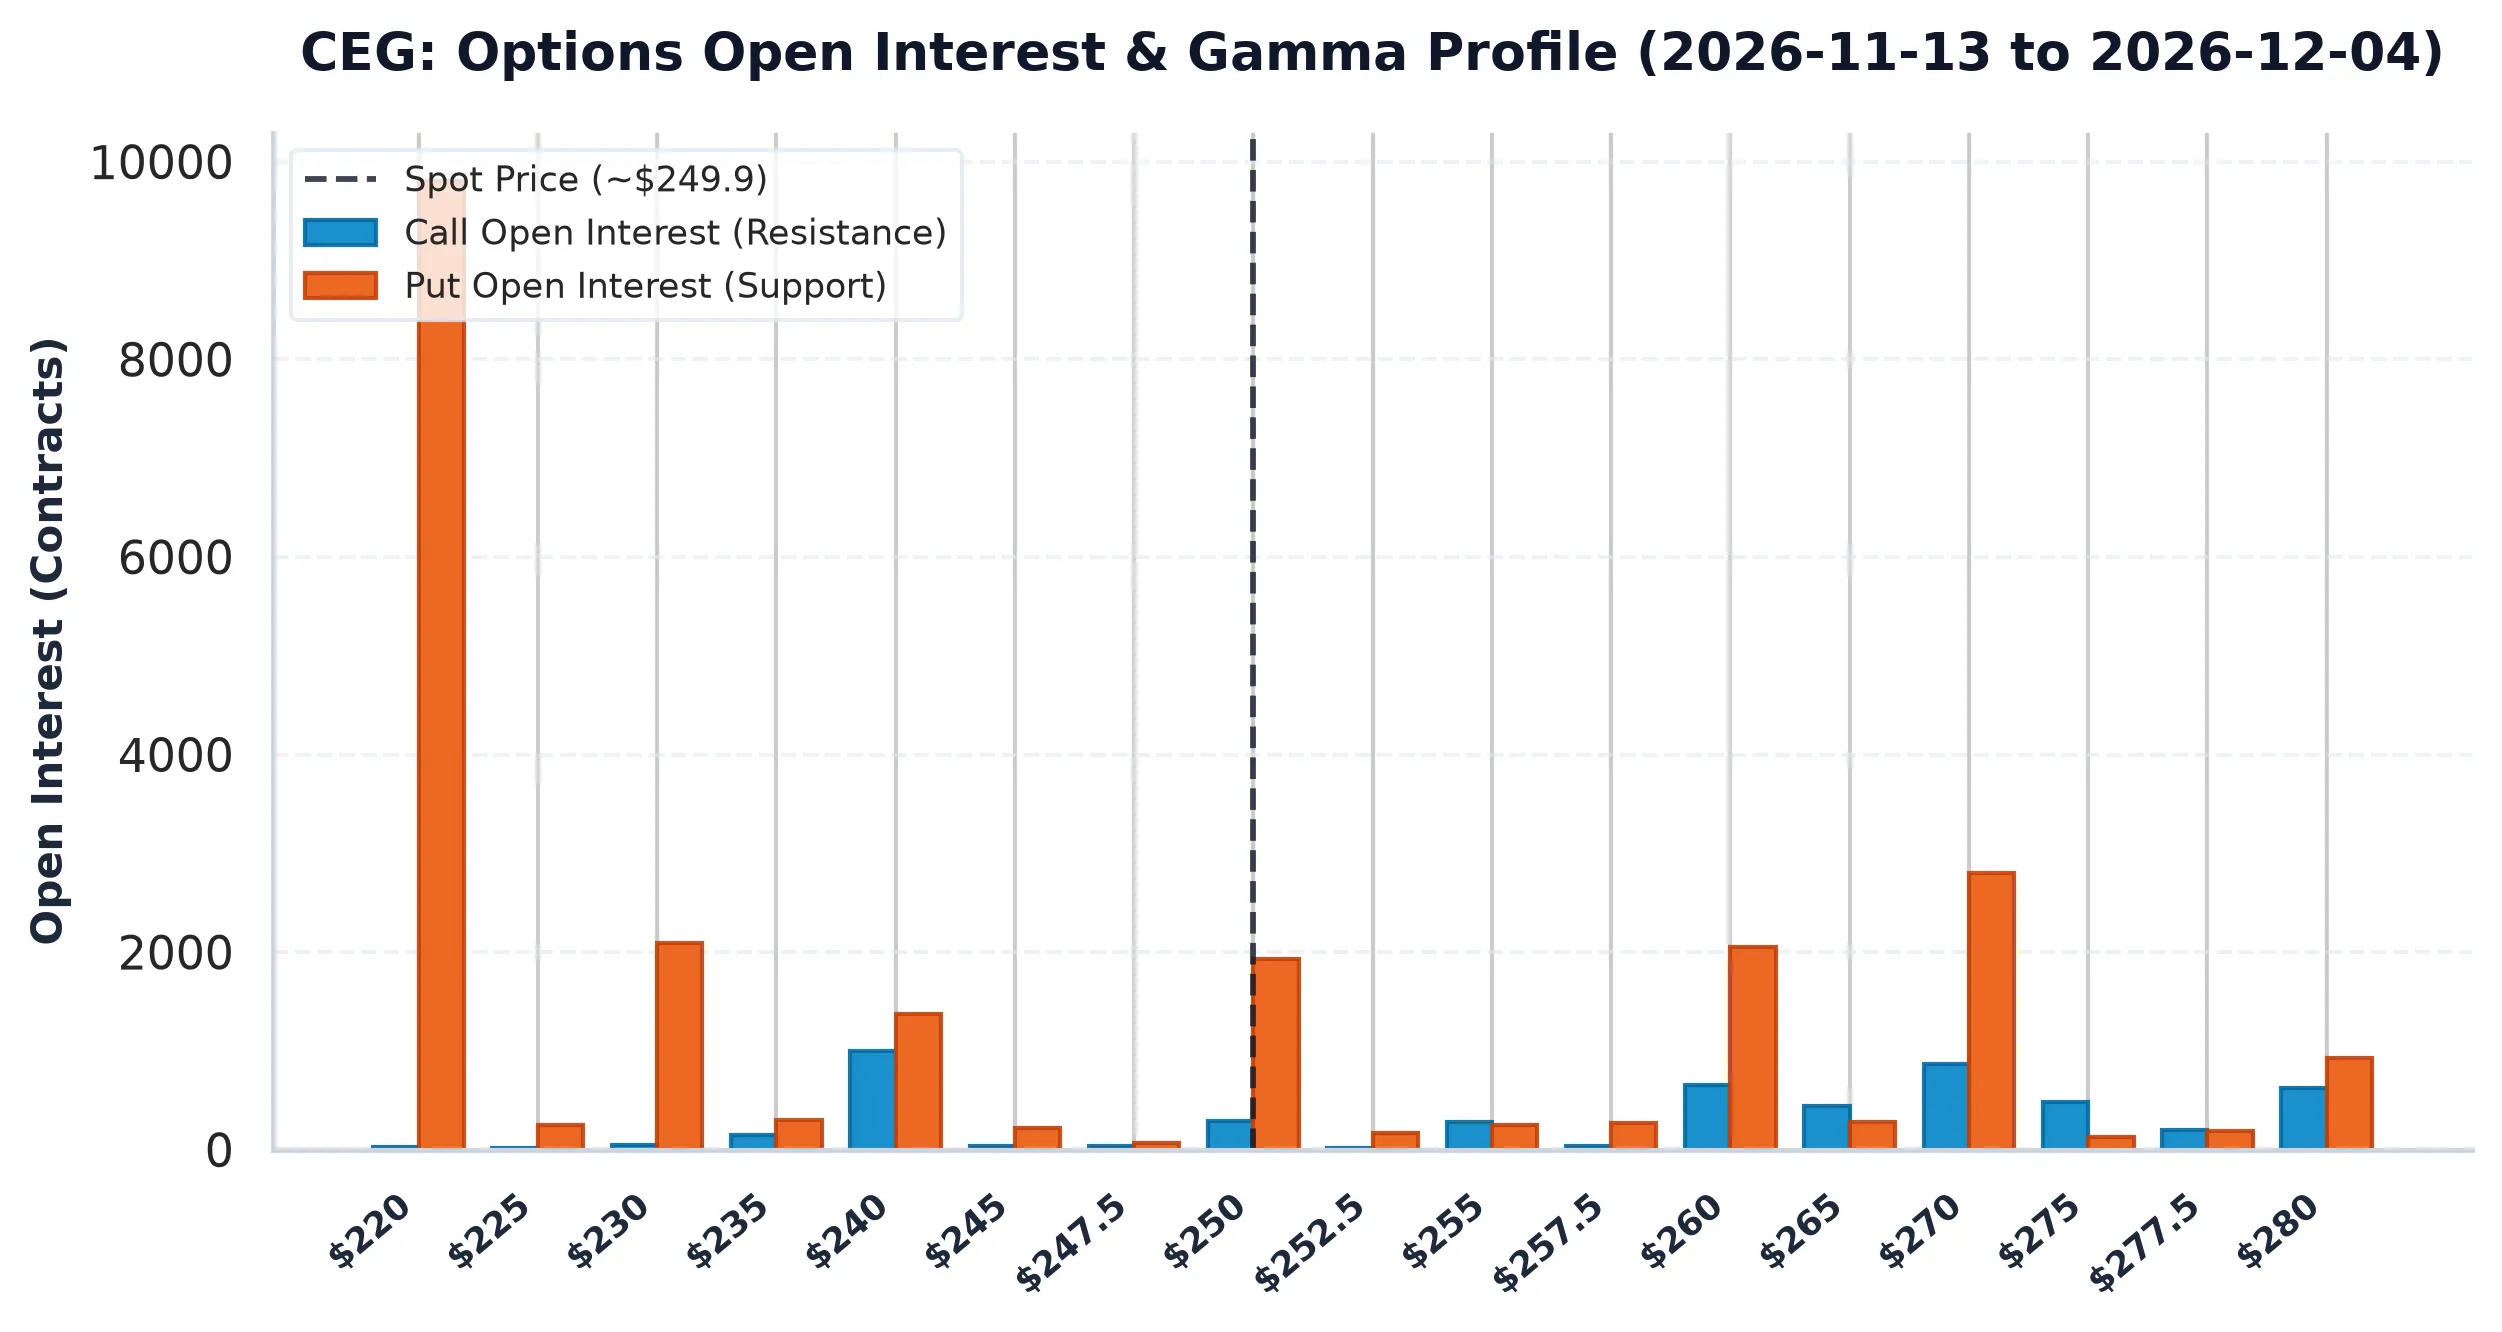
The most interesting part of the Constellation Energy story right now isn’t the balance sheet, it is the market structure. As we head into the Q3 earnings report on November 9, the options market is heavily skewed. The Put/Call ratio of 1.71 indicates that the majority of market participants are either hedging for a disaster or betting on a further collapse.
In the world of dealer gamma, this is a “short-covering” setup waiting to happen. When there are significantly more puts than calls, market makers who sold those puts are “long” the stock to hedge their position. If the stock starts to move up, or if the implied volatility (which is currently at a high 62.4%) begins to contract, these dealers will no longer need their hedges. This can create a mechanical bid for the stock that has nothing to do with whether the company beat its EPS estimate.
The “Max Pain” strike for the upcoming expirations is $270. This is the price level where the maximum number of options contracts expire worthless, and it often acts as a magnetic anchor for the stock price. Currently, Constellation Energy is trading nearly 8% below this level. With primary put support sitting at $220 and $210, the downside appears structurally protected by massive institutional “walls,” while the path to $270 is relatively clear of major call resistance until the $290 level.
The market has spent the last week panicking about political shifts, but the physical reality of the power grid remains unchanged. We need more electricity, and Constellation Energy has the reactors to provide it. The recent 9% drop has turned a “priced for perfection” story into a “priced for a reasonable recovery” story. We are moving from the sidelines to the buy side.
AllWallSt Investment Verdict: BUY (Upgrade from SELL)
Constellation Energy Corporation (CEG)
Trailing P/E
Marcus Wolfe Screen
Leverage Profile
30D Channel
Dealer Gamma Pinning & Max Pain Alignment (CEG)
Pristine cash flow conversion (1.83x) and healthy accrual ratio (-3.35%). Zero accounting anomalies detected (LOW ANOMALY RISK).
Moderate Leverage (3.02x Net Debt/EBITDA); manageable through operating cash generation.
Negative yield spread (-12.34% vs 5.10% Treasury); equity requires robust multiple expansion or growth.
Max Pain: $270.00 (+8.02%) | P/C Ratio: 1.71 | 30D Channel: $205.23 – $294.67. Dealer gamma bounded between $220 Put Wall and $330 Call Wall.
CEG carries standard index weighting (< 0.6% SPY footprint); sell-side consensus reflects standard earnings momentum rather than index-tracking mandates.
$215.60 – $224.40 (Options Support Pinning)
Sustained weekly close below $220.00 (Put Wall) or gross margin compression below 22.11%.
Sources & References
- Constellation Energy Corporation Investor Relations: https://www.constellationenergy.com
- SEC EDGAR Search Results for Constellation Energy (CIK 0001868275): https://www.sec.gov/edgar/browse/?CIK=0001868275
- Constellation Energy Form 10-K (Filed February 24, 2026): https://www.sec.gov/Archives/edgar/data/1868275/000186827526000032/ceg-20251231.htm
- Constellation Energy Form 10-Q (Filed August 6, 2026): https://www.sec.gov/Archives/edgar/data/1868275/000186827526000104/ceg-20260630.htm
Regulatory Disclaimer: This report is for informational purposes only and does not constitute financial, investment, or legal advice. The analysis is based on public filings and market data available as of the date of publication. All investments involve risk, including the potential loss of principal. AllWallSt is not a registered investment advisor or broker-dealer. Past performance is not indicative of future results. Standard market volatility applies to all securities mentioned.