
The fundamental problem with being a “metal of the future” is that the future is notoriously expensive to build, especially when the present charges you 4.86 percent just to sit on your hands. Freeport-McMoRan Inc. (FCX) finds itself in this exact structural bind. As global markets prepare for a week dominated by Core PCE prints and the relentless gravity of a 4.86 percent 10-Year Treasury yield, the world’s largest publicly traded copper producer is asking investors to look past the immediate math of the bond market and focus on the industrial plumbing of the energy transition.
The news that Freeport-McMoRan might spend 4.5 billion dollars on its Bagdad mine expansion in Arizona is, in a vacuum, a triumph of long-term industrial planning. It is the kind of capital allocation that makes sense if you believe that the electrification of everything is an inevitability and that copper supply is a ticking time bomb. However, we do not live in a vacuum. We live in a world where the risk-free rate of return has fundamentally re-priced the cost of duration. When a company spends 4.5 billion dollars on a project that will take years to reach full capacity, it is essentially shorting the dollar and longing the scarcity of physical atoms.
The Core Thesis and Market Dislocation
The market currently treats Freeport-McMoRan as a hybrid between a traditional industrial miner and a high-duration technology play. This is a dangerous middle ground. At a current price of 59.42 dollars, the stock carries a forward P/E of 14.0x. While that might look cheap compared to the software sector, it looks remarkably optimistic when you realize the company’s Free Cash Flow (FCF) yield is a mere 2.19 percent. To put that in perspective, the spread between Freeport-McMoRan’s cash yield and the 10-Year Treasury is a negative 2.67 percent. Investors are effectively paying a premium for the privilege of owning a volatile commodity producer that generates less cash per dollar than a boring government bond.
This dislocation is driven by the narrative of the “Great Copper Deficit.” The logic is simple: data centers need power, power needs wires, and wires need copper. Recent news of institutional buying by Candriam S.C.A. suggests that some big money is still willing to pay that narrative premium. Yet, the materials sector has been an index laggard, with the XLB ETF sliding 0.73 percent recently. Freeport-McMoRan is caught between the structural bullishness of its product and the cyclical reality of a global economy where high interest rates are finally starting to bite. The Bagdad expansion is a “game changer” only if the commodity price environment remains supportive enough to justify a 16.45 percent CapEx intensity.
Multi-Year Financial Trajectory and ROIC Mechanics
To understand where Freeport-McMoRan is going, we have to look at the lumpiness of its past. Mining is not a linear business. It is a series of massive checks written today for the hope of cash flows tomorrow. The company’s historical trajectory over the last four years reveals a business that is running very hard just to stay in place.
| Period | Revenue | Operating Income | Operating Margin | Free Cash Flow | SBC Expense |
|---|---|---|---|---|---|
| FY2022 | $22.78B | $7.03B | 30.9% | $1.67B | $95.0M |
| FY2023 | $22.86B | $6.22B | 27.2% | $455.0M | $109.0M |
| FY2024 | $25.45B | $6.86B | 27.0% | $2.35B | $109.0M |
| FY2025 | $25.91B | $6.50B | 25.1% | $1.12B | $121.0M |
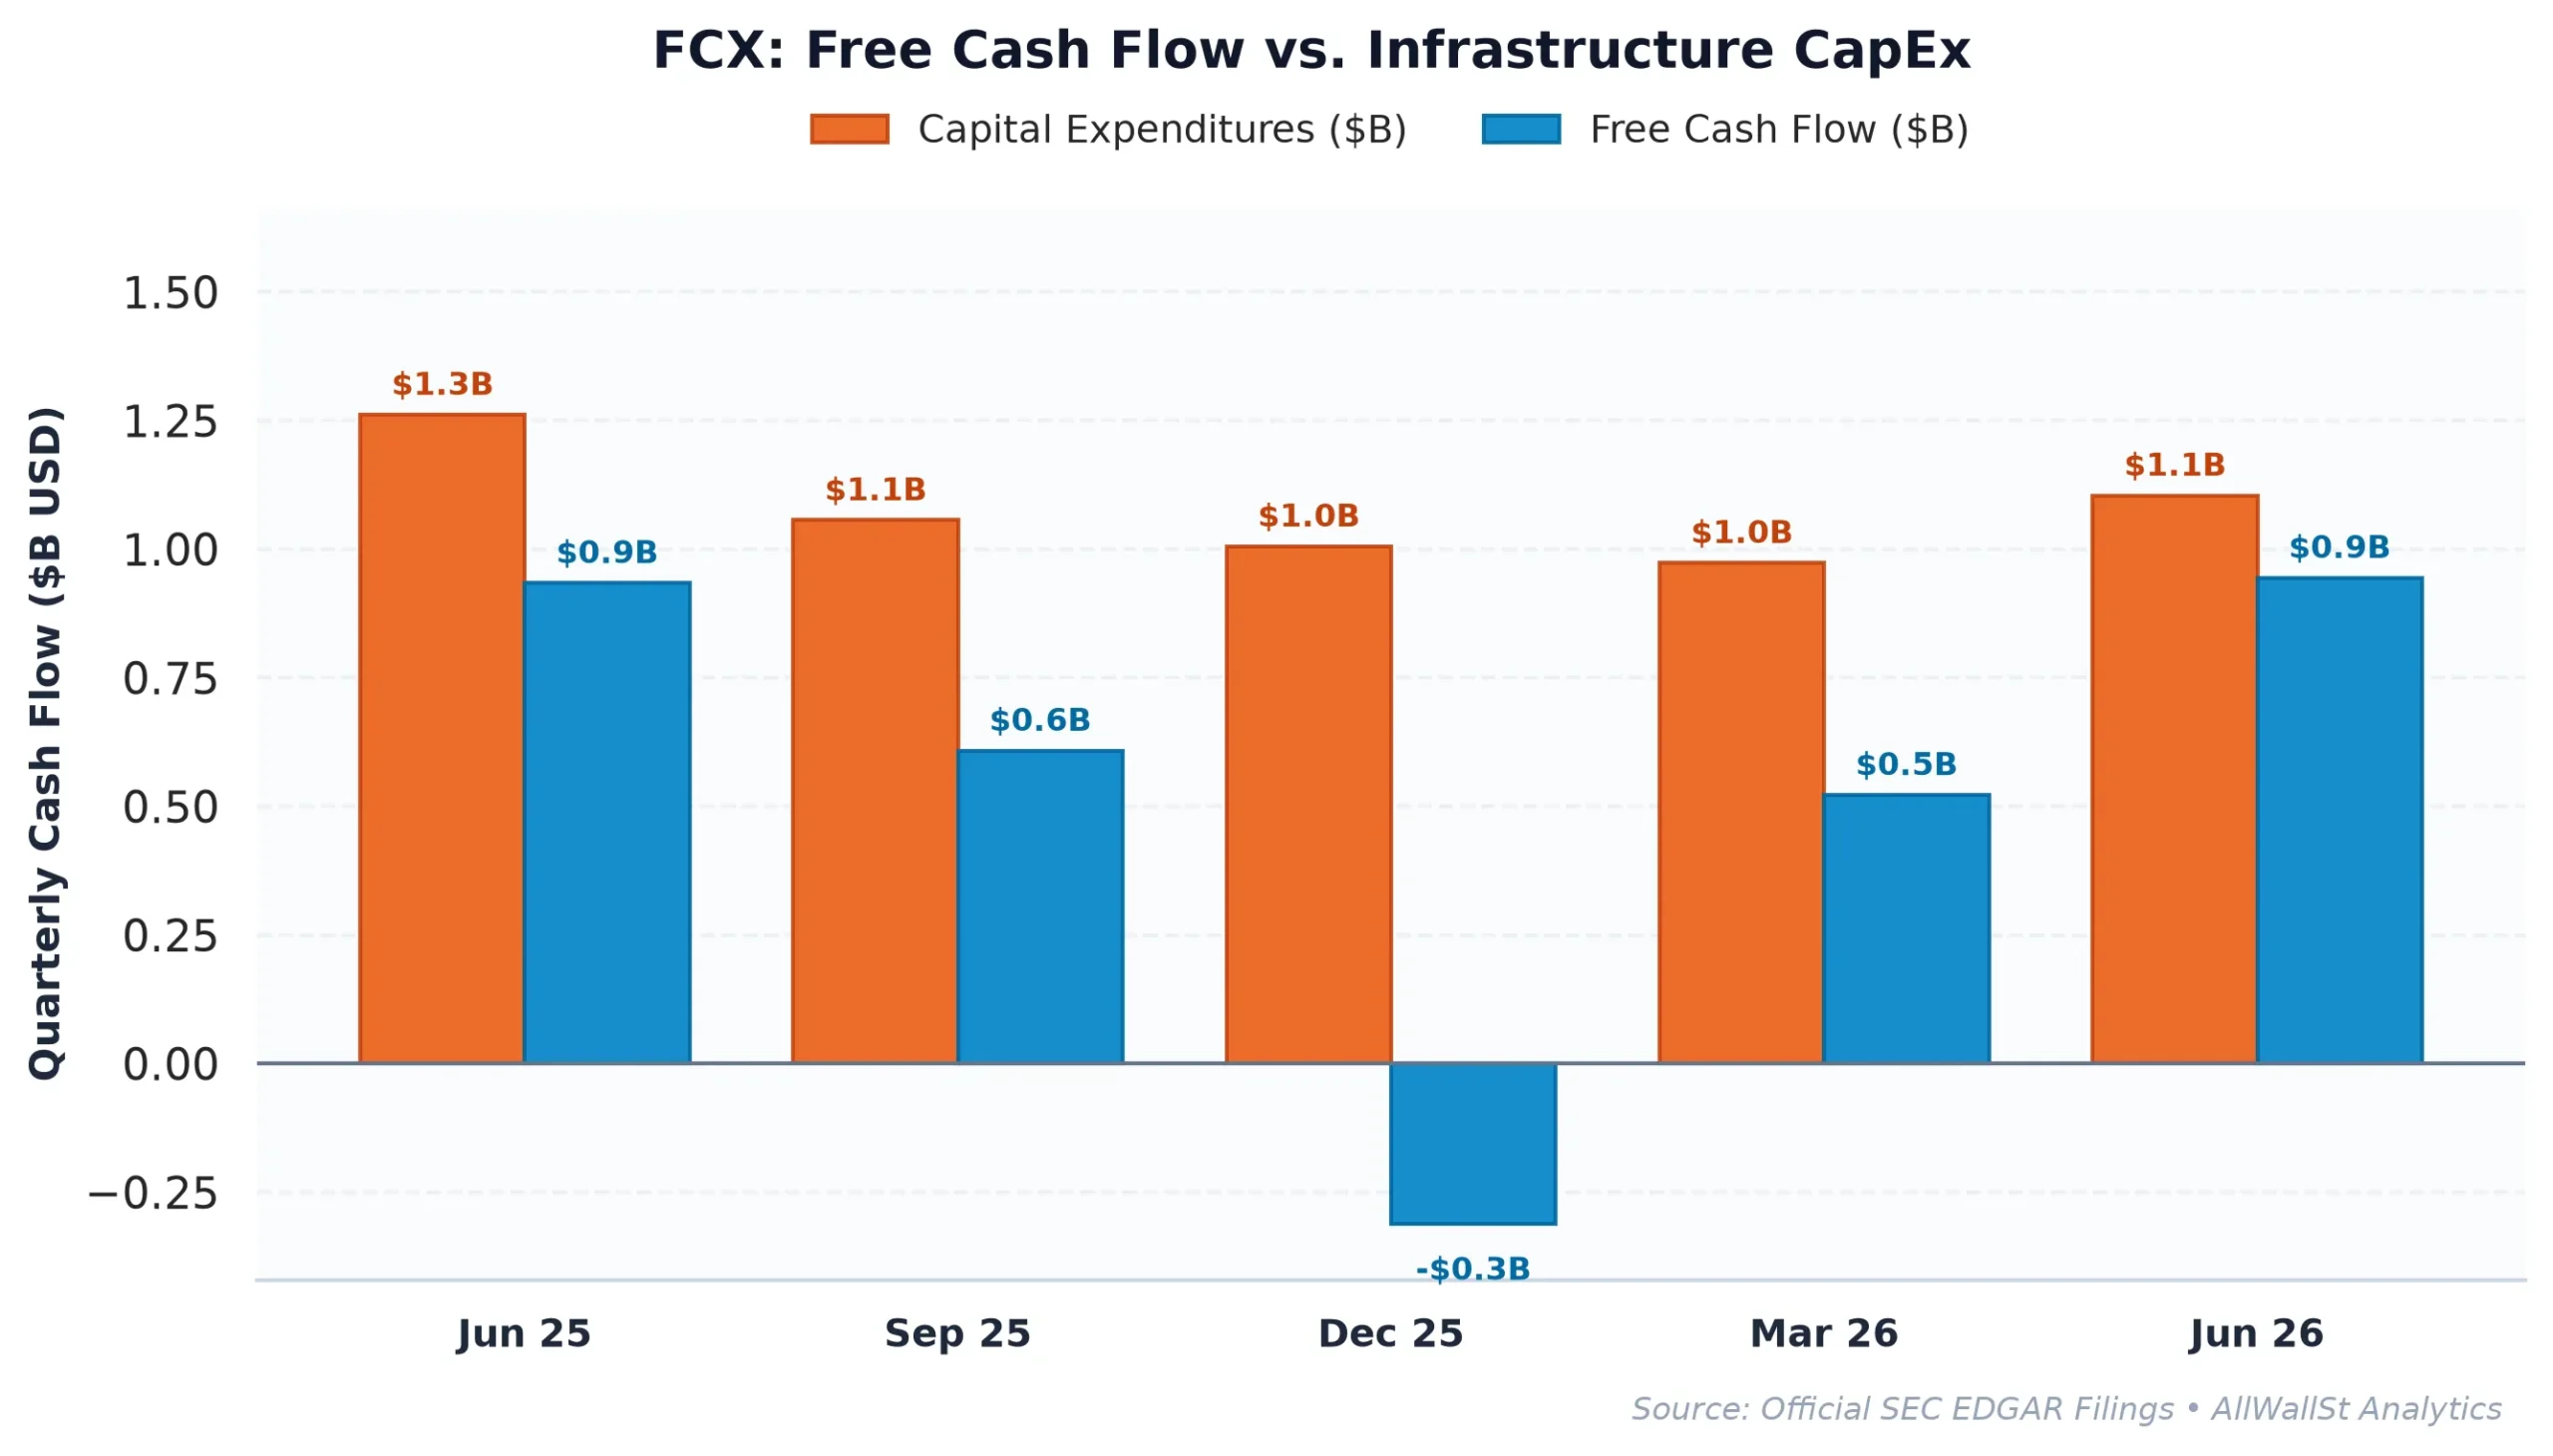
The most striking figure here is the Free Cash Flow volatility. In 2023, FCF cratered to 455 million dollars, only to rebound in 2024 and then halve again in 2025. This is the hallmark of a company in a heavy reinvestment phase. While the Return on Invested Capital (ROIC) of 27.28 percent is objectively excellent, far outpacing the 8.5 percent WACC hurdle, that return is being trapped in the ground. The company is spending 4.35 billion dollars on CapEx annually. For a common equity holder, this means the “shareholder yield” of 1.14 percent is almost entirely defensive: it is just enough to keep you interested while the company builds more holes in the desert.
We should also note the balance sheet integrity. With a Net Debt to EBITDA ratio of 0.60x, Freeport-McMoRan is not in any immediate financial danger. It has 4.3 billion dollars in cash and a total debt load that is well-laddered. The management team, as seen in recent SEC Form 10-Q filings, is disciplined. They are not chasing “empire building” for the sake of ego: they are responding to a physical market that is begging for more concentrate. However, for an investor, the question remains: why own the miner when you can own the metal, or better yet, the yield?
Peer Relative Valuation and Competitive Moat
When we stack Freeport-McMoRan against its global peers, the valuation premium becomes even more apparent. It is the “cleanest” copper play on the board, but cleanliness comes at a cost.
| Company (Ticker) | Market Cap | Forward P/E | EV/EBITDA | Rev Growth (YoY) | Operating Margin | FCF Yield |
|---|---|---|---|---|---|---|
| Freeport-McMoRan (FCX) | $85.3B | 14.0x | 10.4x | 8.20% | 35.26% | 2.19% |
| Southern Copper (SCCO) | $142.7B | 22.1x | 13.1x | 39.1% | 59.9% | 3.91% |
| Newmont (NEM) | $125.6B | 12.2x | 7.0x | 15.2% | 50.0% | 7.29% |
| BHP Group Limited (BHP) | $203.0B | 16.7x | 7.3x | 18.3% | 43.3% | 4.72% |
Southern Copper (SCCO) trades at a much higher multiple, but it also boasts a nearly 60 percent operating margin, which is almost unheard of in the materials space. Meanwhile, Newmont (NEM) and BHP Group (BHP) offer significantly higher FCF yields (7.29 percent and 4.72 percent, respectively). If you are looking for a place to hide from inflation or a way to play the commodity cycle, Newmont currently offers a much more attractive cash return profile.
Freeport-McMoRan’s moat is its geographical footprint and its scale. It owns the Grasberg district in Indonesia, one of the world’s largest copper and gold deposits. But Grasberg is also a source of geopolitical complexity and massive sustaining CapEx. Compared to the diversified giants like BHP, Freeport is a pure-play bet. If copper goes to five dollars a pound, FCX will likely outperform. If copper stays range-bound while interest rates stay “higher for longer,” the 14.0x P/E multiple starts to look like an expensive luxury.
Options Gamma Pinning, Risk Bounds and Verdict
The options market is currently leaning into a bullish skew, but it is the kind of “hopeful” positioning that often leads to disappointment if a catalyst fails to materialize. The Put/Call Open Interest ratio is 0.54, which tells us that speculators are heavily loaded into upside calls. The Max Pain strike sits at 65.00 dollars, about 9.4 percent above the current spot price. In a normal environment, this might act as a magnet, pulling the price higher into monthly expiration.
However, the “Market Structure & Gamma Bias” suggests a vulnerability. Because dealers are likely long gamma from all those sold calls, any pause in upward momentum could trigger a mechanical liquidation. If the stock fails to pierce the primary Call Wall at 65.00 dollars, the decay of those options (charm and vanna flows) will force dealers to sell their underlying hedges. The real structural support does not show up until the 55.00 dollar or 50.00 dollar Put Walls, representing a significant air pocket if the macro environment sours.
Twenty-five days ago, we assigned a HOLD rating to Freeport-McMoRan at 69.56 dollars. Since then, the stock has shed roughly 14 percent of its value. While the Bagdad expansion news is a positive long-term signal, it does not change the immediate fundamental math. The company is still yielding less than a Treasury bill, and the materials sector is still fighting a losing battle against a strengthening US Dollar (UUP). We are seeing a business that is executing well on its operational goals but remains trapped in a valuation regime that doesn’t quite make sense for a cyclical producer. Until the FCF yield moves closer to the 4.86 percent sovereign hurdle, or until the copper deficit manifests in a much higher spot price, there is no compelling reason to increase exposure here.
AllWallSt Investment Verdict: HOLD (Reaffirmed)
Freeport-McMoRan Inc. (FCX)
Trailing P/E
Marcus Wolfe Screen
Leverage Profile
30D Channel
Dealer Gamma Pinning & Max Pain Alignment (FCX)
MODERATE WATCHLIST (1 flag): Receivables growth outstripped revenue growth by >15%, pointing to potential revenue recognition or collection friction.
Prudent Leverage (0.60x Net Debt/EBITDA); well within investment-grade covenant headroom.
Negative yield spread (-2.67% vs 4.86% Treasury); equity requires robust multiple expansion or growth.
Max Pain: $65.00 (+9.39%) | P/C Ratio: 0.54 | 30D Channel: $49.84 – $69.00. Dealer gamma bounded between $50 Put Wall and $80 Call Wall.
FCX carries standard index weighting (< 0.6% SPY footprint); sell-side consensus reflects standard earnings momentum rather than index-tracking mandates.
Accumulation Deferred (Await Pullback toward $49.00 – $51.00 Support Pinning)
Sustained weekly close below $50.00 (Put Wall) or acceleration in margin compression.
Sources & References
- Official SEC Form 10-K Annual Report (Filed 2026-02-13)
- Freeport-McMoRan Investor Relations
- SEC EDGAR: Freeport-McMoRan Inc. Filings
- SEC Form 10-Q (Filed Nov 06, 2026)
- S&P Global Materials Sector Performance Data
Disclaimer: This report is for informational purposes only and does not constitute financial advice. The author has no position in FCX at the time of writing. Investing in basic materials and mining stocks involves significant risks, including commodity price volatility and geopolitical instability.