
⚡ Executive Morning Takeaways
- Overnight Futures & Rates Impulse: E-Mini futures are trading higher (ES+0.66%, NQ+0.51%) as markets attempt to shake off rate volatility, though the 10-Year Treasury yield remains a structural anchor at 4.86 percent.
- Sector Rotation Leaders & Laggards: Technology (XLK) and Communication Services (XLC) continue to lead on AI-centric momentum, while Consumer Staples (XLP) and Materials (XLB) face selling pressure as capital migrates toward higher-beta growth.
- Primary Corporate Catalyst: Equinix, Inc. (EQIX) is seeing pre-market strength (+0.90%) following news of its sixth Singapore data center expansion, yet the options market reflects a defensive posture with a Put/Call ratio of 1.92.
🌐 Pre-Market Macro, Futures & Rates Dashboard
| Asset / Benchmark | Ticker | Current Price / Level | Change (%) | 52-Week Low | 52-Week High |
|---|---|---|---|---|---|
| E-Mini S&P 500 Futures (ES=F) | ES=F | $7450.75 | +0.66% | $6353.25 | $7897.50 |
| E-Mini Nasdaq 100 Futures (NQ=F) | NQ=F | $27222.50 | +0.51% | $22961.50 | $31616.50 |
| S&P 500 (SPY) | SPY | $735.29 | +0.31% | $629.28 | $781.62 |
| Nasdaq 100 (QQQ) | QQQ | $656.10 | +1.40% | $555.60 | $762.86 |
| Russell 2000 (IWM) | IWM | $273.67 | +0.99% | $228.90 | $305.18 |
| 20+ Year Treasury (TLT) | TLT | $81.92 | -0.01% | $76.43 | $90.86 |
| High Yield Corporate (HYG) | HYG | $77.23 | -0.06% | $76.39 | $81.24 |
| Gold (GLD) | GLD | $372.52 | -0.79% | $354.67 | $509.70 |
| WTI Crude Oil (CL=F) | CL=F | $87.92/bbl | -3.20% | $54.98 | $119.48 |
| US Dollar Index Bullish (UUP) | UUP | $29.13 | +0.73% | $26.40 | $29.25 |
| CBOE Volatility Index (^VIX) | ^VIX | 23.63 | -7.84% | 13.38 | 35.30 |
| 2-Yr US Treasury Yield (2YY=F) | 2YY=F | 4.75% | +0.00% | 3.38% | 4.88% |
| 10-Yr US Treasury Yield (^TNX) | ^TNX | 4.86% | +0.45% | 3.96% | 5.36% |
The macro environment is currently a tug-of-war between optimistic equity futures and the cold reality of the fixed-income market. While the E-Mini S&P 500 is signaling a risk-on morning, the 10-Year Treasury yield (^TNX) at 4.86 percent represents a formidable hurdle for capital-intensive sectors. When risk-free paper pays nearly 5 percent, the equity risk premium for high-multiple REITs evaporates, forcing a rigorous re-evaluation of every dollar spent on data center cooling and substation capacity.
Volatility as measured by the VIX has retreated nearly 8 percent overnight, suggesting that the immediate panic has subsided. However, the strength in the US Dollar Index (UUP) and the persistent elevation in the 2-Year yield indicate that liquidity remains tight. For multinationals and leveraged real estate vehicles, this combination of a strong dollar and high borrowing costs creates a “refinancing friction” that GAAP earnings often fail to capture until the debt maturity wall actually arrives.
📊 Sector Rotation Leaders & Laggards
| Rotation Rank | Sector ETF | Ticker | Price | Change (%) | Trailing P/E | Dividend Yield | 52-Week Low | 52-Week High |
|---|---|---|---|---|---|---|---|---|
| Leader (#1) | Technology (XLK) | XLK | $164.74 | +1.45% | 29.1x | 0.47% | $126.68 | $203.25 |
| Leader (#2) | Communication Services (XLC) | XLC | $104.79 | +0.43% | 16.6x | 1.38% | $99.33 | $120.41 |
| Leader (#3) | Industrials (XLI) | XLI | $162.67 | +0.12% | 26.1x | 1.13% | $147.14 | $188.19 |
| Laggard (#8) | Financials (XLF) | XLF | $57.16 | -0.59% | 15.4x | 1.46% | $47.67 | $60.04 |
| Laggard (#9) | Materials (XLB) | XLB | $51.95 | -0.73% | 21.6x | 1.64% | $42.22 | $54.63 |
| Laggard (#10) | Consumer Staples (XLP) | XLP | $90.08 | -1.28% | 24.2x | 2.46% | $75.93 | $93.40 |
Institutional capital is clearly bifurcating. The leaders, XLK and XLC, are benefiting from a flight to quality (or at least a flight to growth) as investors bet on AI-driven margin expansion to outrun inflation. In contrast, the laggards in Consumer Staples and Materials are being treated as sources of funds. When the risk-free rate is high, the 2.46 percent yield on XLP looks increasingly uncompetitive, especially when compared to the 4.86 percent available in Treasuries with zero operational risk.
📅 Today’s Earnings & Economic Radar
Imminent Corporate Earnings Releases
| Company / Ticker | Timing | Consensus EPS | Consensus Revenue | Key Strategic Theme |
|---|---|---|---|---|
| Bank of America (BAC) | Reported | $1.17 | $30.68B | NII Expansion & Advisory Fees |
| Taiwan Semiconductor (TSM) | Today | $1.95 | $23.20B | AI Foundry Capacity & N2/N3 Node Ramp |
| Netflix (NFLX) | Oct 20 | $5.12 | $9.76B | Ad-Tier Penetration & Operating Margin |
High-Impact Economic Data & Central Bank Actions
| Time (ET) | Event | Impact | Key Institutional Focus |
|---|---|---|---|
| 10:00 AM | CB Leading Economic Index (LEI) | HIGH | Forward Industrial & Credit Cycle Momentum |
| 11:30 AM | US Treasury Bill Auctions | MEDIUM | Front-End Yield Curve Anchoring |
| 01:00 PM | Fed Senior Loan Officer Survey | HIGH | Commercial Credit Tightening & Term Premia |
The focus for the 9:30 AM open is squarely on the Taiwan Semiconductor (TSM) results. As the primary foundry for the AI revolution, TSM’s guidance will dictate whether the data center trade is a sustainable structural shift or a temporary CapEx bubble. If TSM signals any softening in high-end node demand, the high valuations across the digital infrastructure space will face an immediate stress test.
🎯 Pre-Market Spotlight: Equinix, Inc. (EQIX)
Equinix, Inc. (EQIX) occupies a fascinating, if precarious, position in the modern market architecture. It is the physical tollbooth of the internet, a specialty REIT that provides the cages, power, and cross-connects that allow the global cloud to function. The company’s recent announcement regarding its sixth Singapore data center, powered by 100 percent renewable energy, is a classic high-signal move designed to appeal to both hyperscale tenants and ESG-mandated institutional funds. However, beneath the green ribbons and the pre-market quote of $1021.86, the fundamental plumbing is starting to leak.
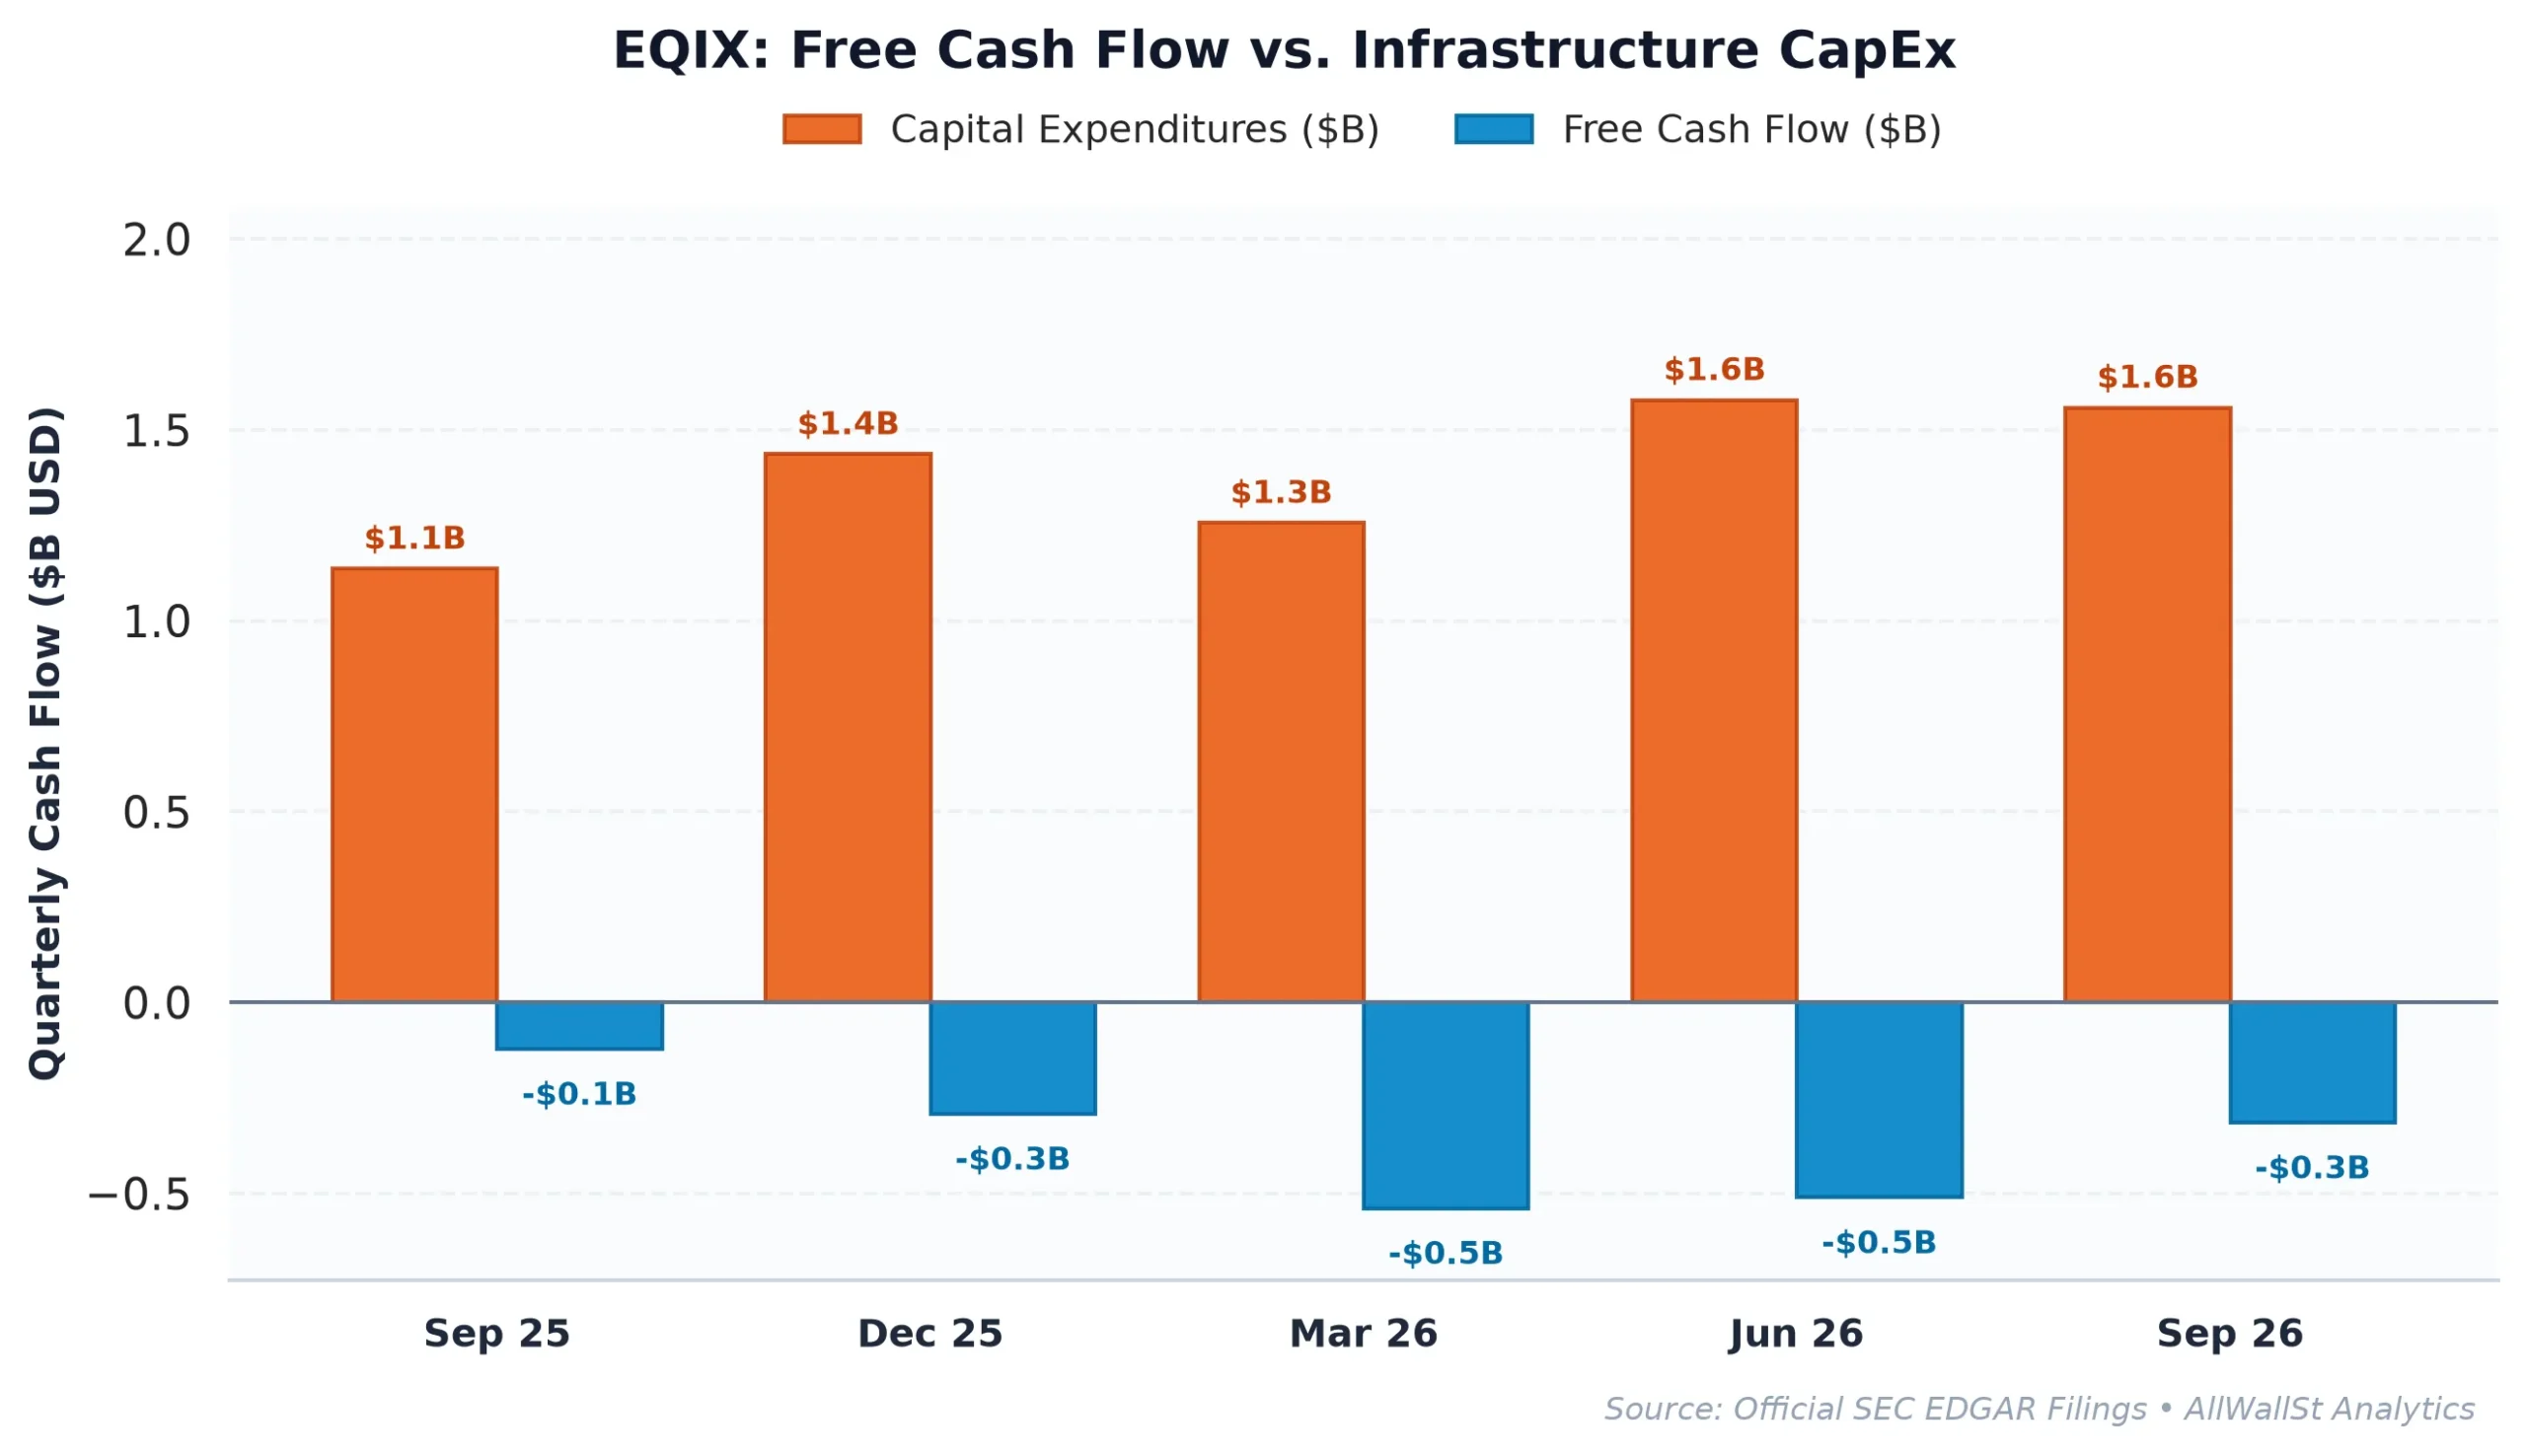
The core problem for Equinix is the math of capital allocation in a high-rate regime. The company currently trades at a forward P/E of 48.9x and offers a Free Cash Flow (FCF) yield of just 3.17 percent. When you compare this to the 10-Year Treasury yield of 4.86 percent, you are looking at a negative spread of 1.69 percent. In institutional terms, investors are paying Equinix for the privilege of owning a business that earns less cash than a risk-free government bond. While peers like Digital Realty Trust (DLR) offer a more palatable 5.86 percent FCF yield, Equinix is trading on a “scarcity premium” that looks increasingly fragile as its Return on Invested Capital (ROIC) of 5.20 percent struggles to clear its estimated 8.5 percent cost of capital.
The balance sheet adds another layer of complexity. With $26.41 billion in total debt and a Net Debt/EBITDA ratio of 5.13x, Equinix is a leveraged bet on a low-rate environment that no longer exists. While the company has successfully grown revenue by 10.40 percent year-over-year, its historical FCF trajectory has been erratic, swinging from $685 million in 2022 to a projected negative $400 million in 2025 as CapEx intensity remains high. This is the “Data Center Dilemma”: you must spend billions on infrastructure to keep your tenants, but the more you spend, the more you dilute the very cash flow that justifies your valuation.
Quantitative market structure confirms this skepticism. The Put/Call Open Interest ratio stands at a lopsided 1.92, indicating that institutional desks are heavily paying up for downside protection. The Max Pain strike is anchored at $840, a staggering 17 percent below current spot prices, suggesting a significant “gravity well” if momentum stalls. While Wall Street consensus remains at a career-safe Market Weight, our fundamental audit suggests that the combination of negative yield spreads, high leverage, and value-destructive ROIC makes Equinix a primary candidate for a valuation reset.
AllWallSt Investment Verdict: SELL
Equinix, Inc. (EQIX)
Trailing P/E
Marcus Wolfe Screen
Leverage Profile
30D Channel
Dealer Gamma Pinning & Max Pain Alignment (EQIX)
Pristine cash flow conversion (2.90x) and healthy accrual ratio (-6.38%). Zero accounting anomalies detected (LOW ANOMALY RISK).
Elevated Leverage (5.13x Net Debt/EBITDA); balance sheet requires structural deleveraging.
Negative yield spread (-1.69% vs 4.86% Treasury); equity requires robust multiple expansion or growth.
Max Pain: $840.00 (-17.05%) | P/C Ratio: 1.92 | 30D Channel: $907.59 – $1117.83. Dealer gamma bounded between $1030 Put Wall and $1320 Call Wall.
EQIX carries standard index weighting (< 0.6% SPY footprint); sell-side consensus reflects standard earnings momentum rather than index-tracking mandates.
$1293.60 – $1346.40 (Call Wall Resistance Distribution Ceiling)
Sustained weekly close above $1320.00 (Call Wall Resistance) or structural rebound in GAAP Free Cash Flow.
Sources & References
-
SEC EDGAR Filings: Equinix, Inc. (CIK 0001101239)
- Investor Relations: Equinix Investor Relations Portal
- Primary Source: Equinix Form 10-Q Filed Oct 28, 2026
Regulatory Disclaimer: This report is for institutional information purposes only and does not constitute investment advice. AllWallSt is a financial news and analysis provider, not a registered investment advisor. Data is sourced from primary SEC filings and exchange feeds; however, market conditions are subject to rapid change. Past performance is not indicative of future results. Equity and options trading involve substantial risk. Consult with a qualified financial professional before making any capital allocation decisions.