
Wells Fargo & Company (WFC) has spent the better part of the last decade acting as the financial sector’s primary cautionary tale. If you were a regulator looking to justify a career in oversight, or a journalist looking for a headline about corporate culture gone sideways, Wells Fargo was the gift that kept on giving. But something strange happens when a company remains in the penalty box for long enough: it eventually runs out of ways to disappoint you and starts accidentally making money.
The current market setup for Wells Fargo & Company is a classic study in institutional exhaustion. While the broader indices are chasing the tailwinds of a 2.30% surge in Nasdaq futures and a 1.53% lift in the S&P 500, Wells Fargo is quietly operating a capital return machine that looks more like a private equity harvest than a traditional banking business. The company is currently yielding a total shareholder return of 10.02 percent, comprised of a 2.38 percent dividend and a staggering 7.64 percent buyback yield. In a world where the 10-Year Treasury yield sits at 4.85 percent, getting paid double that amount just to wait for the regulatory cloud to lift is a trade that most institutional desks are beginning to find irresistible.
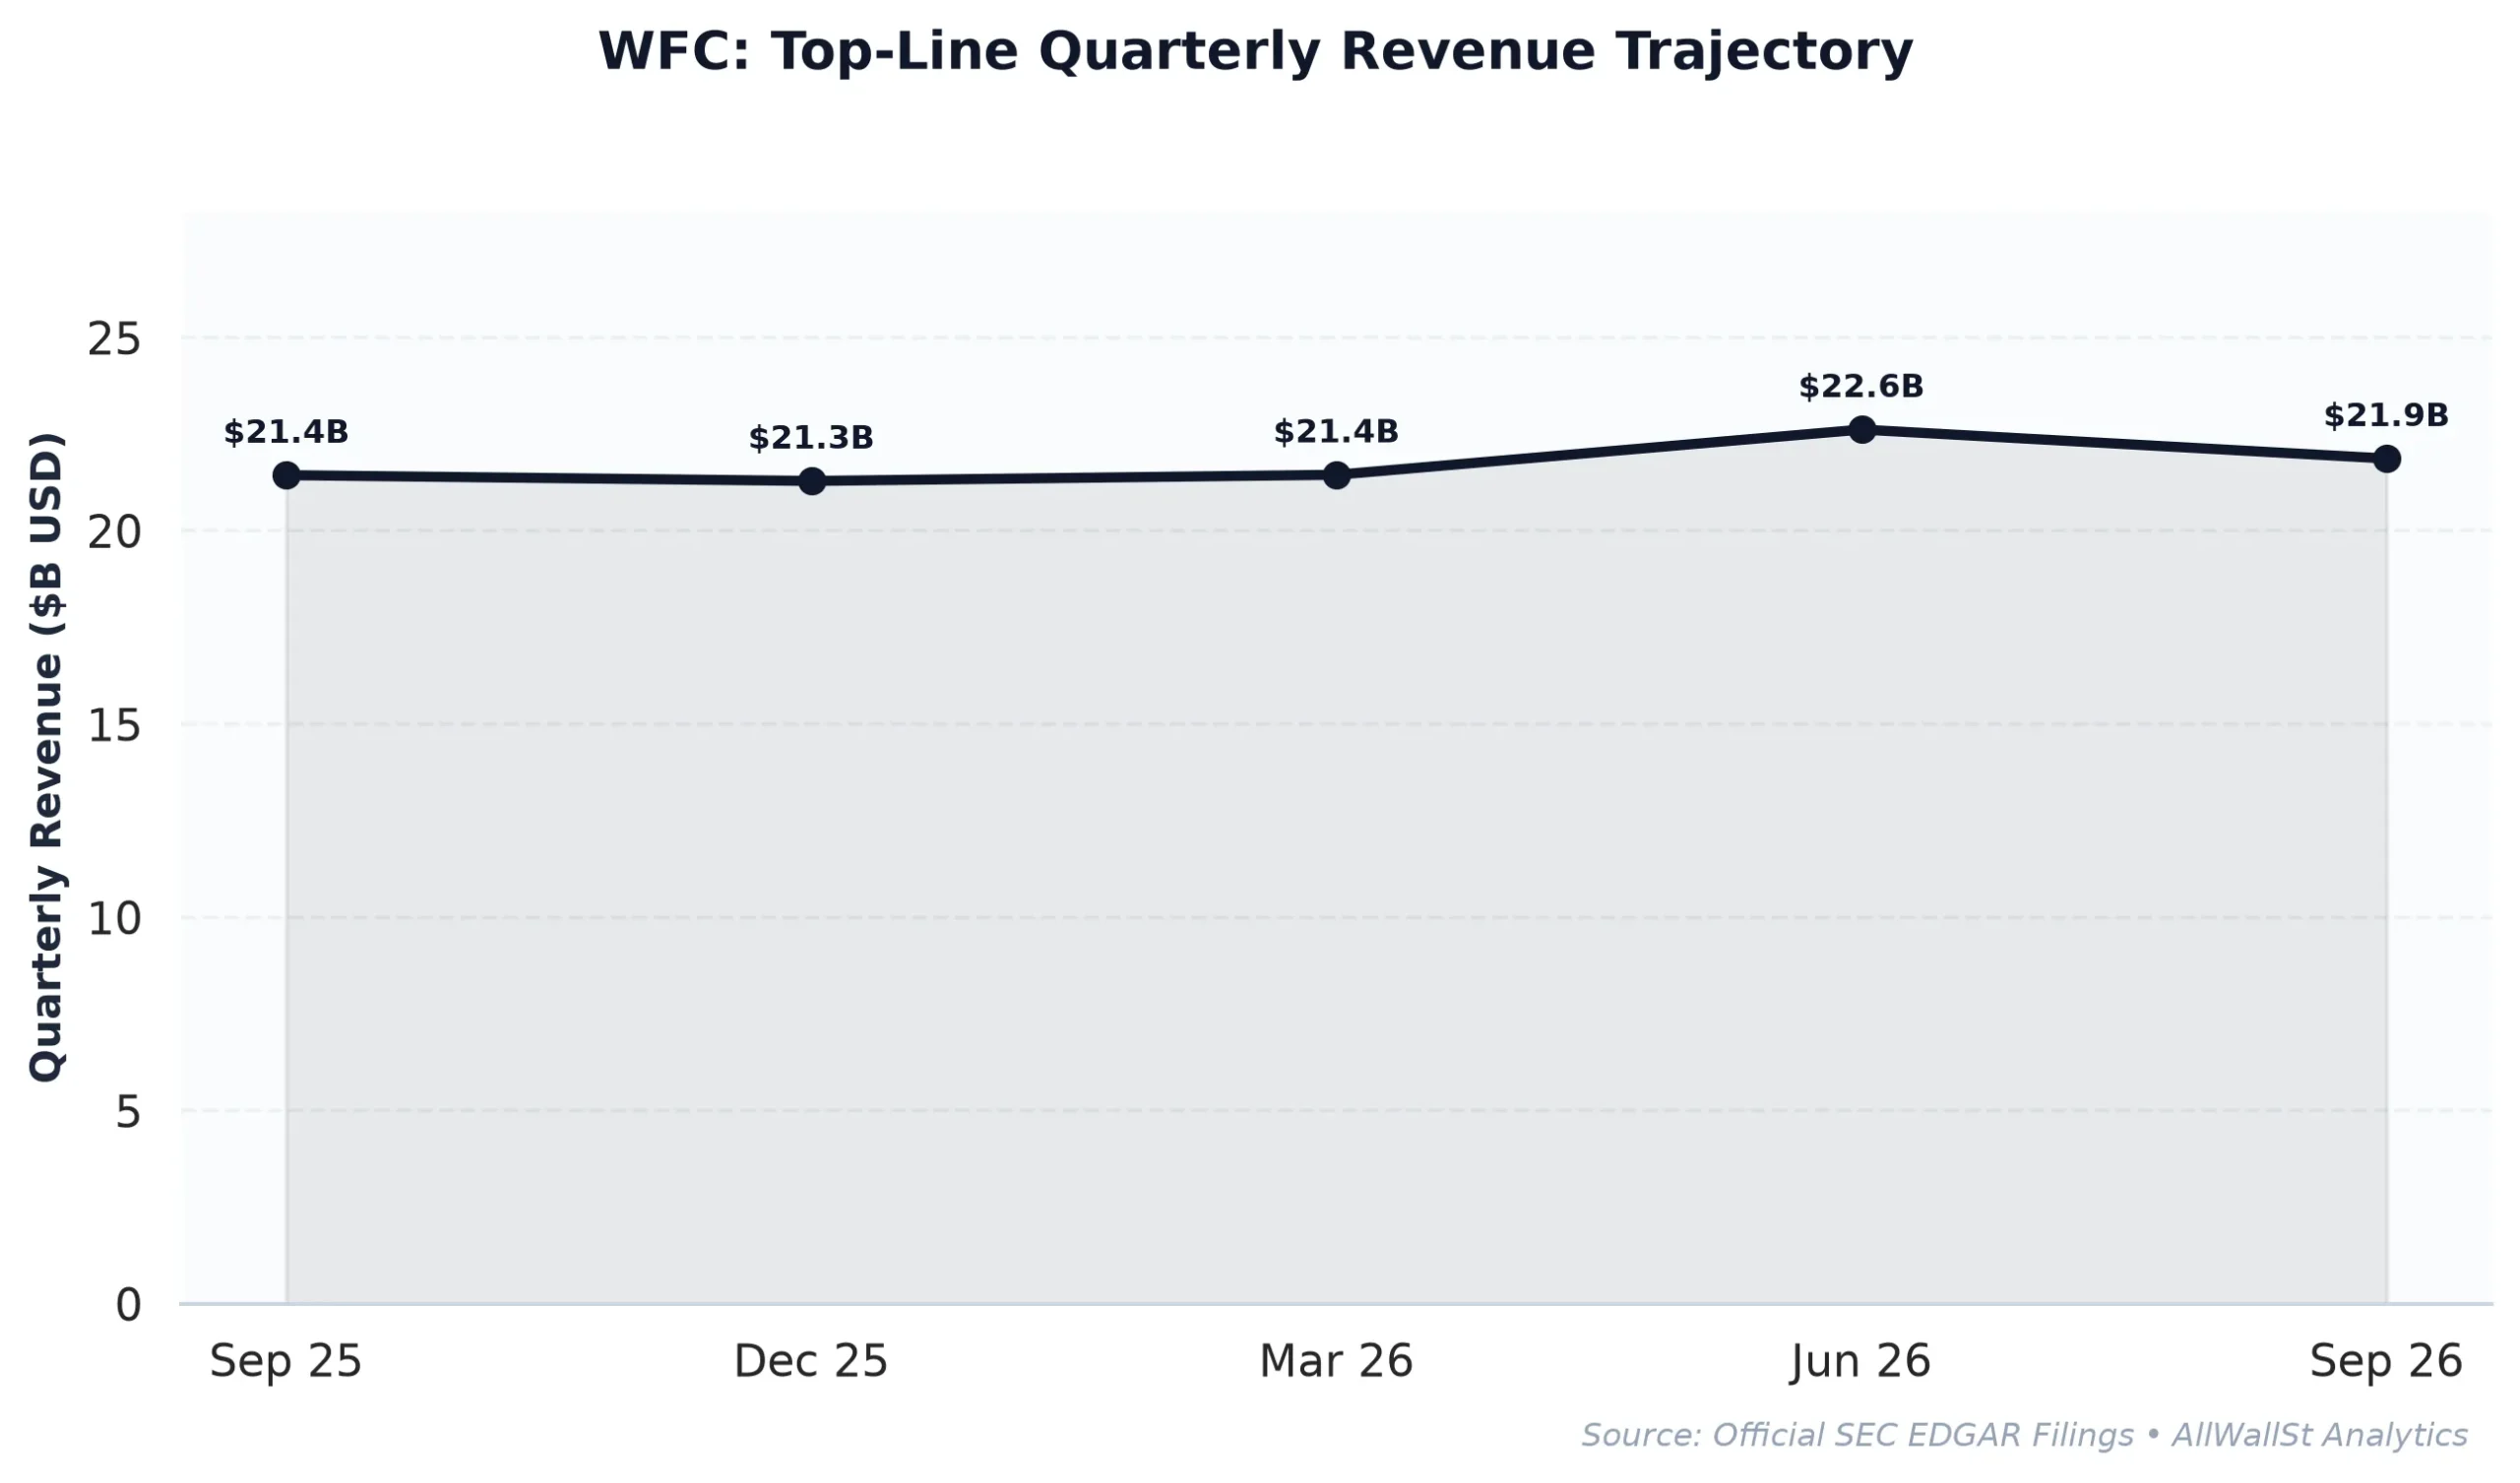
Multi-Year Financial Trajectory and the ROIC Mirage
To understand the bull case for Wells Fargo & Company, one must first look past the headline Free Cash Flow (FCF) figures. On a trailing basis, the company shows a FCF yield of -7.44 percent. In a software company, that would be a signal to run for the exits. In a diversified bank, however, cash flow is often an accounting mirage driven by the movement of loans and deposits. If Wells Fargo decides to grow its loan book or shift its securities portfolio, cash “leaves” the operating bucket, creating a negative FCF print that masks the underlying profitability of the franchise.
The real story is found in the Return on Invested Capital (ROIC) and the operating margin trajectory. Between FY2022 and FY2025, Wells Fargo saw its operating margin expand from 18.4 percent to a projected 25.5 percent. This is not the behavior of a bank in distress: it is the behavior of a bank that has spent years aggressively cutting costs and automating legacy manual processes that were once the source of its regulatory headaches. The company’s ROIC currently stands at 13.97 percent, which is a healthy spread above its estimated 8.5 percent Weighted Average Cost of Capital (WACC).
Crucially, the bank is achieving these returns while maintaining a massive cash pile of $461.86 billion. This liquidity acts as a structural hedge against the current macro volatility. While the 2-Year US Treasury yield hovers at 4.75 percent, Wells Fargo is essentially a giant vault of capital that is getting paid to wait for the next credit cycle. The market is pricing this vault at a forward P/E of 10.6x, which suggests that investors still haven’t quite forgiven the bank for its history, even as the numbers suggest the penance is over.
Peer Relative Valuation and the Competitive Moat
When we benchmark Wells Fargo & Company against its peers, the valuation gap becomes even more glaring. While JPMorgan Chase (JPM) is the undisputed king of the sector, trading at a 13.2x forward multiple and a massive $897.9 billion market cap, Wells Fargo offers a more compelling entry point for those looking for value rather than momentum.
| Company (Ticker) | Market Cap | Forward P/E | EV/EBITDA | Rev Growth (YoY) | Operating Margin | FCF Yield |
|---|---|---|---|---|---|---|
| Wells Fargo & Company (WFC) | $255.4B | 10.6x | N/A | 0.40% | 34.21% | -7.44% |
| JP Morgan Chase & Co. (JPM) | $897.9B | 13.2x | N/A | 10.2% | 42.6% | N/A |
| Bank of America (BAC) | $346.8B | 9.7x | N/A | 3.4% | 31.3% | N/A |
| Citigroup (C) | $199.2B | 9.2x | N/A | 8.0% | 34.1% | N/A |
The table above illustrates a fascinating divergence. Wells Fargo’s operating margin of 34.21 percent actually outperforms Bank of America (31.3 percent) and is neck-and-neck with Citigroup (34.1 percent). However, Wells Fargo is returning capital to shareholders at a rate that its peers find difficult to match given their own regulatory capital requirements and growth initiatives.
The “M&A Surge” talk mentioned in recent news cycles is another catalyst. As the IPO and advisory markets begin to thaw, Wells Fargo’s investment banking arm, which has long been the underdog to the JPM/Goldman/Morgan Stanley triad, has significant room for market share gains. For a bank with a 1.61x Price to Book ratio, any incremental high-margin advisory revenue flows directly to the bottom line without requiring the same capital intensity as a traditional mortgage or commercial loan. This is the “undervalued narrative” that keeps institutional buyers like Pictet Asset Management accumulating shares.
Options Gamma Pinning and the $84 Magnet
From a market structure perspective, Wells Fargo & Company is currently pinned in a remarkably stable volatility regime. The Put/Call Open Interest ratio of 1.09 indicates a balanced distribution of institutional hedging and speculative interest. We are not seeing the kind of lopsided call-buying that usually precedes a blow-off top, nor are we seeing the panicked put-buying that signals an imminent crash.
The “Max Pain” strike is currently sitting at $84.00, just 1.28 percent below the current spot price of $85.08. In the world of dealer gamma, this creates a magnetic effect. As we approach monthly expirations, dealers will likely be forced to buy or sell the underlying stock to remain delta-neutral, effectively pinning the price near this level. However, the Call Walls at $90.00 and $92.50 provide a clear ceiling for the next 30 days, while the Put Support at $75.00 and $72.50 offers a formidable floor.
The implied volatility (IV) of 38.65 percent suggests the market is pricing in a 30-day move of approximately plus or minus 11 percent. Given the fundamental stability and the aggressive buyback program, we view the downside risk as structurally capped by the company’s own bid. When a company is buying back nearly 8 percent of its own shares annually, it creates a “forced buyer” of last resort that can overwhelm most macro-driven selloffs.
The macro backdrop further supports this thesis. With the High Yield Corporate (HYG) index showing resilience and the US Dollar Index (UUP) easing slightly, the environment for diversified financials is the best it has been in years. Wells Fargo is no longer the bank that breaks things: it is the bank that collects fees, buys back its own stock, and waits for the market to realize that 10x earnings for a 13 percent ROIC business is an anomaly that cannot last forever.
AllWallSt Investment Verdict: BUY
Wells Fargo & Company (WFC)
Trailing P/E
Marcus Wolfe Screen
Leverage Profile
30D Channel
Dealer Gamma Pinning & Max Pain Alignment (WFC)
Banking liquidity & regulatory capital compliant (Basel III / CET1 governed); deposit & trading settlement flows normalized.
Tier 1 Regulatory Capital & Liquidity Coverage Ratio (LCR) compliant; balance sheet governed by Basel III capital buffers.
Evaluated against 4.85% US 10-Yr Benchmark; bank net interest margins sensitive to yield curve slope (2s10s spread) and deposit beta.
Max Pain: $84.00 (-1.28%) | P/C Ratio: 1.09 | 30D Channel: $75.66 – $94.51. Dealer gamma bounded between $72.5 Put Wall and $90 Call Wall.
WFC carries standard index weighting (< 0.6% SPY footprint); sell-side consensus reflects standard earnings momentum rather than index-tracking mandates.
$71.05 – $73.95 (Options Support Pinning)
Sustained weekly close below $72.50 (Put Wall) or gross margin compression below 0.00%.
Sources & References
- Official SEC Form 10-K Annual Report (Filed 2026-02-24)
- SEC EDGAR: Wells Fargo & Company Primary Filings
- Wells Fargo Investor Relations
- Federal Reserve Senior Loan Officer Opinion Survey (October 2026)
- SEC Form 10-Q Filed October 28, 2026
Disclaimer: This report is for informational purposes only and does not constitute financial advice. All investments involve risk, and past performance is not indicative of future results. AllWallSt and its contributors may hold positions in the securities discussed.