
The way that modern financial markets work is that we have spent the last two years treating NVIDIA Corporation (NVDA) less like a semiconductor company and more like a sovereign wealth fund that happens to manufacture very expensive sand. When you are the primary engine of the global artificial intelligence build-out, and when your stock represents nearly 8 percent of the S&P 500, you are no longer just a business. You are a benchmark. You are the environment in which everyone else has to live.
This is why the current news cycle feels so dissonant. Over the last 48 hours, the narrative surrounding the world’s most important chipmaker has shifted from Blackwell architecture yields and HBM3e supply chains to something out of a Cold War thriller. Reports from CNN and CNBC suggest that Nvidia is investigating an alleged affair between CEO Jensen Huang and a person described as a foreign spy. The stock fell 5 percent on the news.
If you are a fundamental analyst, this is an annoying development. You want to talk about the 105.9 percent year-over-year revenue growth. You want to talk about the 74.67 percent gross margins that seem to defy the laws of economic physics. Instead, you are forced to contemplate “key man risk” in the context of international espionage. The consensus view today is that this scandal is a catastrophic threat to Nvidia’s leadership. The logic is that if Jensen Huang is compromised or forced to step aside, the visionary glue holding the AI revolution together dissolves.
We think that is probably the wrong way to look at it. In a market where the 10-Year Treasury yield is hovering around 4.88 percent, a company trading at a 0.98 percent free cash flow yield is already living on a very thin margin of error. When the valuation is this stretched, the market does not need a spy scandal to sell off; it just needs an excuse.
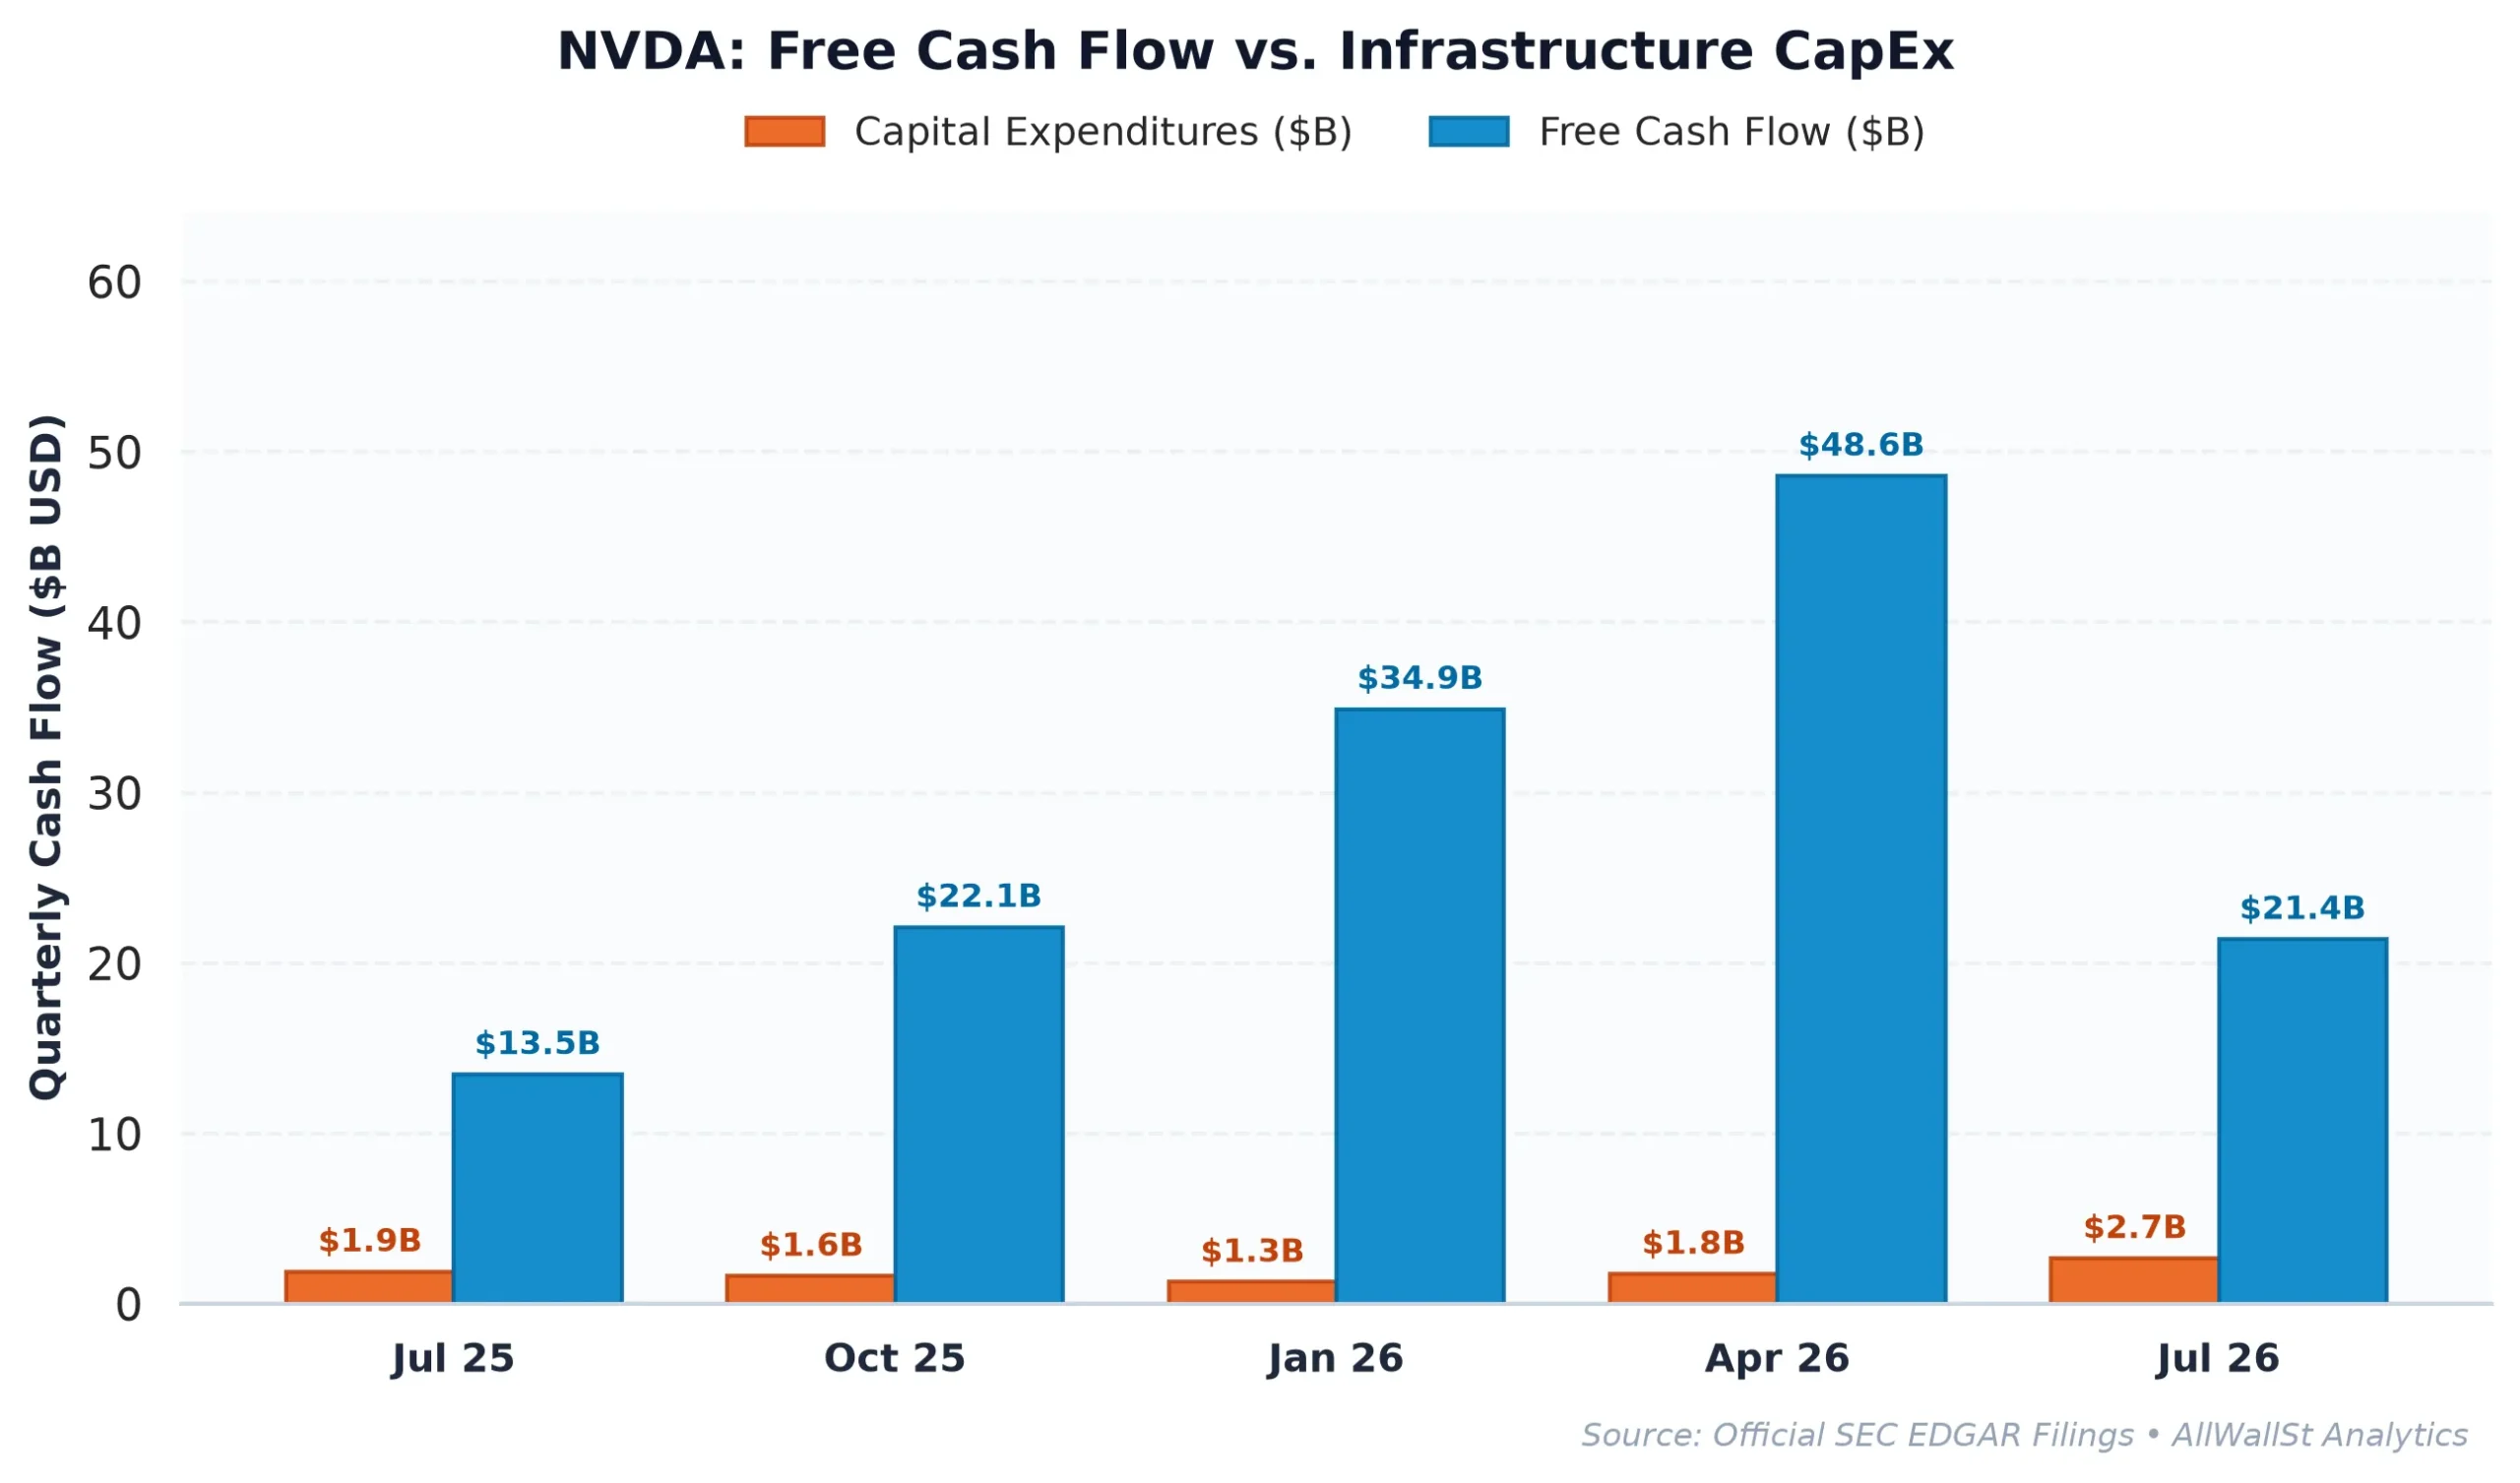
The Miracle of the Income Statement
To understand why a 5 percent drop feels like both a disaster and a rounding error, you have to look at the historical trajectory of Nvidia’s financials. In fiscal year 2023, the company generated $26.97 billion in revenue. By fiscal year 2026, that number reached $215.94 billion. This is not a normal corporate growth curve. This is a vertical ascent.
Operating margins have followed a similar path, expanding from 20.7 percent to over 60 percent in the same period. Usually, when a company scales this quickly, efficiency drops. You hire too many people, you overpay for real estate, and your margins compress. Nvidia did the opposite. It became more profitable as it grew larger, largely because it owns a near-monopoly on the high-end compute required for large language models.
However, there is a catch. If you look at the cash flow mechanics, the picture becomes slightly more complicated. While Nvidia reported $96.68 billion in free cash flow for FY2026, it also spent $92.55 billion on capital expenditures. The company is essentially reinvesting every dollar it makes back into the ground to maintain its lead. This is what we call CapEx intensity. When you are the leader, you have to spend massive amounts of money just to make sure no one else catches up.
Then there is the matter of stock-based compensation (SBC). Nvidia issued $6.39 billion in SBC recently. While that is only about 4.8 percent of its operating cash flow, which is relatively disciplined for a Silicon Valley giant, it still eats into the “real” free cash flow available to shareholders. When you strip out the SBC, the real free cash flow yield drops to 0.83 percent. Compare that to the risk-free rate of a US Treasury bond at 4.88 percent. To buy Nvidia here, you have to believe that the future growth will be so immense that it justifies earning 4 percent less than you would by doing absolutely nothing and lending money to the government.
The Benchmark Gravity and Peer Reality
The reason Nvidia continues to trade at these levels is what we call Benchmark Gravity. Because the company is such a massive part of the major indices, institutional fund managers face a terrifying career risk if they do not own it. If the S&P 500 goes up because Nvidia goes up, and you do not own Nvidia, you lose your job. This creates a mechanical, forced bid for the stock that has very little to do with whether or not the CEO is having an affair.
When we compare Nvidia to its peers, the valuation story gets even more interesting. Nvidia is currently trading at a forward P/E of 11.1x, which, on the surface, looks cheaper than Advanced Micro Devices (AMD) at 28.3x. But P/E ratios are a lie told by accountants to make investors feel better. The real metric is how much cash the business actually produces relative to its price.
| Company (Ticker) | Market Cap | Forward P/E | EV/EBITDA | Rev Growth (YoY) | Operating Margin | FCF Yield |
|---|---|---|---|---|---|---|
| NVIDIA (NVDA) | $4.25T | 11.1x | 22.2x | 105.90% | 66.24% | 0.98% |
| Advanced Micro Devices (AMD) | $818.7B | 28.3x | 65.5x | 44.7% | 21.2% | 0.90% |
| Broadcom (AVGO) | $1.52T | 16.3x | 27.5x | 85.5% | 54.3% | 2.01% |
| Taiwan Semiconductor M (TSM) | $2.02T | 16.7x | 3.4x | 50.9% | 58.7% | 1.82% |
As the table shows, Nvidia’s operating margins are nearly triple those of AMD. Its revenue growth is more than double. It is, by every operational metric, a superior machine. However, both Broadcom and Taiwan Semiconductor (TSM) offer significantly higher free cash flow yields. Broadcom, in particular, yields 2.01 percent, which is still below the Treasury rate but provides a much larger cushion than Nvidia’s sub-1 percent yield.
The competitive moat here is not just the silicon. It is the software. The CUDA platform has created a world where developers are locked into Nvidia’s ecosystem. Even if AMD or a hyperscaler like Amazon or Google builds a faster chip, the cost of switching the software stack is so high that most companies just keep buying Nvidia. This is the “integrated roadmap” that the news stories say is at risk. But software ecosystems do not disappear because a CEO has a bad week in the tabloids. They disappear because someone builds a better ecosystem, and so far, no one has.
Options Plumbing and the $195 Magnet
If the fundamentals are a story of incredible growth vs. expensive valuation, the market structure is a story of dealer hedging. Right now, the options market is the tail wagging the dog. The Put/Call open interest ratio is 0.84, which is fairly balanced, but the Max Pain strike is sitting at $195.00.
For those who do not spend their time thinking about dealer gamma, Max Pain is the price at which the greatest number of options contracts expire worthless. It acts as a sort of gravitational pull for the stock price as we approach expiration. With the stock currently at $176.14, the market is sitting about 10 percent below that Max Pain magnet.
There is a significant Call Wall at $200, meaning there is a massive amount of institutional resistance at that level. On the downside, the Put Wall at $165 is the primary floor. If the “spy scandal” narrative gains more traction and we break $165, there is a liquidity air pocket that could take the stock much lower very quickly. However, as long as we stay above $165, the dealers will likely be buyers of the dip to remain delta neutral.
The expected 30-day move is roughly 18 percent in either direction. That is an enormous range for a $4 trillion company. It tells you that the market is pricing in a lot of uncertainty. This uncertainty is not just about Jensen Huang; it is about the entire AI trade. If the hyperscalers (Microsoft, Meta, Google) decide to take a “breather” on their CapEx spending, Nvidia’s revenue growth will finally hit a wall.
The spy scandal is a convenient distraction from the fact that Nvidia is a high-beta stock in a high-rate environment. If you are an institutional manager, you are probably not selling because of the affair; you are selling because you were looking for a reason to take profits on a 100 percent gain, and the news gave you one. The fundamental execution remains flawless, but the math of the 10-Year Treasury yield is an unyielding force. Until the free cash flow yield provides a real spread over risk-free debt, the stock is likely to remain in a volatile, range-bound holding pattern.
AllWallSt Investment Verdict: HOLD
NVIDIA Corporation (NVDA)
Trailing P/E
Marcus Wolfe Screen
Leverage Profile
30D Channel
Dealer Gamma Pinning & Max Pain Alignment (NVDA)
MODERATE WATCHLIST (1 flag): Inventory growth outpaced COGS growth by >15%, signaling potential inventory bloat or pending margin compression.
Fortress Balance Sheet (Net Cash Position; zero net refinancing distress).
Negative yield spread (-3.89% vs 4.88% Treasury); equity requires robust multiple expansion or growth.
Max Pain: $195.00 (+10.71%) | P/C Ratio: 0.84 | 30D Channel: $143.82 – $208.46. Dealer gamma bounded between $165 Put Wall and $200 Call Wall.
NVDA commands a massive ~7.7% S&P 500 benchmark footprint. Wall Street sell-side consensus reflects structural career-risk defense: institutional funds face severe benchmark tracking penalties for underweighting mega-cap heavyweights, forcing mandatory allocations regardless of current Free Cash Flow yield.
Accumulation Deferred (Await Pullback toward $161.70 – $168.30 Support Pinning)
Sustained weekly close below $165.00 (Put Wall) or acceleration in margin compression.
Sources & References
- Official SEC Form 10-K Annual Report (Filed 2026-02-25)
- Official SEC Form 10-Q Quarterly Report (Filed 2026-08-26)
- NVIDIA Corporation Investor Relations: https://www.nvidia.com
- SEC EDGAR Filings for NVIDIA CORP (CIK 0001045810): https://www.sec.gov/edgar/browse/?CIK=0001045810
- US Treasury 10-Year Benchmark Yield Data: https://www.treasury.gov
- Primary Exchange Options Flow Data (Nasdaq/CBOE)
Disclaimer: This report is for informational purposes only and does not constitute financial, legal, or investment advice. The author and AllWallSt are not registered investment advisors. Investing in public equities involves significant risk, including the potential loss of principal. Past performance is not indicative of future results. All data is sourced from primary regulatory filings and market feeds believed to be reliable but not guaranteed for accuracy.