
If you have been waiting since 2019 for a stainless steel triangle that looks like it was rendered on a Nintendo 64, Elon Musk might finally have some news for your bank account. Tesla, Inc. (TSLA) is reportedly returning deposits to a significant number of Cybertruck reservation holders as it winds down current production cycles. In the normal world of manufacturing, returning customer money is usually considered a sign that things have gone slightly off the rails. In the world of Tesla, it is being framed as a strategic pivot.
There is a certain institutional logic to this move. Those early reservations were essentially interest-free loans from the most loyal fan base in capital markets history. However, those loans came with an implicit contract: the promise of a vehicle at legacy pricing. By clearing the backlog and returning the cash, Tesla, Inc. effectively cancels those low-margin obligations. It allows the company to reset its pricing architecture for whatever comes next, hopefully something that does not involve the manufacturing nightmare of cold-rolled stainless steel.
The Margin of Reality
The problem for Tesla, Inc. is that while the narrative remains focused on futuristic pivots, the balance sheet is currently anchored in a very terrestrial reality. The company is trading at a forward P/E of 175.1x. For context, General Motors trades at 6.1x and Ford Motor Company trades at 6.6x. To justify a triple-digit multiple, a company generally needs to be growing at a rate that defies the laws of physics.
Tesla, Inc. is currently growing its revenue at negative 0.20% year over year.
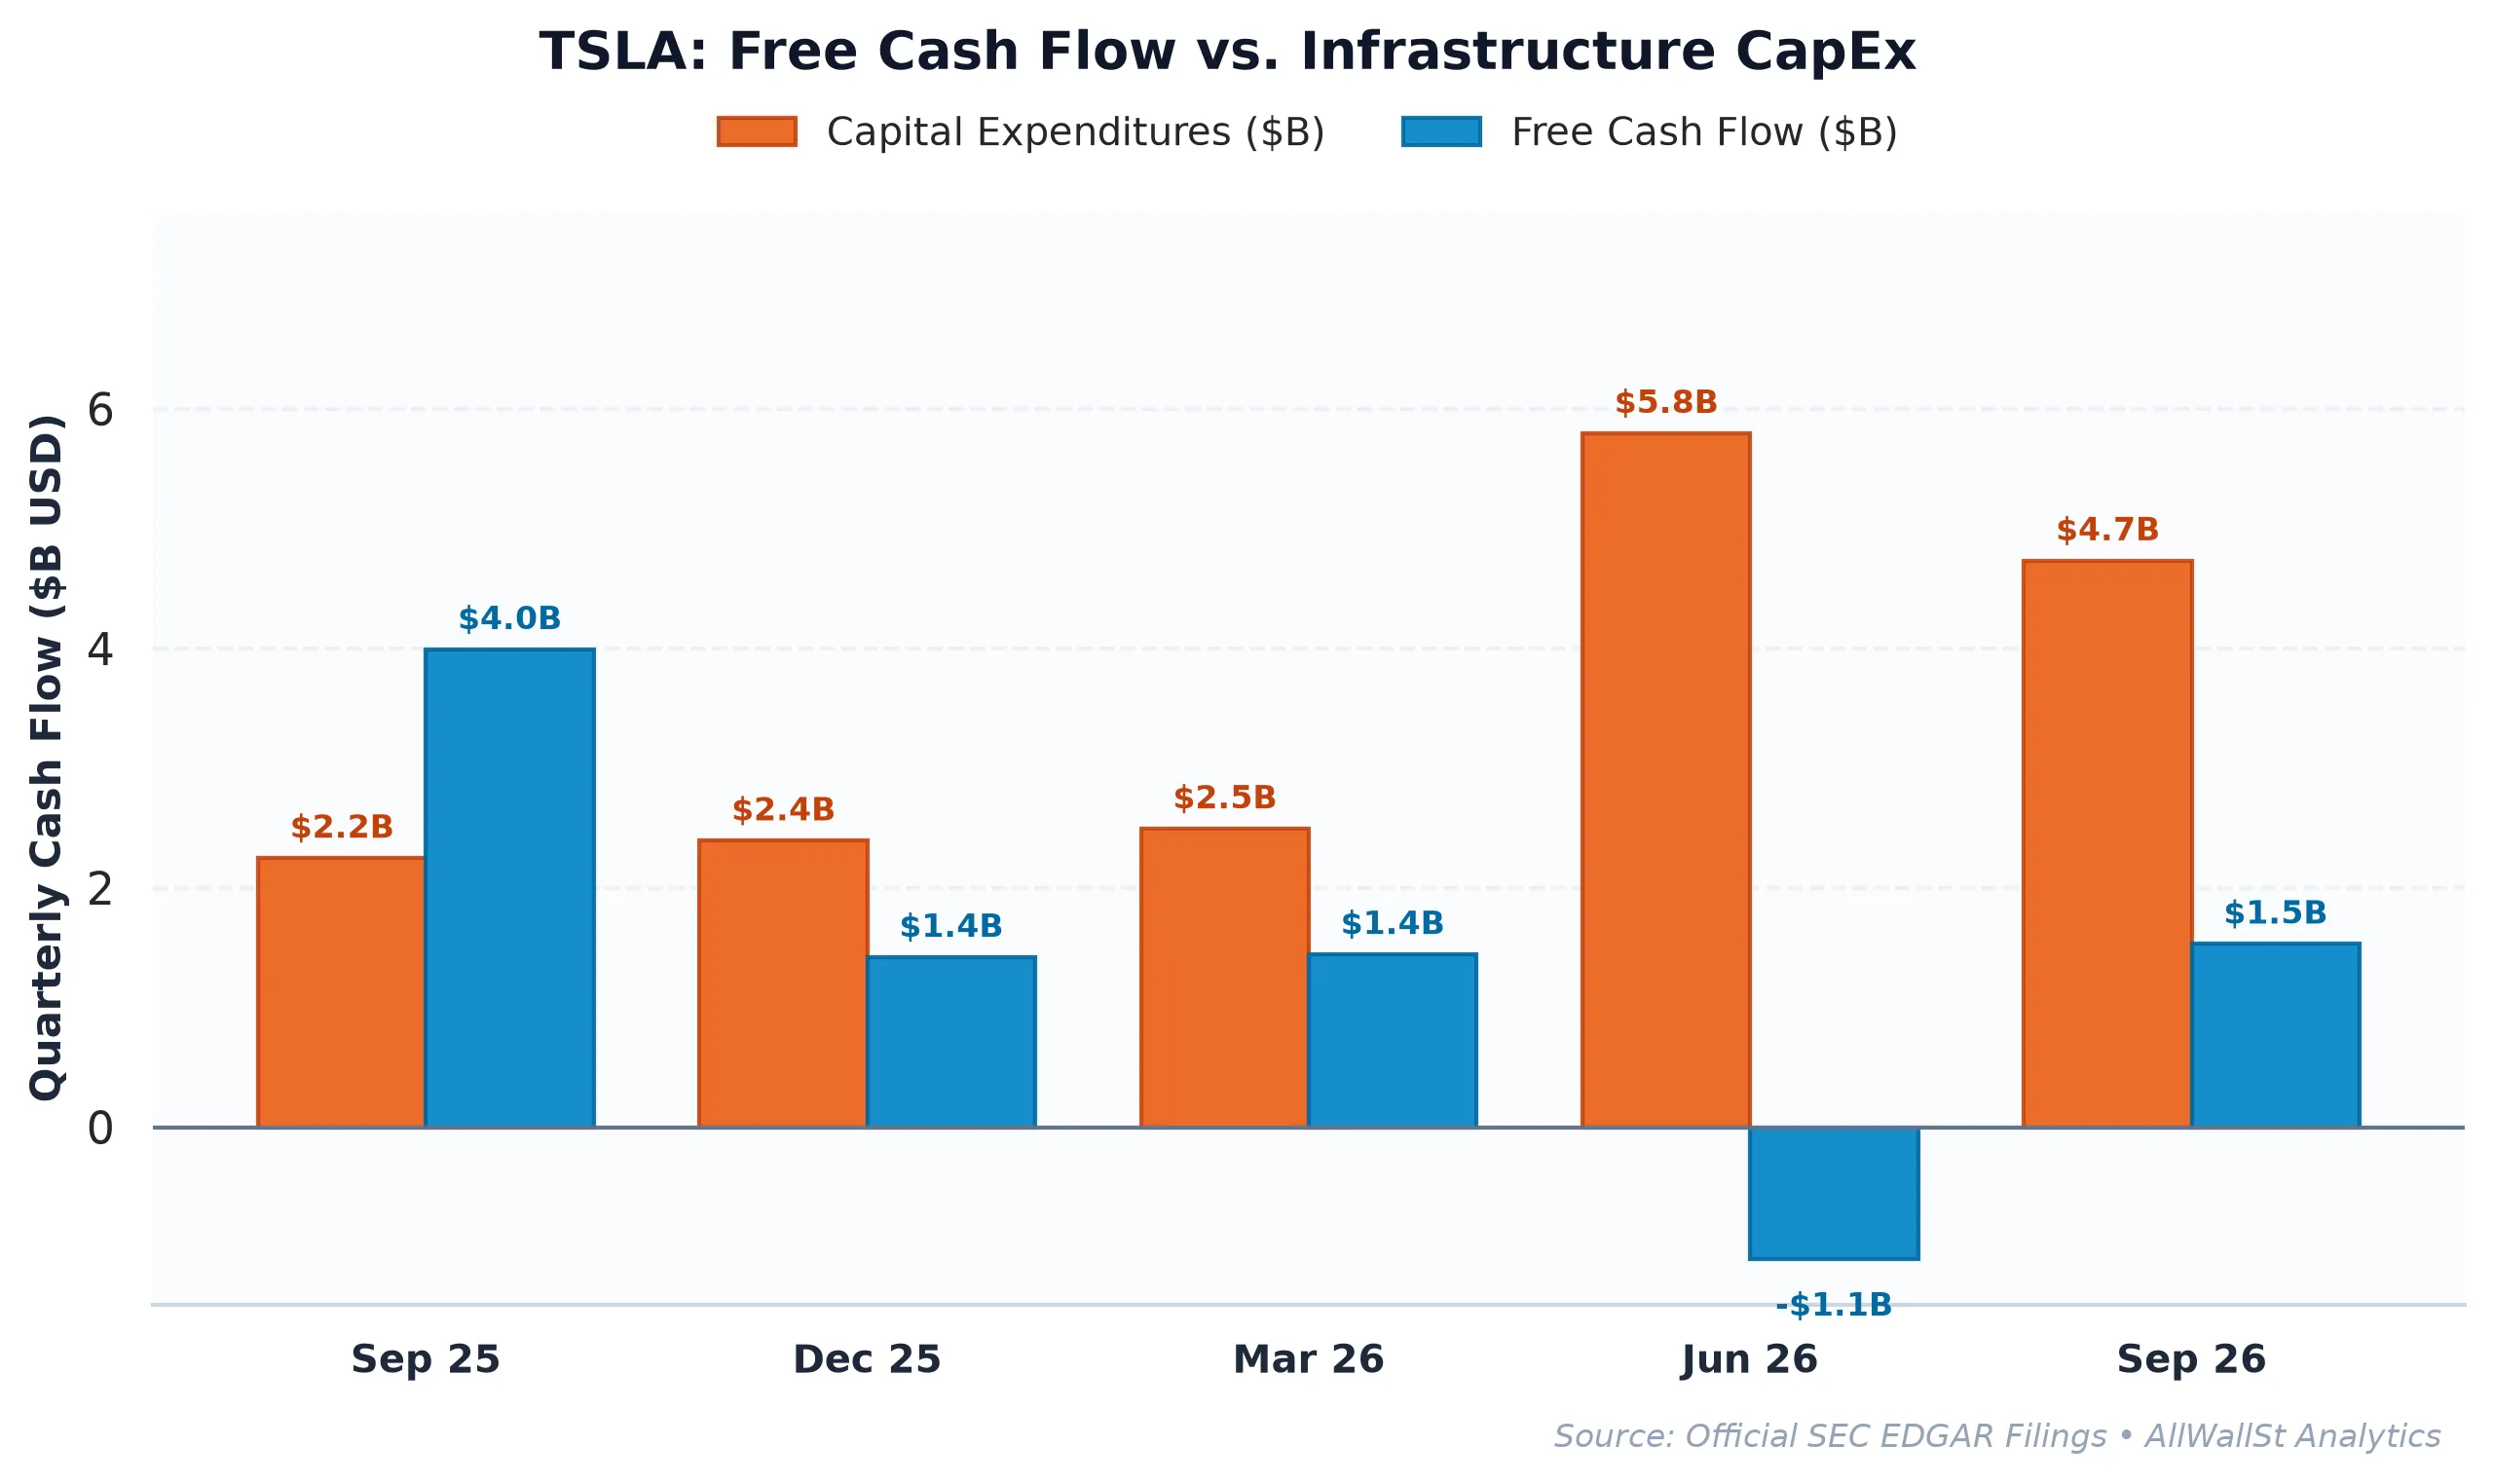
When you look at the historical trajectory, the trend is even more sobering. In 2022, Tesla, Inc. boasted an operating margin of 17.0%. By 2025, that margin has compressed to 5.1%. The company is spending $13.74B in capital expenditures to maintain a business where the Return on Invested Capital (ROIC) of 7.28% is now lower than its estimated Weighted Average Cost of Capital (WACC) of roughly 8.5%. In the language of fundamental analysis, that is the definition of value destruction.
Peer Valuation & Margin Comparison
| Company (Ticker) | Market Cap | Forward P/E | EV/EBITDA | Rev Growth (YoY) | Operating Margin | FCF Yield |
|---|---|---|---|---|---|---|
| Tesla (TSLA) | $1.49T | 175.1x | 141.0x | -0.20% | 5.36% | 0.33% |
| General Motors (GM) | $76.1B | 6.1x | 9.4x | 2.9% | 7.3% | 37.47% |
| Ford Motor (F) | $50.0B | 6.6x | 24.3x | -2.0% | 3.1% | -12.39% |
| Rivian (RIVN) | $20.4B | N/A | N/A | 38.3% | -40.9% | -10.72% |
The table above illustrates the sheer magnitude of the disconnect. General Motors is generating a Free Cash Flow (FCF) yield of 37.47% while Tesla, Inc. offers a meager 0.33%. When the US 10-Year Treasury Yield is sitting at 4.86%, an investor in Tesla, Inc. is accepting a negative spread of 4.53% for the privilege of owning equity risk. You are essentially paying the company to hold your money while they figure out how to make a cheaper car.
The Market Plumbing and the Career Risk Hedge
If the fundamentals are this disconnected, why is the stock surging? The answer lies in the plumbing of the S&P 500. Tesla, Inc. commands a 2.7% weight in the benchmark. For an institutional fund manager, being underweight Tesla, Inc. is a massive career risk. If the stock memes its way higher, the manager loses their job for underperforming the index. This creates a structural, mandatory bid that has nothing to do with the number of cars delivered or the margin on a Cybertruck door handle.
The options market reflects this defensive posture. The Put/Call Open Interest ratio is currently 1.2, indicating that institutions are heavily hedged. There is a massive Call Wall at $380 and $400, which acts as a ceiling where dealers will likely sell into any further rallies to remain delta neutral. Meanwhile, the Max Pain strike sits at $360, suggesting a magnetic pull toward that level as we approach expiration.
The 30-day expected move is a staggering +/- 12.99%. This is not the volatility profile of a stable automotive giant; it is the profile of a speculative technology proxy. Tesla, Inc. is currently spending $2.83B on stock-based compensation, which represents 15.1% of its operating cash flow. Once you strip that out, the real economic free cash flow is even thinner than the headline numbers suggest.
The Cybertruck Exit Ramp
The decision to wind down production and refund deposits is a quiet admission that the Cybertruck, in its current form, is a drag on the mission of mass-market electrification. By clearing these liabilities, Tesla, Inc. is trying to clean up its balance sheet for a new platform. However, a “new platform” requires more CapEx, and more CapEx requires more cash flow that the current business is struggling to generate at scale.
The consensus on Wall Street remains a Strong Buy, largely because of the aforementioned index gravity. But for an unconstrained investor looking at the cash, the math simply does not work. You are buying a company with declining margins, flat revenue growth, and an ROIC that cannot clear the hurdle of the risk-free rate.
AllWallSt Investment Verdict: SELL
Tesla, Inc. (TSLA)
Trailing P/E
Marcus Wolfe Screen
Leverage Profile
30D Channel
Dealer Gamma Pinning & Max Pain Alignment (TSLA)
Pristine cash flow conversion (3.89x) and healthy accrual ratio (-7.95%). Zero accounting anomalies detected (LOW ANOMALY RISK).
Fortress Balance Sheet (Net Cash Position; zero net refinancing distress).
Negative yield spread (-4.53% vs 4.86% Treasury); equity requires robust multiple expansion or growth.
Max Pain: $360.00 (-4.77%) | P/C Ratio: 1.2 | 30D Channel: $328.94 – $427.16. Dealer gamma bounded between $270 Put Wall and $380 Call Wall.
TSLA commands a massive ~2.7% S&P 500 benchmark footprint. Wall Street sell-side consensus reflects structural career-risk defense: institutional funds face severe benchmark tracking penalties for underweighting mega-cap heavyweights, forcing mandatory allocations regardless of current Free Cash Flow yield.
$372.40 – $387.60 (Call Wall Resistance Distribution Ceiling)
Sustained weekly close above $380.00 (Call Wall Resistance) or structural rebound in GAAP Free Cash Flow.
Sources & References
-
Tesla, Inc. Investor Relations: https://www.tesla.com/ir
- SEC EDGAR Filings (CIK 0001318605): https://www.sec.gov/edgar/browse/?CIK=0001318605
- Tesla, Inc. Form 10-Q (Filed October 22, 2026): SEC Filing Link
Disclaimer: This report is for informational purposes only and does not constitute financial advice. The author and AllWallSt are not registered investment advisors. Investing in equities involves significant risk. All data is sourced from primary SEC filings and exchange feeds; however, historical performance is not indicative of future results.