
⚡ Executive Morning Takeaways
- Overnight Futures & Rates Impulse: Equity futures are showing a bifurcated tape with E-Mini S&P 500 (ES=F) flat at +0.06% while Nasdaq 100 (NQ=F) slips -0.26%. The 10-Year Treasury yield (^TNX) remains the primary gravity well for valuations, holding firm at 4.86%.
- Sector Rotation Leaders & Laggards: Institutional flows are aggressively favoring Industrials (XLI) and Technology (XLK), both up over 3.7%, while defensive pockets like Consumer Staples (XLP) and Energy (XLE) are seeing relative neglect as capital seeks growth-adjusted duration.
- Primary Corporate Catalyst: Newmont Corporation (NEM) is under pressure in pre-market trading, down -2.21% to $122.40. Despite a robust 7.04% Free Cash Flow yield, the options market shows a speculative long skew that may be vulnerable to dealer-driven liquidation if the spot price fails to clear the $128.00 Max Pain magnet.
🌐 Pre-Market Macro, Futures & Rates Dashboard
| Asset / Benchmark | Ticker | Current Price / Level | Change (%) | 52-Week Low | 52-Week High |
|---|---|---|---|---|---|
| E-Mini S&P 500 Futures (ES=F) | ES=F | $7578.75 | +0.06% | $6353.25 | $7897.50 |
| E-Mini Nasdaq 100 Futures (NQ=F) | NQ=F | $27942.50 | -0.26% | $22961.50 | $31616.50 |
| S&P 500 (SPY) | SPY | $752.69 | +2.37% | $629.28 | $781.62 |
| Nasdaq 100 (QQQ) | QQQ | $679.35 | +3.54% | $555.60 | $762.86 |
| Russell 2000 (IWM) | IWM | $282.51 | +3.23% | $228.90 | $305.18 |
| 20+ Year Treasury (TLT) | TLT | $81.96 | +0.05% | $76.43 | $90.86 |
| High Yield Corporate (HYG) | HYG | $77.51 | +0.36% | $76.39 | $81.24 |
| Gold (GLD) | GLD | $379.53 | +1.88% | $354.67 | $509.70 |
| WTI Crude Oil (CL=F) | CL=F | $85.87/bbl | -1.13% | $54.98 | $119.48 |
| US Dollar Index Bullish (UUP) | UUP | $28.97 | -0.55% | $26.40 | $29.25 |
| CBOE Volatility Index (^VIX) | ^VIX | 20.04 | +0.60% | 13.38 | 35.30 |
| 2-Yr US Treasury Yield (2YY=F) | 2YY=F | 4.75% | +0.00% | 3.38% | 4.88% |
| 10-Yr US Treasury Yield (^TNX) | ^TNX | 4.86% | +0.10% | 3.96% | 5.36% |
The macro environment remains a tug-of-war between a resilient US dollar and a bond market that refuses to yield its high-ground. With the 10-Year Treasury yield at 4.86%, the equity risk premium is essentially non-existent for the broader S&P 500. This forces institutional desks to hunt for idiosyncratic cash flow stories or deep-value materials plays that can outpace the cost of carry. Gold (GLD) is showing some life with a +1.88% move, which usually provides a tailwind for miners, but the pre-market weakness in Newmont Corporation suggests that investors are more concerned with operational execution than spot price momentum.
📊 Sector Rotation Leaders & Laggards
| Rotation Rank | Sector ETF | Ticker | Price | Change (%) | Trailing P/E | Dividend Yield | 52-Week Low | 52-Week High |
|---|---|---|---|---|---|---|---|---|
| Leader (#1) | Industrials (XLI) | XLI | $168.89 | +3.82% | 27.1x | 1.13% | $147.14 | $188.19 |
| Leader (#2) | Technology (XLK) | XLK | $170.88 | +3.73% | 30.1x | 0.47% | $126.68 | $203.25 |
| Leader (#3) | Consumer Discretionary (XLY) | XLY | $121.01 | +2.92% | 25.3x | 0.81% | $105.19 | $125.01 |
| Spotlight Sector | Materials (XLB) | XLB | $52.94 | +1.91% | 22.0x | 1.64% | $42.22 | $54.63 |
| Laggard (#8) | Financials (XLF) | XLF | $57.99 | +1.45% | 15.7x | 1.46% | $47.67 | $60.04 |
| Laggard (#9) | Consumer Staples (XLP) | XLP | $90.89 | +0.90% | 24.5x | 2.46% | $75.93 | $93.40 |
| Laggard (#10) | Energy (XLE) | XLE | $61.94 | +0.52% | 15.5x | 2.18% | $43.77 | $70.15 |
Valuation dispersion is becoming the defining characteristic of this tape. Technology (XLK) is trading at a lofty 30.1x P/E, a massive premium to the broader market, while Energy (XLE) languishes at 15.5x. Materials (XLB) are currently caught in the middle, offering a 1.64% dividend yield and a 22.0x multiple. The rotation into Industrials suggests a bet on domestic CAPEX cycles, but the relative weakness in Financials (XLF) indicates that the market is still skeptical about the steepness of the yield curve and the health of the underlying consumer credit cycle.
⏱️ Today’s Earnings & Economic Radar
Imminent Corporate Earnings Releases
| Company / Ticker | Timing | Consensus EPS | Consensus Revenue | Key Strategic Theme |
|---|---|---|---|---|
| CoreWeave (CRWV) | Today (Nov 10) | -$1.21 | $3.54B | GPU Cloud Capacity Contracts & Sovereign Infrastructure CapEx |
| Constellation Energy (CEG) | Yesterday (Reported Nov 09) | N/A | $6.95B | Nuclear PPAs & Hyperscaler Data-Center Colocation |
| Applied Materials (AMAT) | Nov 12 (Scheduled) | $4.06 | $10.30B | Gate-All-Around (GAA) & Advanced Packaging Equipment Spend |
| Cisco Systems (CSCO) | Nov 12 (Scheduled) | $1.32 | $18.12B | Enterprise AI Ethernet Switching & Splunk Security ARR |
| Walt Disney (DIS) | Nov 17 (Scheduled) | $1.69 | $25.15B | Direct-to-Consumer Streaming Operating Income & Parks DTC Demand |
| Home Depot (HD) | Nov 17 (Scheduled) | $3.84 | $42.76B | Pro-Contractor Backlog vs High-Rate Big-Ticket Remodeling |
High-Impact Economic Data & Central Bank Actions
| Time (ET) | Event | Impact | Key Institutional Focus |
|---|---|---|---|
| 06:00 AM | NFIB Small Business Optimism Index | HIGH | Small-Cap Hiring Plans & Credit Costs |
| 01:00 PM | US 3-Year Treasury Note Auction | HIGH | Primary Dealer Takedown & Foreign Indirects |
| 04:30 PM | API Weekly Crude Oil Stock Estimate | MEDIUM | Energy Supply Cushion |
The 1:00 PM US 3-Year Treasury Note Auction is the high-stakes macro event of the day. If primary dealers are forced to take down a larger-than-expected portion of the supply, expect yields to drift higher, putting further pressure on high-multiple equities. On the corporate earnings tape, CoreWeave’s (CRWV) print today will benchmark cloud infrastructure margins, while Cisco’s (CSCO) report on Thursday provides essential visibility into enterprise networking capex.
🎯 Pre-Market Spotlight: Newmont Corporation (NEM)
Newmont Corporation (NEM) is essentially the adult in the room of the gold mining sector. While its peers often behave like high-beta exploratory lotto tickets, Newmont has transitioned into a capital-allocation machine. With an operating margin of 49.99% and a Return on Invested Capital (ROIC) of 32.53%, the company is handily outearning its 8.5% cost of capital. In a world where many miners struggle to generate a single dollar of free cash after accounting for sustaining CAPEX, Newmont’s 7.04% FCF yield is a statistical anomaly. It offers a +2.17% spread over the 10-Year Treasury, which is a rare feat in the current materials landscape.
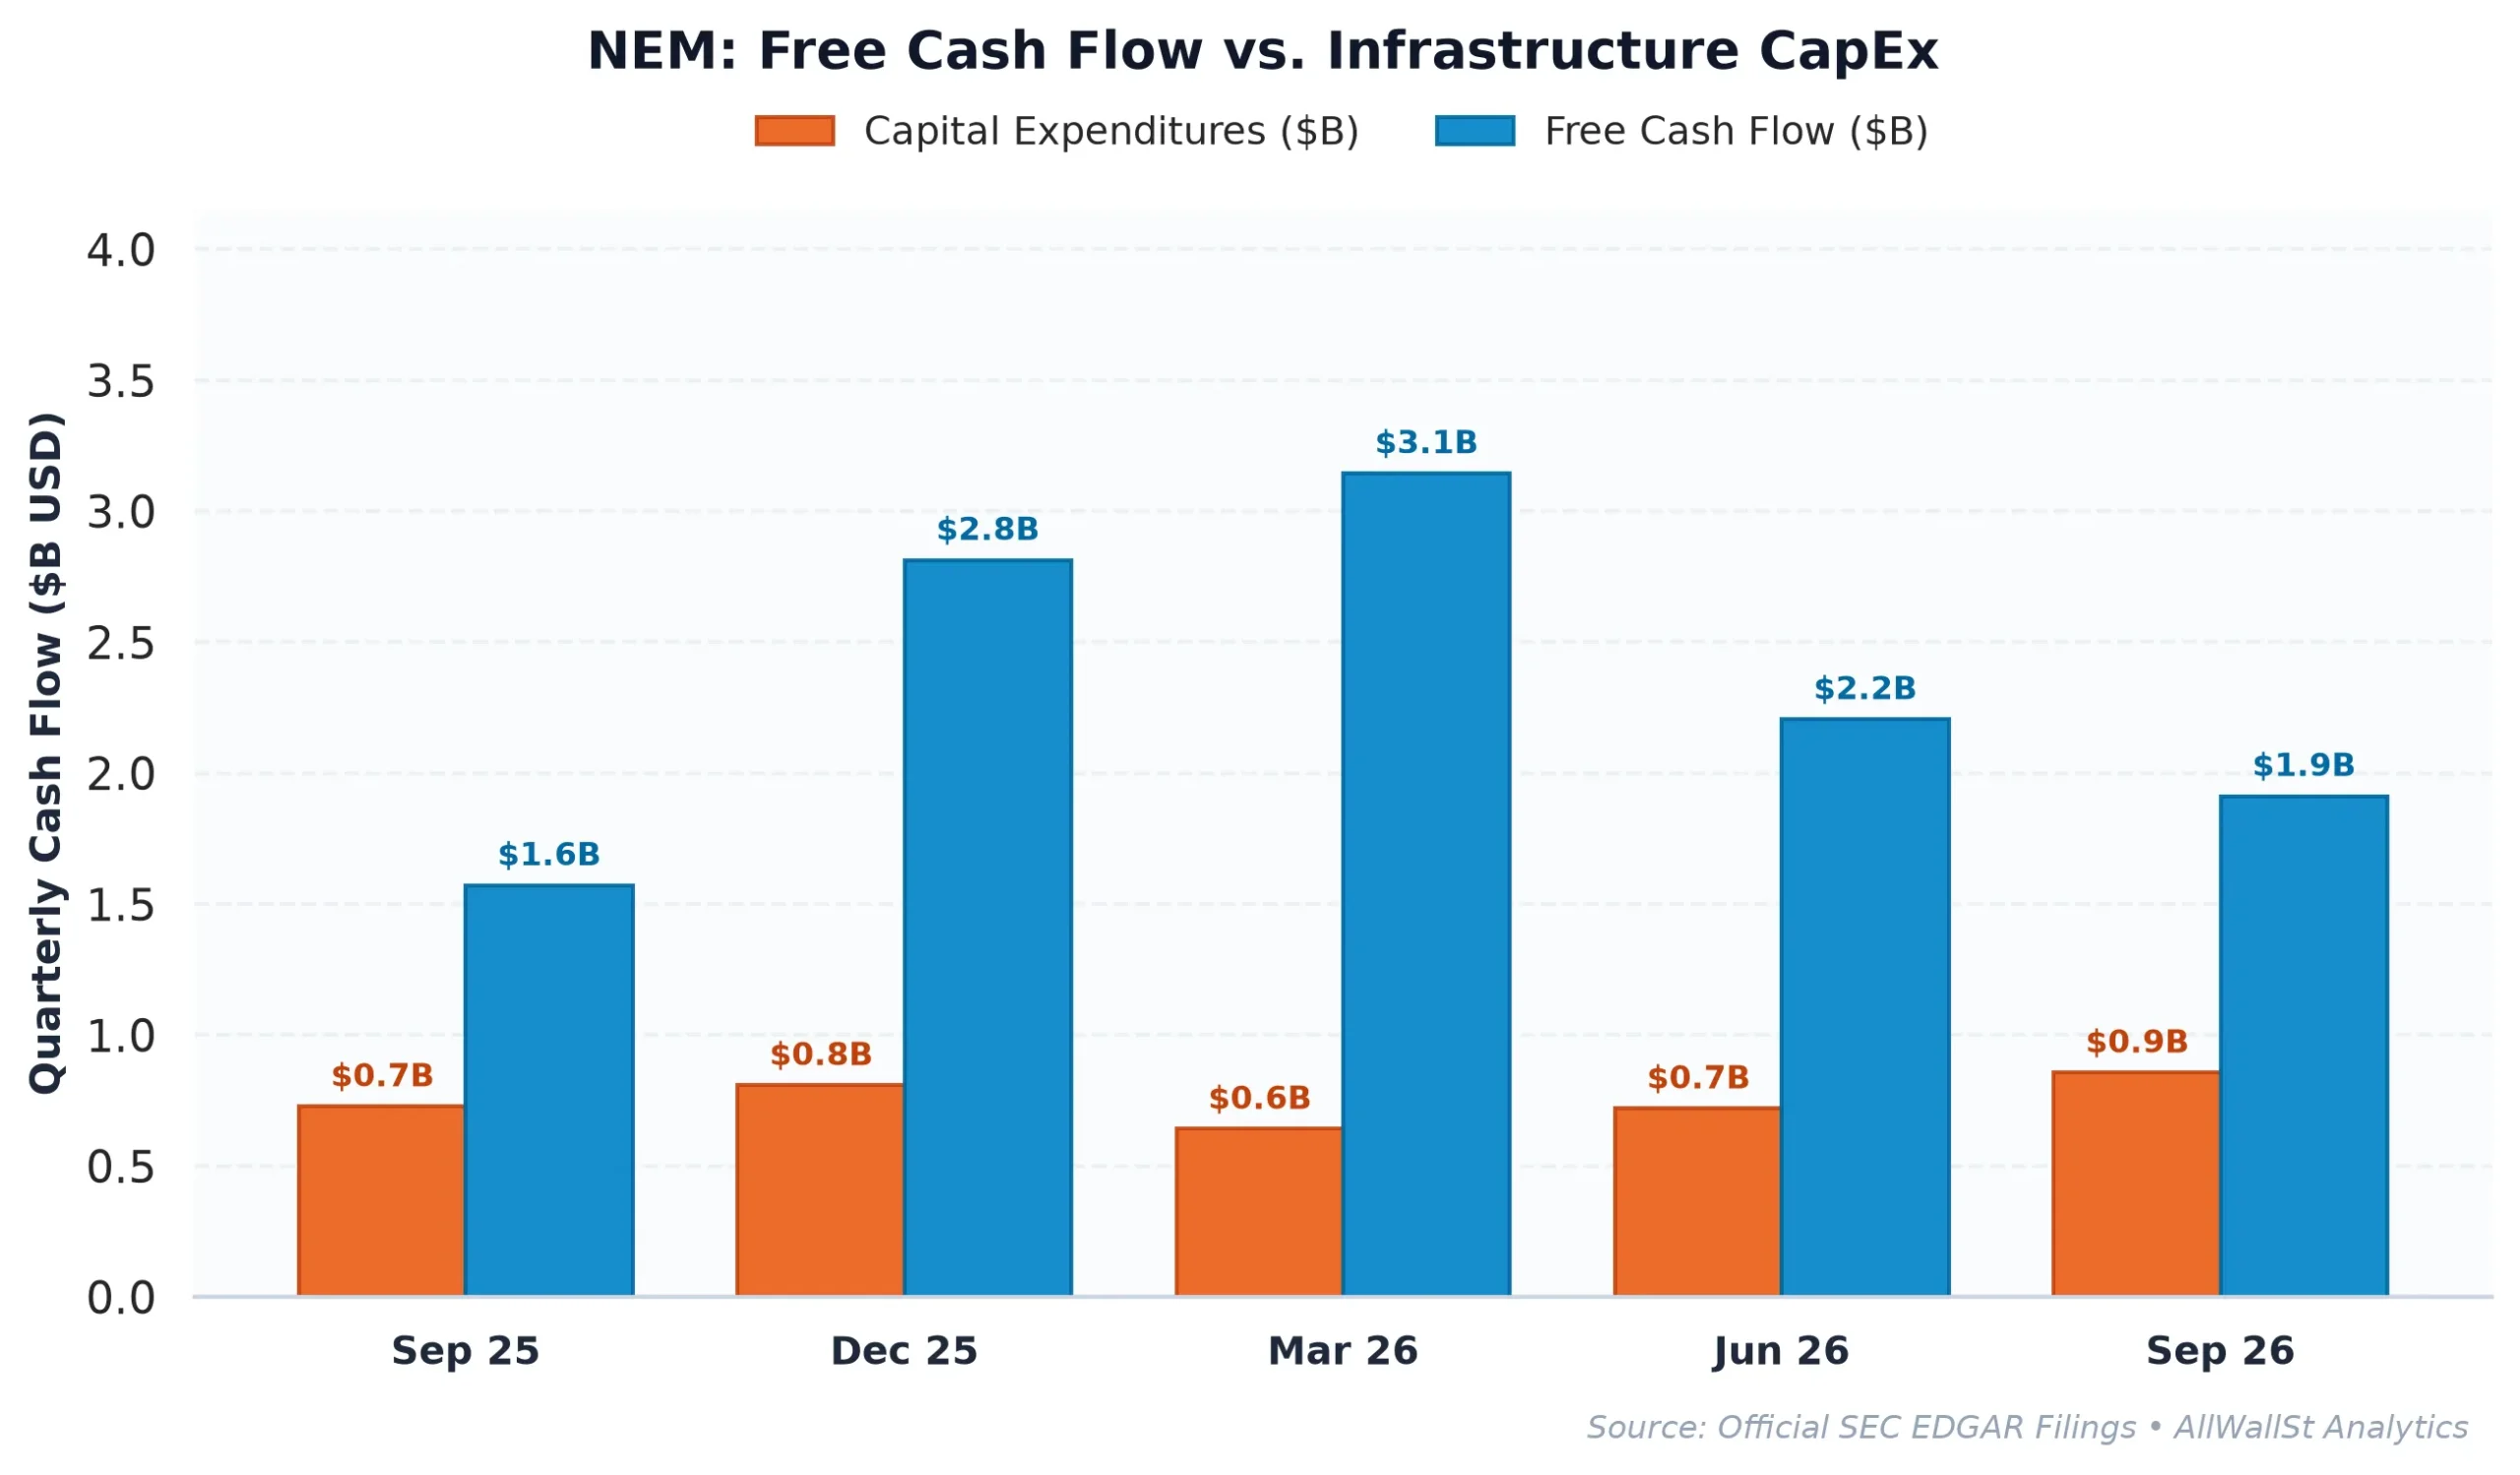
The fundamental trajectory is undeniably positive. Revenue grew 15.2% year-over-year, and the company has managed to maintain a net cash position of $3.24 billion. When compared to Agnico Eagle Mines (AEM), which carries a higher forward P/E of 17.2x and a much lower FCF yield of 3.69%, Newmont looks like a bargain. Even Freeport-McMoRan (FCX), the copper-heavy favorite of the materials complex, trades at a higher multiple (14.6x) with significantly lower cash returns (2.09% FCF yield). Newmont’s Rule of 40 score of 49.6% places it in an elite tier of operational efficiency usually reserved for high-margin software firms, not companies that dig holes in the ground.
However, the market structure tells a more cautionary story. The options market is currently leaning into a speculative long skew with a Put/Call Open Interest ratio of just 0.05. This level of call concentration often acts as a ceiling rather than a floor. Dealers are currently long gamma against a massive $133 Call Wall, meaning they will likely sell into any strength to remain delta neutral. With the Max Pain strike sitting at $128.00, roughly 2.27% above the current spot, there is a magnetic pull toward that level, but the pre-market dip to $122.40 suggests we might test downside support first.
The tension here is between Newmont’s impeccable balance sheet and the macro reality of a 4.86% risk-free rate. While the company is returning capital through a 2.6% total shareholder yield (dividends plus buybacks), it is still a materials play in a cycle that is currently obsessed with AI infrastructure and industrial automation. Wall Street’s Market Weight consensus reflects a lack of conviction that gold can provide a meaningful hedge while real rates remain positive. Until the price action can convincingly clear the $133 Call Wall or we see a meaningful flush of the speculative call overhang, we remain disciplined.
AllWallSt Investment Verdict: HOLD
Newmont Corporation (NEM)
Trailing P/E
Marcus Wolfe Screen
Leverage Profile
30D Channel
Dealer Gamma Pinning & Max Pain Alignment (NEM)
MODERATE WATCHLIST (1 flag): Inventory growth outpaced COGS growth by >15%, signaling potential inventory bloat or pending margin compression.
Fortress Balance Sheet (Net Cash Position; zero net refinancing distress).
Favorable equity risk premium (+2.17% FCF yield spread over 4.86% US 10-Yr Treasury benchmark).
Max Pain: $128.00 (+2.27%) | P/C Ratio: 0.05 | 30D Channel: $120.68 – $129.64. Dealer gamma bounded between $125 Put Wall and $133 Call Wall.
NEM carries standard index weighting (< 0.6% SPY footprint); sell-side consensus reflects standard earnings momentum rather than index-tracking mandates.
Accumulation Deferred (Await Pullback toward $122.50 – $127.50 Support Pinning)
Sustained weekly close below $125.00 (Put Wall) or acceleration in margin compression.
Sources & References
- Official SEC Form 10-K Annual Report (Filed 2026-02-19)
-
Newmont Corporation Investor Relations: https://www.newmont.com
- SEC EDGAR Filings for Newmont Corp (CIK 0001164727): https://www.sec.gov/edgar/browse/?CIK=0001164727
- Primary Exchange Feed: https://www.nasdaq.com/market-activity/stocks/nem
Disclaimer: This report is for informational purposes only and does not constitute financial, legal, or investment advice. AllWallSt and its analysts are not registered investment advisors. Investing in public equities involves significant risk. Past performance is not indicative of future results.