
The prevailing wisdom on Wall Street today, specifically the brand of wisdom dispensed in shiny PDF reports from firms like Wells Fargo, is that CoreWeave, Inc. (CRWV) is the highest quality neocloud operator in the known universe. This is a very specific kind of praise. It is like being called the healthiest person in a Victorian hospital. Being the best neocloud means you have successfully convinced the market that renting out NVIDIA chips is a structural moat rather than a capital intensive commodity business. As the company prepares to report its quarterly results today, November 10, 2026, the consensus narrative is one of unbridled optimism. The story is simple: AI demand is infinite, CoreWeave has the chips, and therefore CoreWeave is a winner.
The way this actually works, if you look at the plumbing, is a bit more complicated. CoreWeave does not just buy chips. It borrows incredible amounts of money to buy those chips, secures that debt with the chips themselves, and then hopes that the rental income from those chips exceeds the interest on the debt plus the inevitable depreciation of the hardware. It is a massive, leveraged carry trade on silicon. While the market focuses on the 112.5% revenue growth, the balance sheet is screaming about a $51.6 billion debt pile and a free cash flow yield that sits at negative 34.37%. In a world where the 10-Year Treasury yield is 5.01%, paying a premium for a company that loses thirty-four cents for every dollar of equity value is a bold choice.
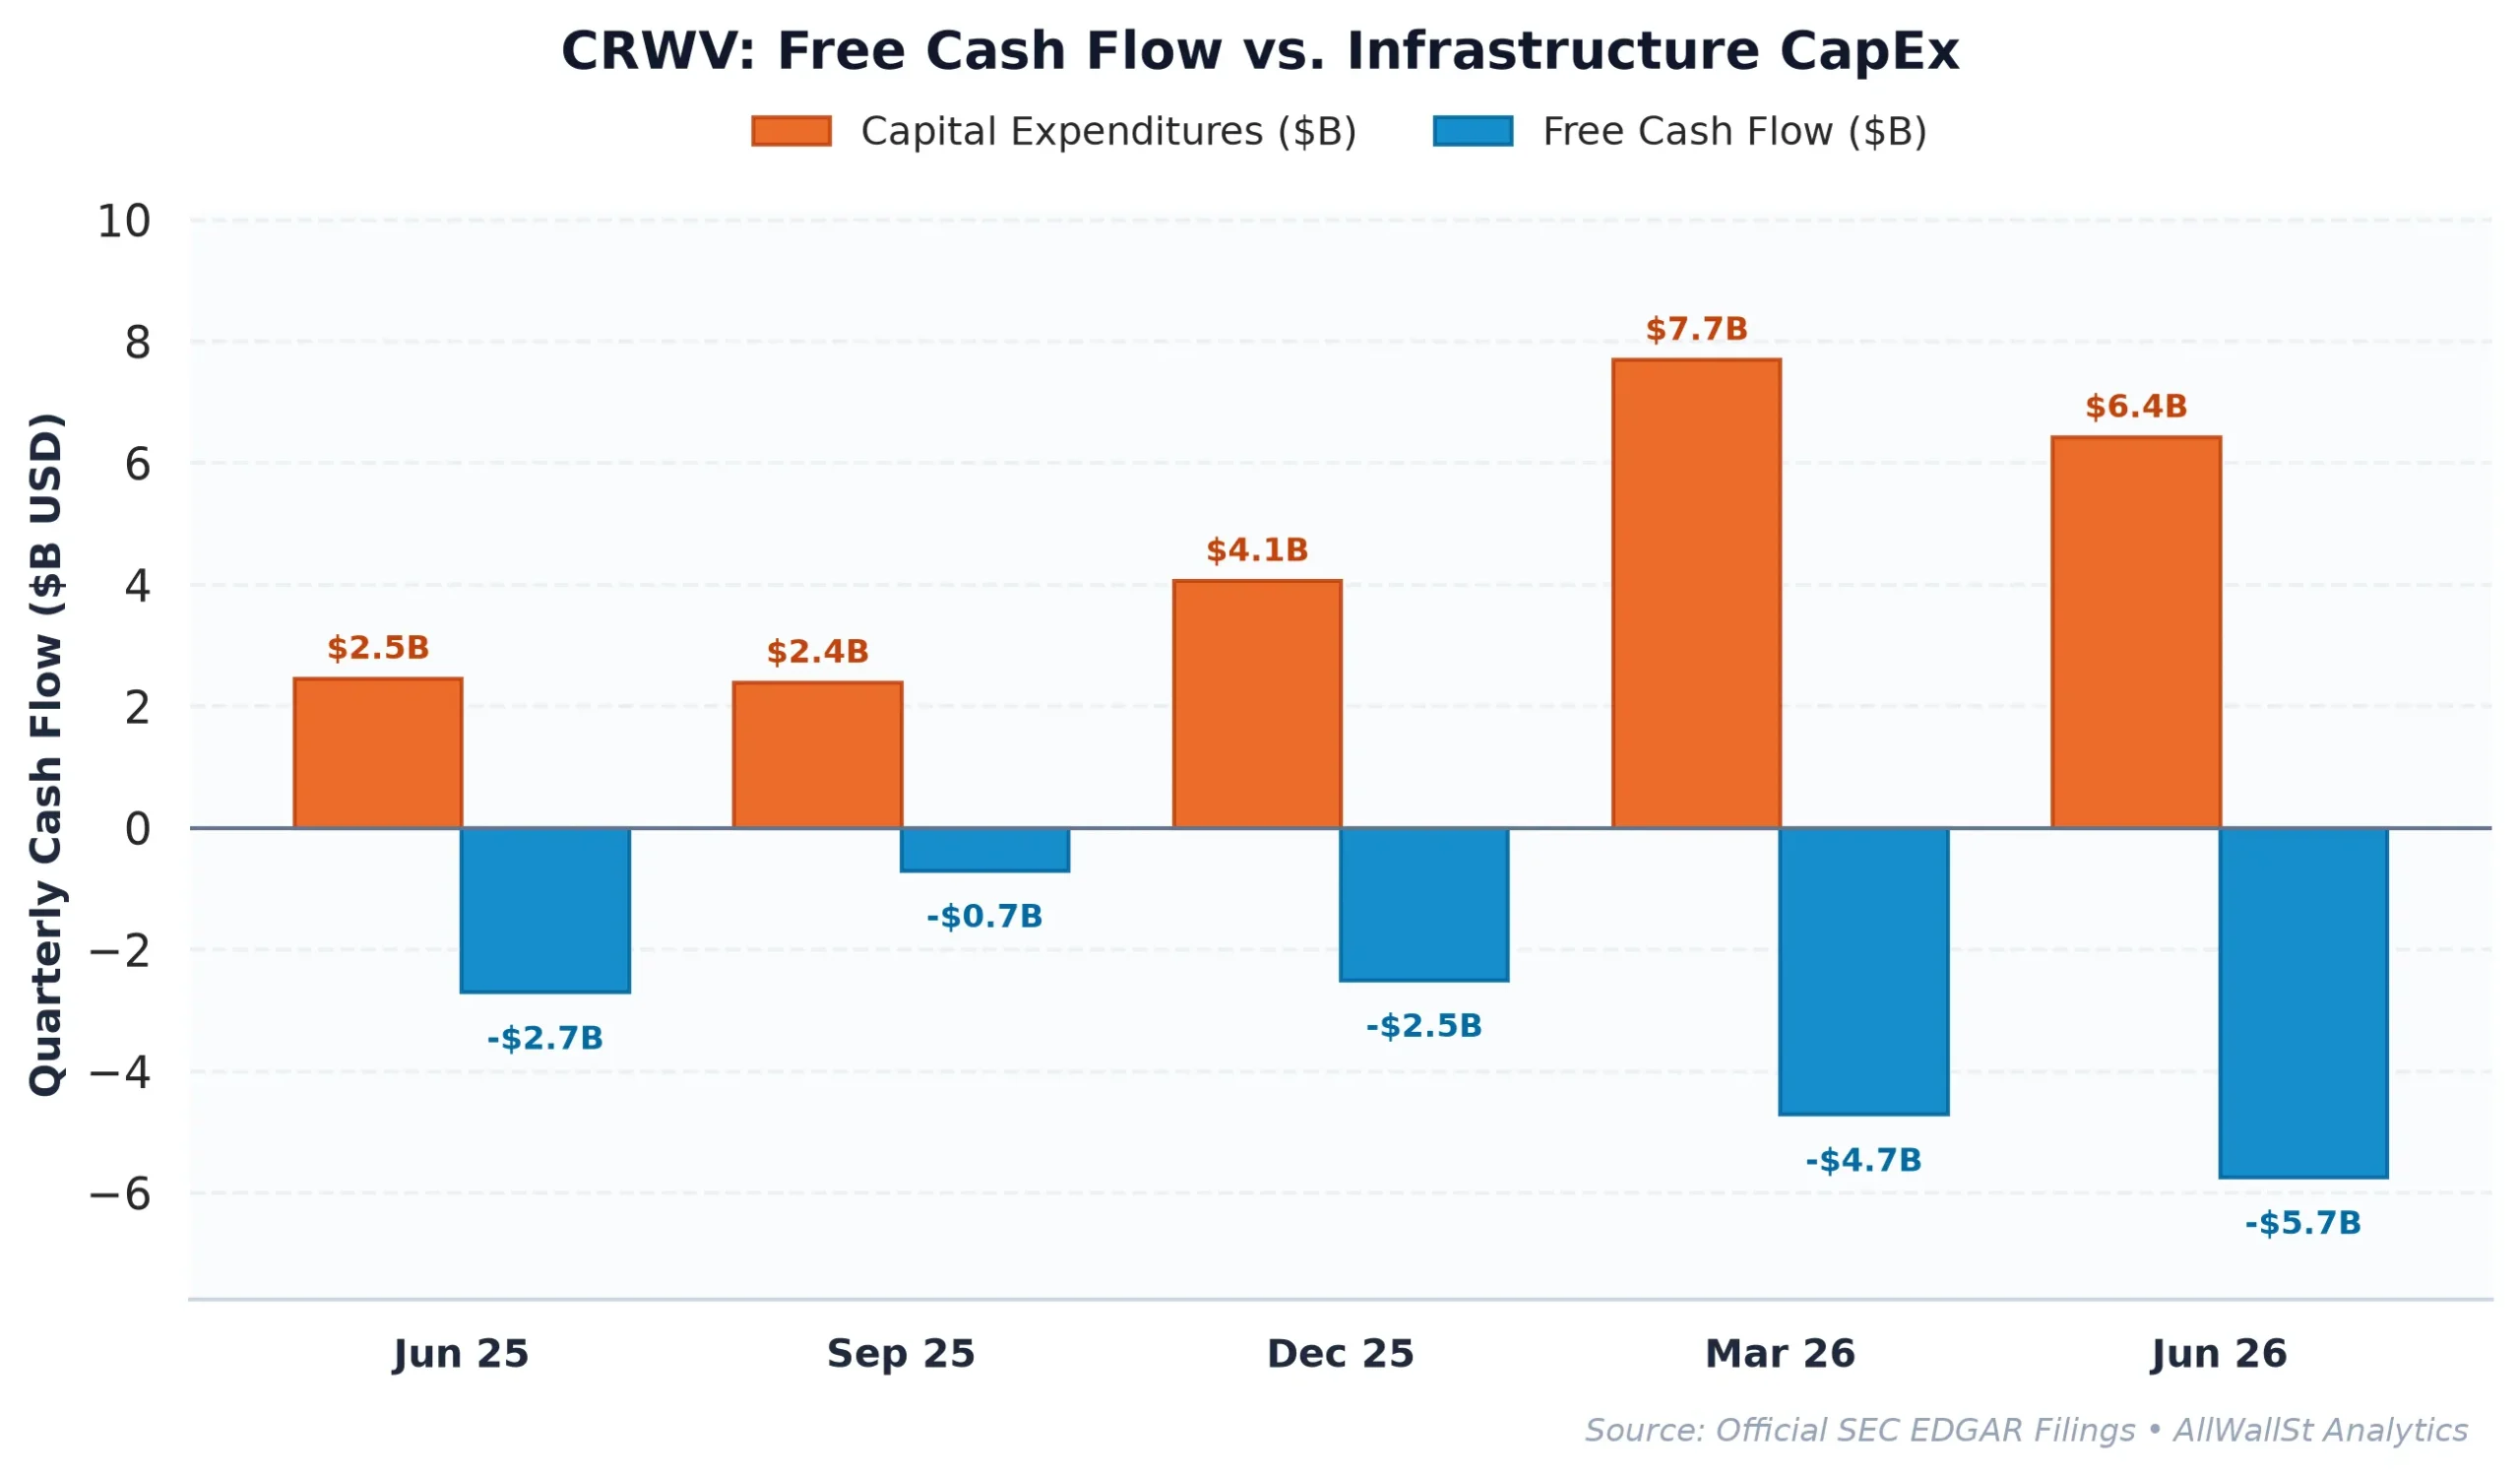
The Unit Economics of a Leveraged GPU Mine
To understand CoreWeave, you have to look at the trajectory of its spending. In fiscal year 2022, the company was a rounding error with $15.8 million in revenue. By 2025, that figure exploded to $5.13 billion. That is the kind of growth that makes venture capitalists weep with joy. However, the cost of that growth is etched into the cash flow statement. In 2022, free cash flow was negative $71.5 million. By 2025, it had cratered to negative $7.25 billion. The company is currently spending $16 billion on capital expenditures, which represents 210.8% of its total revenue. For every dollar CoreWeave brings in, it spends more than two dollars on new hardware.
This would be fine if the return on that invested capital was high. But the ROIC currently stands at negative 0.23%. When your cost of capital is roughly 8.5% and your return on that capital is zero, you are not creating value: you are destroying it at a record-breaking pace. The bull case relies on the idea that this CapEx is a front-loaded investment that will eventually turn into a high-margin annuity. But hardware depreciates. A GPU cluster is not a software license: it is a physical asset that gets slower and less efficient every month.
The company’s recent SEC filings, including the Form 8-K filed on September 22, 2026, detail unregistered sales of equity securities. This is institutional code for dilution. When you cannot fund your operations through cash flow, and your debt levels are already at 12.1x EBITDA, you have to sell pieces of the ship to keep the engines running. Stock-based compensation has also ballooned to $630 million, representing a significant drag on real economic value. If you strip out the SBC, the real free cash flow yield is an even more harrowing negative 36.76%.
| Period | Revenue | Operating Income | Operating Margin | Free Cash Flow | SBC Expense |
|---|---|---|---|---|---|
| FY2022 | $15.8M | $-22.9M | -144.5% | $-71.5M | $1.5M |
| FY2023 | $229.0M | $-14.0M | -6.1% | $-1.11B | $15.0M |
| FY2024 | $1.92B | $324.0M | 16.9% | $-5.95B | $31.0M |
| FY2025 | $5.13B | $-46.0M | -0.9% | $-7.25B | $630.0M |
Peer Valuations and the Neocloud Premium
The market is currently valuing CoreWeave at an enterprise value of $73 billion. To justify this, enthusiasts point to its growth relative to the hyperscalers. But the comparison is flawed. Microsoft and Alphabet have massive, cash-generating monopolies (Office, Search, Cloud) that fund their AI ambitions. CoreWeave only has the AI ambitions. When you compare CoreWeave to its peers, the valuation disconnect becomes even more apparent.
| Company (Ticker) | Market Cap | Forward P/E | EV/EBITDA | Rev Growth (YoY) | Operating Margin | FCF Yield |
|---|---|---|---|---|---|---|
| CoreWeave (CRWV) | $26.4B | N/A | 19.3x | 112.50% | -1.90% | -34.37% |
| Microsoft (MSFT) | $4.03T | 22.4x | 20.0x | 18.8% | 49.8% | 0.07% |
| Alphabet (GOOGL) | $3.53T | 18.6x | 18.6x | 24.7% | 31.8% | -0.03% |
| Oracle (ORCL) | $367.3B | 10.6x | 14.5x | 29.6% | 35.6% | -12.48% |
Microsoft trades at 20x EBITDA while generating an operating margin of nearly 50%. CoreWeave trades at 19.3x EBITDA while losing money on an operating basis. You are essentially paying a hyperscaler multiple for a business that has none of the hyperscaler’s defensive characteristics. Even Oracle, which has been aggressively building out its own GPU cloud, maintains a 35.6% operating margin. CoreWeave’s negative 1.90% margin suggests that the “neocloud” advantage is mostly a marketing term for “we are willing to take more risk with debt than the big guys.”
The bull thesis also ignores the sovereign benchmark. The equity risk premium for CoreWeave is deeply negative. When you can get 5.01% from a 10-Year Treasury, the hurdle for a speculative, debt-heavy tech firm is incredibly high. CoreWeave is currently providing a spread of negative 39.39% against that benchmark. In any other era of financial history, a company with these metrics would be viewed as a distressed credit play. In 2026, it is called a “highest quality” growth story.
Options Plumbing and the Volatility Trap
As we head into the earnings release today, the options market is pricing in absolute chaos. The at-the-money implied volatility is 167.48%. This implies a 30-day expected move of roughly 48% in either direction. For a $26 billion market cap company, that is an extraordinary amount of uncertainty. The market is not betting on a standard earnings beat or miss: it is betting on a binary outcome regarding the company’s ability to service its debt and maintain its growth trajectory.
The Max Pain strike is currently at $55, which is about 14.7% above the current price of $47.94. This suggests that dealers are positioned to benefit if the stock rallies toward that level, as it would cause the maximum number of options to expire worthless. However, there is a massive Put Wall at $44 and $40. If the earnings report contains any hint of a slowdown in demand or a spike in interest costs, the stock could easily slip into a short gamma regime. In that scenario, dealers who are long puts would be forced to sell the underlying stock to hedge their delta, accelerating any downward move.
We previously held a HOLD rating on CoreWeave back in October when the stock was at $77.81. Since then, the stock has fallen significantly, but the fundamental picture has worsened. The net debt has climbed to $46.07 billion. The interest expense on that debt is becoming a structural headwind that revenue growth alone cannot solve. The “GPU debt machine” we identified last month is now running at maximum capacity, and the friction is starting to show in the margins.
The consensus view is that CoreWeave is an indispensable part of the AI ecosystem. Our view is that CoreWeave is a highly leveraged service provider in a sector where the cost of hardware is the primary constraint. If the hyperscalers (Microsoft, Amazon, Google) decide to prioritize their own internal silicon or if the rental rates for H100s/B200s soften even slightly, CoreWeave’s capital structure will become a noose. The company is currently a bet on a single variable: that the price of compute stays high enough to cover the interest on $51 billion of debt. That is not an investment: it is a gamble.
AllWallSt Investment Verdict: SELL (Downgrade from HOLD)
CoreWeave, Inc. (CRWV)
Trailing P/E
Marcus Wolfe Screen
Leverage Profile
30D Channel
Dealer Gamma Pinning & Max Pain Alignment (CRWV)
MODERATE WATCHLIST (1 flag): Receivables growth outstripped revenue growth by >15%, pointing to potential revenue recognition or collection friction.
Elevated Leverage (12.16x Net Debt/EBITDA); balance sheet requires structural deleveraging.
Negative yield spread (-39.39% vs 5.01% Treasury); equity requires robust multiple expansion or growth.
Max Pain: $55.00 (+14.73%) | P/C Ratio: 0.92 | 30D Channel: $24.92 – $70.96. Dealer gamma bounded between $44 Put Wall and $60 Call Wall.
CRWV operates with negligible index gravitational pull. Sell-side ratings reflect pure idiosyncratic fundamental consensus without passive indexing distortion.
$58.80 – $61.20 (Call Wall Resistance Distribution Ceiling)
Sustained weekly close above $60.00 (Call Wall Resistance) or structural rebound in GAAP Free Cash Flow.
Sources & References
- Official SEC Form 10-K Annual Report (Filed 2026-03-02)
- CoreWeave Investor Relations
- SEC EDGAR: CoreWeave, Inc. (CIK 0001769628)
- SEC Form 10-Q (Filed August 12, 2026)
- SEC Form 8-K (Filed September 22, 2026)
Regulatory Disclaimer: AllWallSt is a financial publisher, not a registered investment advisor. This analysis is provided for informational purposes only and does not constitute a recommendation to buy or sell any security. Investing in equities and options involves significant risk, including the potential loss of principal. Multiples, yields, and market data are subject to rapid change. Always consult with a qualified financial professional before making investment decisions. All data sourced from primary SEC filings and exchange feeds.