
The thing about being JPMorgan Chase & Co. (JPM) is that you are essentially the house in a casino where the rules are written in your favor, and occasionally, the floor manager comes out to tell everyone that the building might be on fire. Jamie Dimon, the aforementioned manager, has spent much of the last two years warning about “storm clouds” and “inflationary pressures,” even as his bank continued to print net income figures that suggest the sun is shining quite brightly on 270 Park Avenue.
Today provided another one of those moments. US inflation data came in hotter than the consensus expected, leading to a minor panic in the Treasury market. Yields jumped, the 10-Year Treasury benchmark moved toward 4.98 percent, and investors began recalibrating for a world where the Federal Reserve stays “higher for longer.” In most sectors, this is a problem. If you are a software company trading at thirty times revenue, higher rates make your future cash flows look much less attractive. But if you are JPMorgan Chase, higher rates are effectively a pay raise, provided you do not have to pay your depositors too much to keep their money in the vault.
The Beautiful Asymmetry of Deposit Betas
The bear case for banks in a rising rate environment usually centers on two things: the “duration trap” and “deposit beta.” The duration trap is the idea that the bank owns a lot of old bonds that pay 2 percent, and as rates rise to 5 percent, those bonds become worth less on paper. If the bank had to sell them today, it would take a massive loss. The second issue, deposit beta, is the speed at which the bank has to raise the interest rates it pays to customers to prevent them from moving their cash to a money market fund.
JPMorgan Chase (JPM) handles these problems better than almost anyone else. While the market worries about unrealized losses in held-to-maturity (HTM) portfolios, JPMorgan is sitting on $1.59 trillion in total cash. Their balance sheet is so liquid that they can essentially ignore the fluctuations in their bond portfolio.
More importantly, JPMorgan has incredible pricing power over its depositors. When you are the largest bank in the country, you do not necessarily have to compete with the high-yield savings account offered by an internet bank you have never heard of. People keep their money at JPMorgan for the ecosystem, the technology, and the perceived safety. This allows the bank to keep its interest expenses low while the yields on its loan book and cash balances float higher with the Fed. The result is a widening net interest margin that fuels an operating margin of 42.58 percent, a figure that makes peers like Bank of America (BAC), with its 31.3 percent margin, look relatively lean.
Valuation and the Premium for Competence
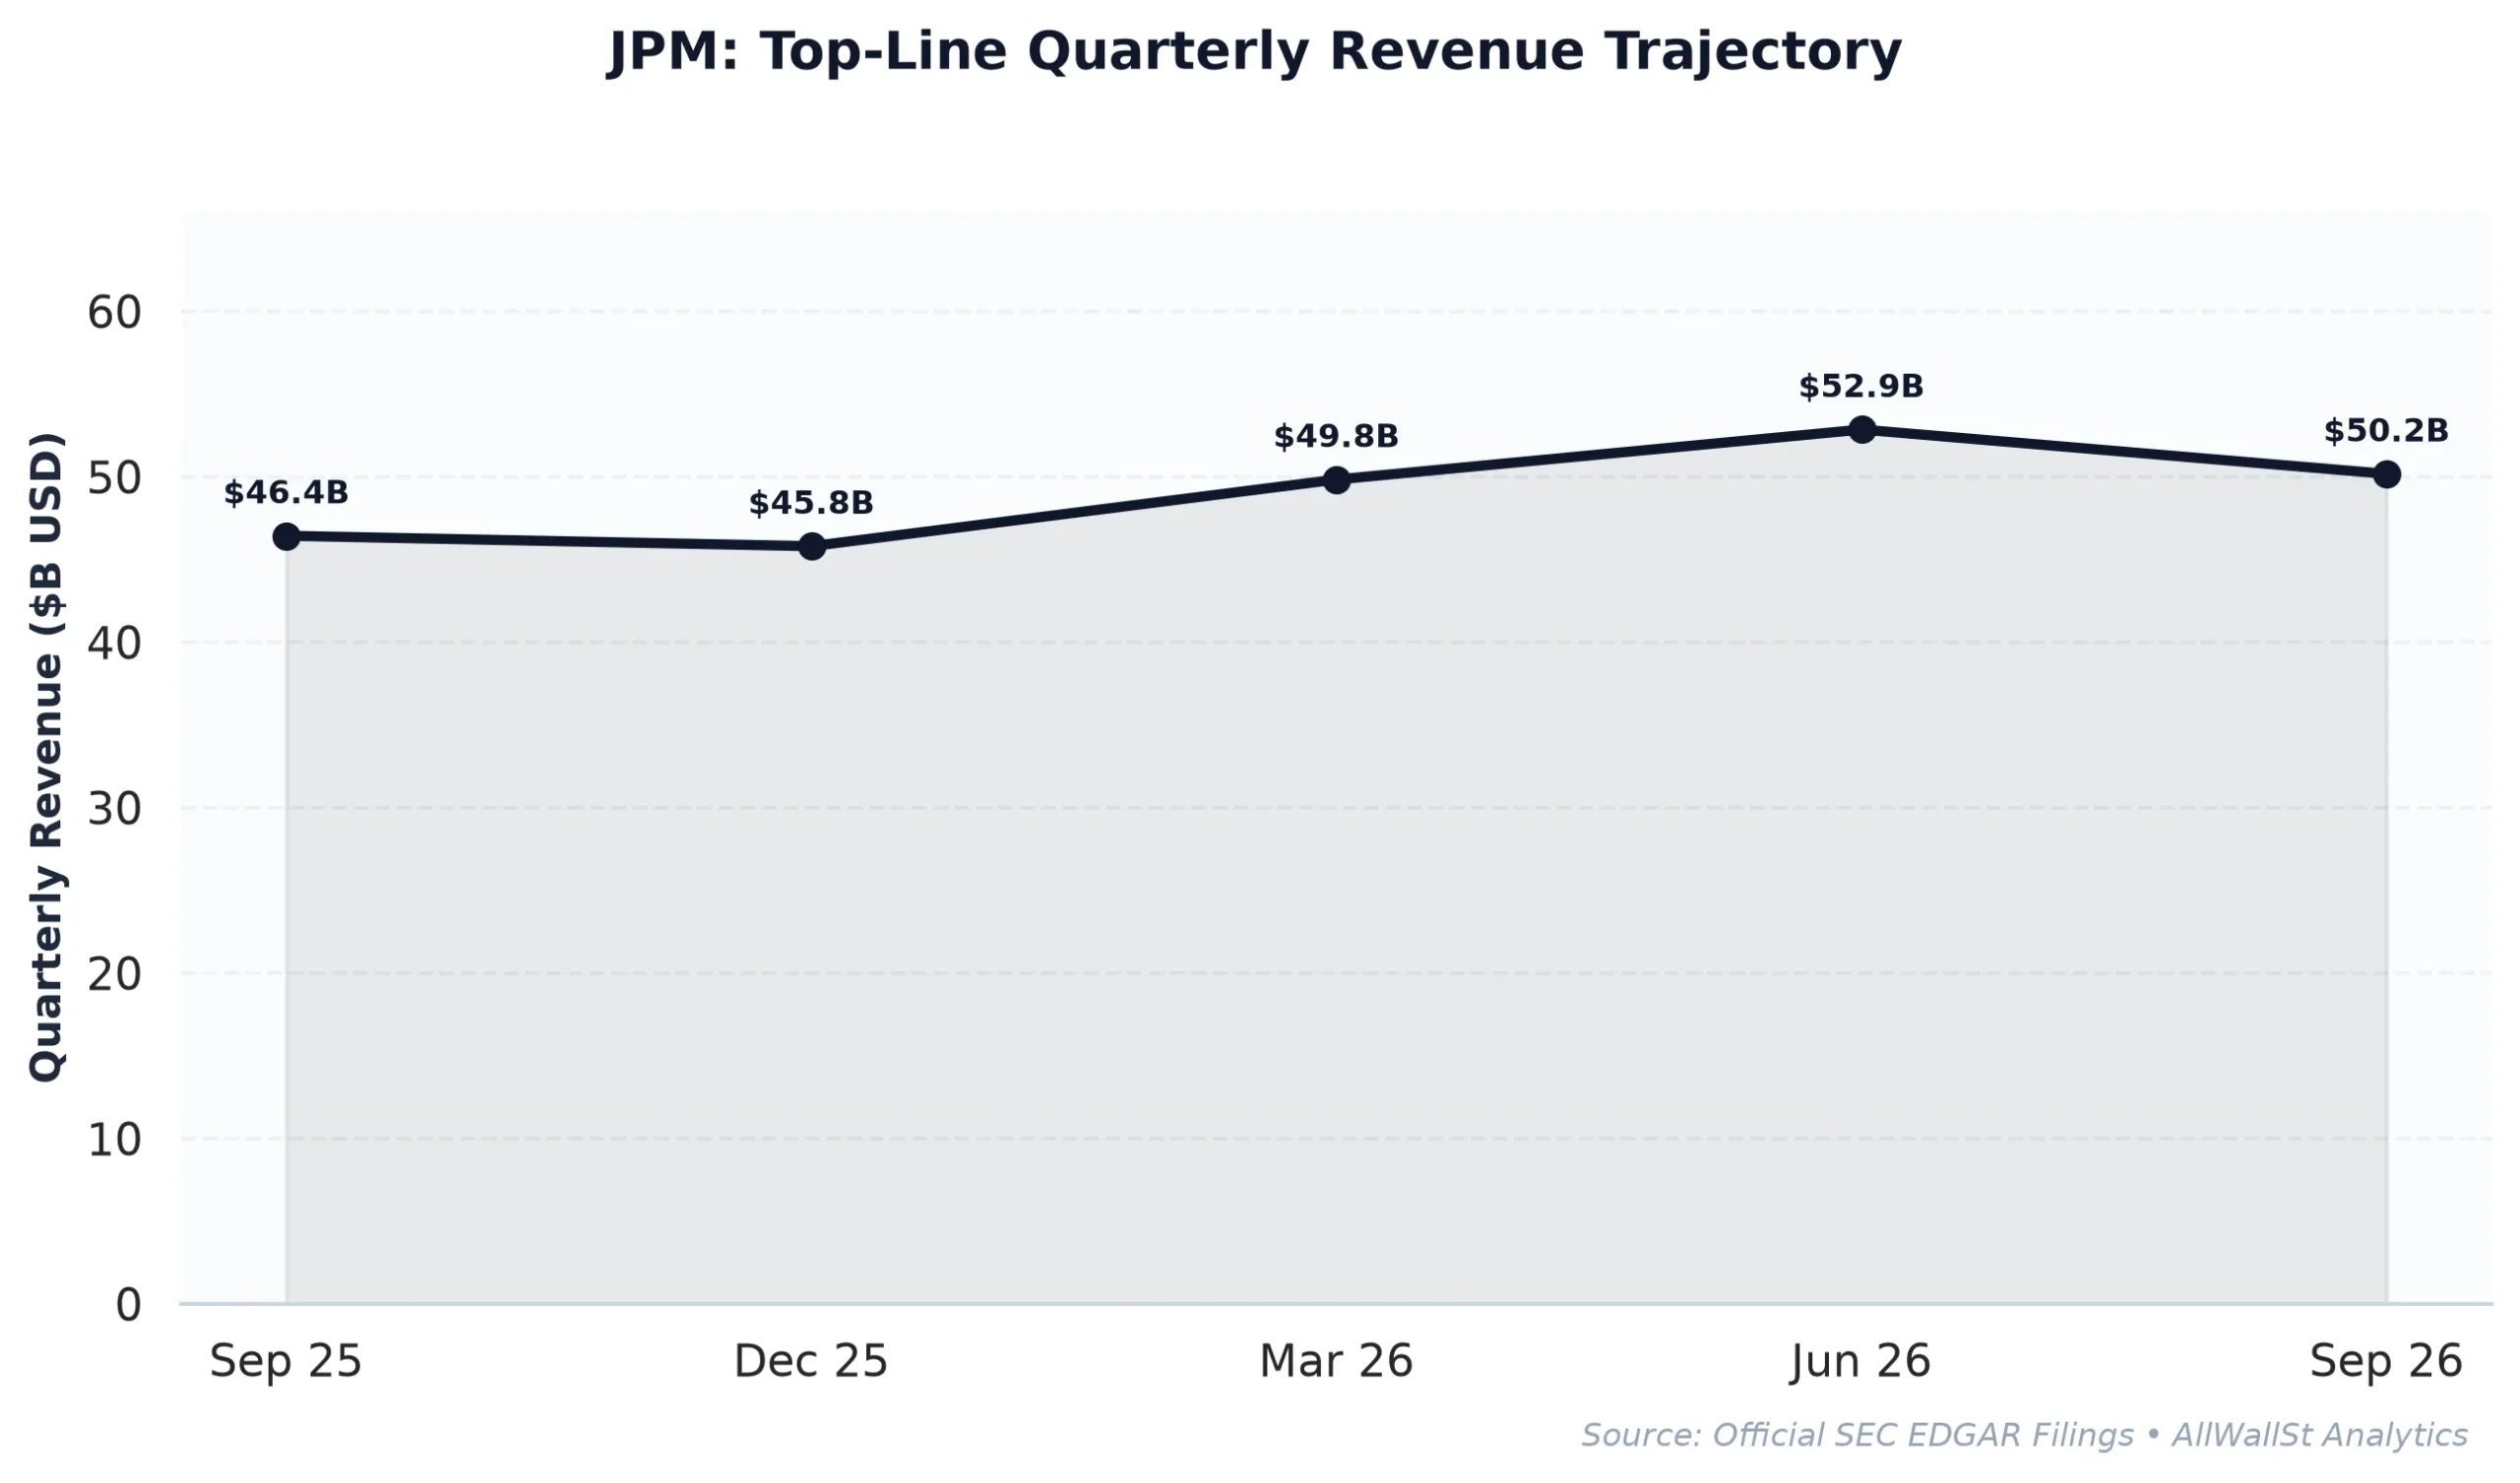
JPMorgan Chase is currently trading at a forward P/E of 13.4x. For a bank, this is often considered “expensive.” Bank of America trades at 9.8x, and Goldman Sachs (GS) sits at 12.3x. However, the premium is justified by the sheer consistency of the fundamental trajectory. In 2022, the company generated $127.7 billion in revenue. By the end of 2025, that figure climbed to $181.8 billion.
The market is currently pricing JPMorgan Chase with a certain degree of skepticism regarding its free cash flow, which shows a technical deficit due to the way banking capital is accounted for in regulatory filings. But if you look at the Return on Equity (ROE) of 18.01 percent, you see a business that is compounding capital at a rate far above its cost of equity. While Morgan Stanley (MS) trades at a slightly higher forward multiple of 13.7x, it does so with a lower operating margin of 39.0 percent. JPMorgan remains the gold standard for universal banking, combining a massive retail deposit base with a world-class investment banking and trading operation.
Market Structure and the $340 Magnet
From a quantitative perspective, the options market is currently signaling a period of consolidation. The Max Pain strike for the upcoming expiration sits at $340.00, which is less than 1 percent away from the current spot price of $342.07. This suggests that as we approach the weekend, dealer hedging will likely pin the stock near this level, preventing any wild swings in either direction despite the macro volatility.
There is a formidable Call Wall at $350.00, representing nearly 9,000 contracts of open interest. This acts as a structural ceiling: if the stock tries to rally toward $350, dealers who sold those calls will likely sell the underlying stock to remain delta-neutral, capping the upside. Conversely, there is strong Put Support at $320.00 and $330.00. The Put/Call ratio of 0.94 indicates a balanced market where institutional investors are not panicking, but they are certainly not chasing the rally blindly either.
What we are left with is a company that thrives on the very volatility that scares the rest of the market. Higher rates might hurt the average consumer, and they might even cause some pain for regional banks with weaker funding bases, but for JPMorgan Chase, they are simply more fuel for the compounding machine. The bank is returning capital to shareholders at an impressive clip, with a total shareholder yield of 5.74 percent when you combine dividends and buybacks. In a world where the risk-free rate is roughly 5 percent, you are getting paid a premium to own the most dominant financial institution on the planet.
AllWallSt Investment Verdict: BUY
JPMorgan Chase & Co. (JPM)
Trailing P/E
Marcus Wolfe Screen
Leverage Profile
30D Channel
Dealer Gamma Pinning & Max Pain Alignment (JPM)
Banking liquidity & regulatory capital compliant (Basel III / CET1 governed); deposit & trading settlement flows normalized.
Tier 1 Regulatory Capital & Liquidity Coverage Ratio (LCR) compliant; balance sheet governed by Basel III capital buffers.
Evaluated against 4.98% US 10-Yr Benchmark; bank net interest margins sensitive to yield curve slope (2s10s spread) and deposit beta.
Max Pain: $340.00 (-0.61%) | P/C Ratio: 0.94 | 30D Channel: $315.49 – $368.65. Dealer gamma bounded between $320 Put Wall and $350 Call Wall.
JPM represents a core ~1.7% index pillar. Institutional managers face persistent benchmark drag if under-allocated during sector rallies, biasing sell-side consensus toward institutional overweight.
$313.60 – $326.40 (Options Support Pinning)
Sustained weekly close below $320.00 (Put Wall) or gross margin compression below 0.00%.
Sources & References
- Official SEC Form 10-K Annual Report (Filed 2026-02-13)
- Official SEC Form 10-Q Quarterly Report (Filed 2026-11-03)
- JPMorgan Chase & Co. Investor Relations: https://www.jpmorganchase.com
- SEC EDGAR Filings (CIK 0000019617): https://www.sec.gov/edgar/browse/?CIK=0000019617
- US Treasury Yield Curve Data: https://home.treasury.gov
Regulatory Disclaimer: AllWallSt is a financial publisher, not an investment advisor. The information provided in this article is for educational and informational purposes only and does not constitute financial, investment, or legal advice. Investing in securities involves significant risk, including the potential loss of principal. All data, including valuation multiples and market structure metrics, are derived from primary sources believed to be reliable but are not guaranteed for accuracy or timeliness. Past performance is not indicative of future results. Always consult with a qualified financial professional before making any investment decisions. AllWallSt and its affiliates may hold positions in the securities discussed.