
⚡ Executive Morning Takeaways
- Overnight Futures & Rates Impulse: Equity futures are pushing higher with the E-Mini Nasdaq 100 (NQ=F) leading at +1.90%, while the 10-Year Treasury yield hovers at a restrictive 4.98%. Risk appetite is returning to growth proxies despite the looming 5.00% psychological barrier in fixed income.
- Sector Rotation Leaders & Laggards: Financials (XLF) and Energy (XLE) continue to lead the rotation as capital seeks out lower P/E ratios and yield, while Technology (XLK) remains the primary laggard despite the overnight bounce in futures.
- Primary Corporate Catalyst: Applied Materials, Inc. (AMAT) is seeing significant pre-market strength, trading up 5.98% to $394.80. This move comes as ETFs reportedly absorbed $317 million in shares on Monday, creating a liquidity floor ahead of tomorrow’s critical Q3 earnings release.
🌐 Pre-Market Macro, Futures & Rates Dashboard
| Asset / Benchmark | Ticker | Current Price / Level | Change (%) | 52-Week Low | 52-Week High |
|---|---|---|---|---|---|
| E-Mini S&P 500 Futures (ES=F) | ES=F | $7608.75 | +0.85% | $6353.25 | $7897.50 |
| E-Mini Nasdaq 100 Futures (NQ=F) | NQ=F | $28363.50 | +1.90% | $22961.50 | $31616.50 |
| S&P 500 (SPY) | SPY | $749.92 | -0.37% | $629.28 | $781.62 |
| Nasdaq 100 (QQQ) | QQQ | $674.76 | -0.68% | $555.60 | $762.86 |
| Russell 2000 (IWM) | IWM | $280.58 | -0.68% | $228.90 | $305.18 |
| 20+ Year Treasury (TLT) | TLT | $80.88 | -1.32% | $76.43 | $90.86 |
| High Yield Corporate (HYG) | HYG | $77.18 | -0.43% | $76.39 | $81.24 |
| Gold (GLD) | GLD | $369.36 | -2.68% | $354.67 | $509.70 |
| WTI Crude Oil (CL=F) | CL=F | $87.30/bbl | +1.46% | $54.98 | $119.48 |
| US Dollar Index Bullish (UUP) | UUP | $29.15 | +0.62% | $26.40 | $29.25 |
| CBOE Volatility Index (^VIX) | ^VIX | 18.54 | -4.73% | 13.38 | 35.30 |
| 2-Yr US Treasury Yield (2YY=F) | 2YY=F | 4.75% | +0.00% | 3.38% | 4.88% |
| 10-Yr US Treasury Yield (^TNX) | ^TNX | 4.98% | +2.45% | 3.96% | 5.36% |
The macro environment is currently defined by a tense standoff between equity bulls and the bond market. With the 10-Year Treasury yield (^TNX) climbing toward 4.98%, the equity risk premium has essentially vanished. When the risk-free rate is nearly 5%, an equity earnings yield must work significantly harder to justify its existence. The VIX has retreated 4.73% to 18.54, suggesting that while the “panic” has subsided, the “grind” of higher-for-longer rates is now the primary institutional concern.
Crude oil (CL=F) climbing 1.46% to $87.30 adds a secondary inflationary headwind that the Federal Reserve will likely cite during the next policy meeting. For technology companies that rely on long-duration cash flows, this combination of rising energy costs and a 5% discount rate creates a valuation ceiling that only massive, AI-driven operational efficiency can pierce.
📊 Sector Rotation Leaders & Laggards
| Rotation Rank | Sector ETF | Ticker | Price | Change (%) | Trailing P/E | Dividend Yield | 52-Week Low | 52-Week High |
|---|---|---|---|---|---|---|---|---|
| Leader (#1) | Financials (XLF) | XLF | $58.29 | +0.52% | 15.7x | 1.46% | $47.67 | $60.04 |
| Leader (#2) | Energy (XLE) | XLE | $62.21 | +0.44% | 15.5x | 2.18% | $43.77 | $70.15 |
| Leader (#3) | Communication Services (XLC) | XLC | $107.76 | +0.37% | 17.1x | 1.38% | $99.33 | $120.41 |
| Laggard (#8) | Utilities (XLU) | XLU | $43.73 | -0.14% | 18.0x | 2.79% | $39.03 | $47.80 |
| Laggard (#9) | Materials (XLB) | XLB | $52.85 | -0.17% | 22.0x | 1.64% | $42.22 | $54.63 |
| Laggard (#10) | Technology (XLK) | XLK | $168.91 | -1.15% | 29.8x | 0.47% | $126.68 | $203.25 |
Institutional capital is currently performing a classic defensive pivot. Financials (XLF) and Energy (XLE) are the clear winners, trading at 15.7x and 15.5x earnings, respectively. This is where you go when you want to hide from the 29.8x multiple found in the Technology sector (XLK). The dispersion is stark: you are paying nearly double for a unit of technology earnings compared to a unit of bank earnings, even though the interest rate environment arguably favors the latter.
Materials (XLB) are also lagging, perhaps reflecting a cooling global industrial outlook that contrasts with the localized AI hardware boom. When the most expensive sector in the market is also the one being sold the hardest, it suggests that the “valuation doesn’t matter” phase of the cycle has officially concluded.
⏱️ Today’s Earnings & Economic Radar
Imminent Corporate Earnings Releases
| Company / Ticker | Timing | Consensus EPS | Consensus Revenue | Key Strategic Theme |
|---|---|---|---|---|
| Applied Materials (AMAT) | Tomorrow (Nov 12) | $4.06 | $10.30B | Gate-All-Around (GAA) & Advanced Packaging Equipment Spend |
| CoreWeave (CRWV) | Yesterday (Reported Nov 10) | $-0.63 | $4.70B | GPU Cloud Capacity Contracts & Sovereign Infrastructure CapEx |
| Cisco Systems (CSCO) | Tomorrow (Nov 12) | $1.33 | $18.13B | Enterprise AI Ethernet Switching & Splunk Security ARR |
| Constellation Energy (CEG) | Nov 09 (Reported) | $2.46 | $7.97B | Nuclear PPAs & Hyperscaler Data-Center Colocation |
| Walt Disney (DIS) | Nov 17 (Scheduled) | $1.69 | $25.15B | Direct-to-Consumer Streaming Operating Income & Parks DTC Demand |
| Home Depot (HD) | Nov 17 (Scheduled) | $3.84 | $42.77B | Pro-Contractor Backlog vs High-Rate Big-Ticket Remodeling |
High-Impact Economic Data & Central Bank Actions
| Time (ET) | Event | Impact | Key Institutional Focus |
|---|---|---|---|
| 08:30 AM | Consumer Price Index (CPI) & Core CPI | CRITICAL | Supercore Services ex-Housing & 10Y Real Yield |
| 10:30 AM | EIA Weekly Petroleum Status Report | HIGH | Refinery Runs & Strategic Reserve Levels |
| 01:00 PM | US 10-Year Treasury Note Auction | CRITICAL | Auction Tail Risk & 5.00%+ Term Premium |
The 08:30 AM CPI print is the single most important variable for today’s session. If the “Supercore” services data shows any sign of re-acceleration, the 10-Year Treasury auction at 01:00 PM could turn into a bloodbath. Institutional desks are watching for “auction tail” risk, where the market demands an even higher yield than the pre-auction quote to absorb the government’s debt.
🎯 Pre-Market Spotlight: Applied Materials, Inc. (AMAT)
Applied Materials, Inc. (AMAT) finds itself in a strange position where the market is simultaneously trimming its “fair value” while ETFs are shoveling $317 million into the stock. This is the sort of thing that happens when a company is the primary tollbooth for a secular trend like AI, but also happens to be a cyclical hardware business that has to actually build and ship physical machines. The stock is currently trading at $372.53, but the pre-market bid has jumped to $394.80, a nearly 6% surge that suggests the “margin caution” narrative is being steamrolled by raw demand for semiconductor infrastructure.
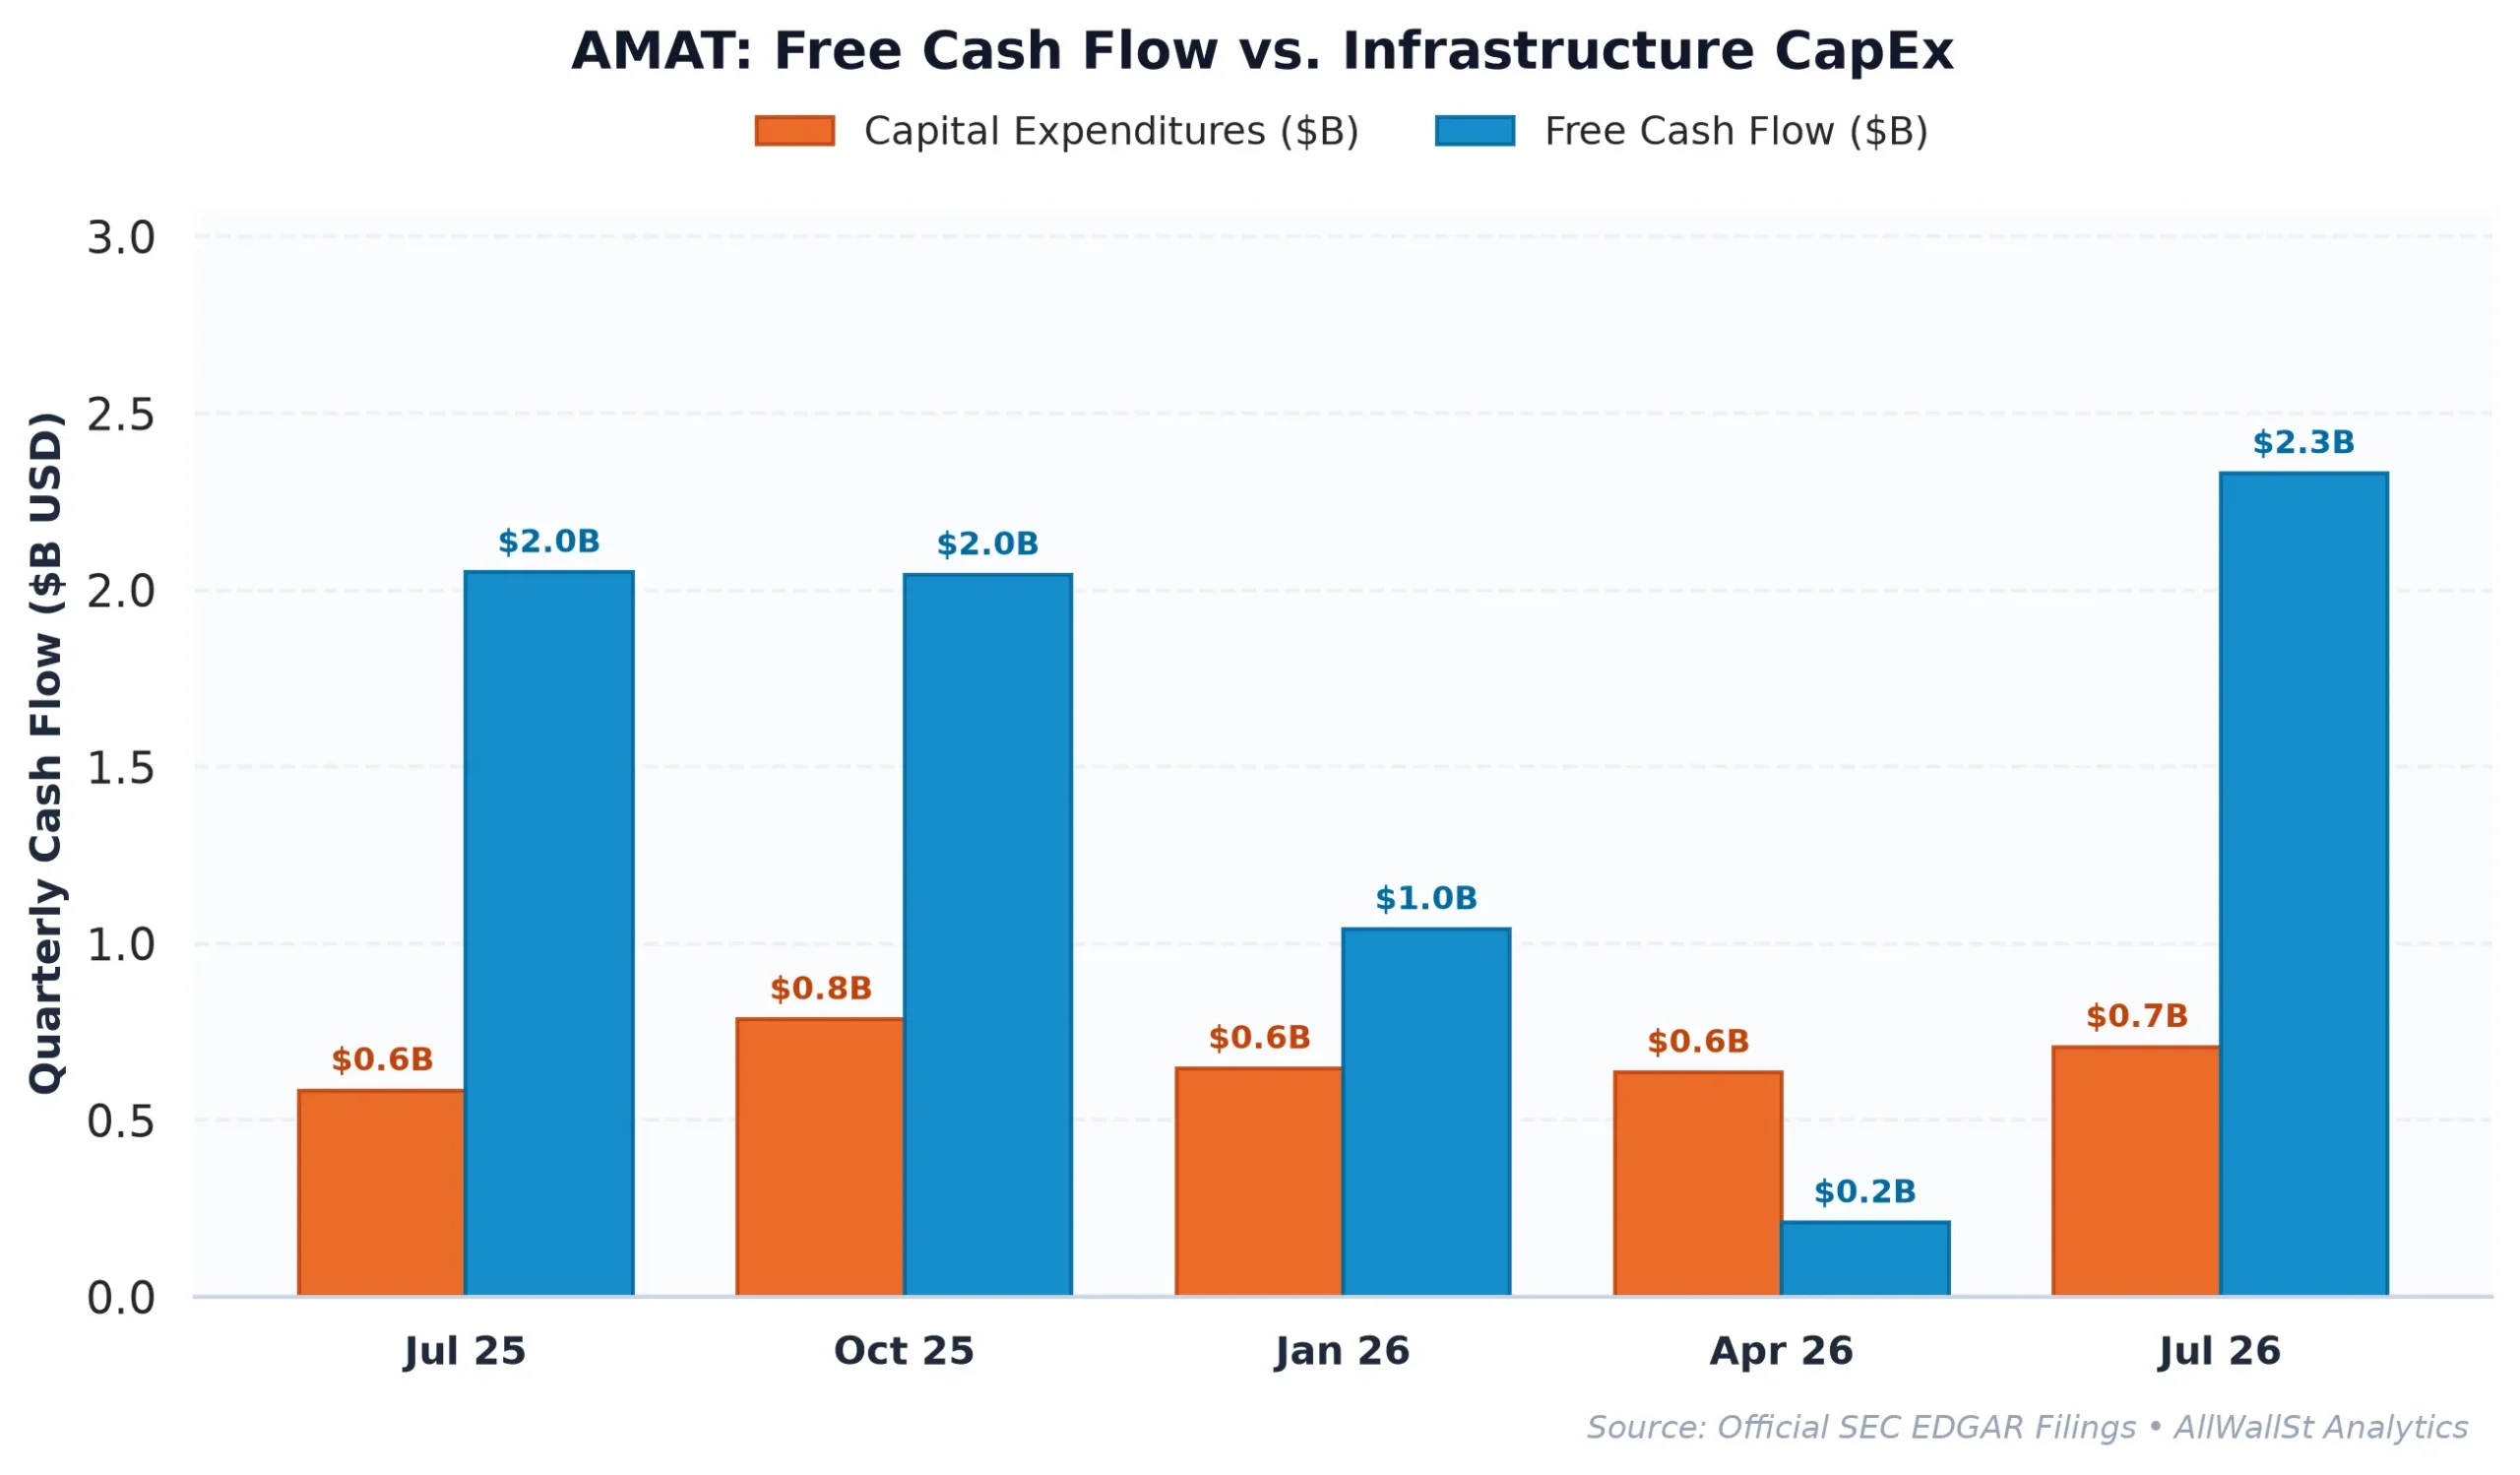
From a fundamental perspective, Applied Materials is a high-performance engine. It boasts a 33.74% operating margin and a Return on Invested Capital (ROIC) of 34.62%, which is roughly four times its cost of capital. While its Free Cash Flow yield of 1.04% looks terrifyingly thin compared to a 4.98% Treasury yield, one must remember that AMAT is in a heavy reinvestment phase. It spent $5.32 billion on CapEx over the last year to capture the transition to Gate-All-Around (GAA) transistors and advanced packaging. If you compare AMAT’s 20.1x forward P/E to Microsoft (MSFT) at 22x or Alphabet (GOOGL) at 18.6x, you realize that you are getting a top-tier semiconductor equipment monopoly for roughly the same multiple as a search engine or a software conglomerate.
The options market structure for Applied Materials is surprisingly balanced, which usually means the “smart money” is waiting for the earnings catalyst to pick a direction. The Max Pain strike sits at $405, about 8.7% above current spot, which acts as a magnetic pull for dealers who would prefer the options to expire worthless. There is a formidable Call Wall at $400, which will likely act as a ceiling in the immediate term unless tomorrow’s earnings report is an absolute blowout. With a Put/Call ratio of 0.9, there is no excessive speculative froth here: just a lot of institutional players trying to figure out if the 24.8% revenue growth can offset the inevitable margin compression that comes with scaling next-generation hardware.
Wall Street’s “Market Weight” consensus reflects a classic career-risk hedge: they don’t want to miss the AI rally, but they are scared of the cyclical downturn. We prefer to look at the cash. A company that generates $9.2 billion in net income and has a net cash surplus of $1.89 billion is not a “warning.” It is a compounding machine that happens to be on sale because people are worried about the price of copper and the 10-Year yield. If the pre-market bid holds, we are looking at a breakout that could easily challenge the $400 Call Wall before the week is out.
AllWallSt Investment Verdict: BUY
Applied Materials, Inc. (AMAT)
Trailing P/E
Marcus Wolfe Screen
Leverage Profile
30D Channel
Dealer Gamma Pinning & Max Pain Alignment (AMAT)
🎯 Max Pain: $405.00
Spot $372.53
Ceiling $400C Resistance
Pristine cash flow conversion (1.14x) and healthy accrual ratio (-2.64%). Zero accounting anomalies detected (LOW ANOMALY RISK).
Fortress Balance Sheet (Net Cash Position; zero net refinancing distress).
Negative yield spread (-3.94% vs 4.98% Treasury); equity requires robust multiple expansion or growth.
Max Pain: $405.00 (+8.72%) | P/C Ratio: 0.9 | 30D Channel: $359.19 – $385.87. Dealer gamma bounded between $370 Put Wall and $400 Call Wall.
AMAT carries standard index weighting (< 0.6% SPY footprint); sell-side consensus reflects standard earnings momentum rather than index-tracking mandates.
$362.60 – $377.40 (Options Support Pinning)
Sustained weekly close below $370.00 (Put Wall) or gross margin compression below 49.40%.
Sources & References
- Official SEC Form 10-K Annual Report (Filed 2025-12-12)
-
Applied Materials, Inc. SEC EDGAR Filings: https://www.sec.gov/edgar/browse/?CIK=0000006951
- Applied Materials Investor Relations: https://www.appliedmaterials.com
- Federal Reserve Economic Data (FRED): https://fred.stlouisfed.org
Disclaimer: This report is for informational purposes only and does not constitute financial, legal, or tax advice. The AllWallSt research team and its affiliates may hold positions in the securities discussed. Investing in equities involves significant risk, and past performance is not indicative of future results.