
The stock market is occasionally a place of profound name confusion. If you spend your Wednesday mornings scanning retail hardware feeds, you might notice that the RTX 5080 gaming laptop is currently enjoying a steep discount at Newegg, while owners of the PNY RTX 5070 are complaining about artifacts and repeated crashes. This is very important information if you are a teenager trying to play video games at high frame rates. It is somewhat less relevant if you are an institutional portfolio manager holding shares of RTX Corporation (RTX), the aerospace and defense titan formerly known as Raytheon Technologies.
The trouble is that the market sometimes treats the two as if they share more than just three letters. RTX Corporation is currently trading at a forward price to earnings multiple of 24.7x. For a business that builds jet engines and missile defense systems, this is a premium valuation usually reserved for companies that can scale their software at zero marginal cost. In the physical world of industrials, every incremental dollar of revenue requires more titanium, more specialized labor, and more factory floor space. When you add a 5.00% risk-free rate into the equation, the math for holding a defense prime at these levels starts to look as shaky as a malfunctioning graphics card.
We last looked at RTX Corporation twenty-two days ago, noting that the record backlog was beginning to look like a beautiful architectural drawing for a house that might take a decade to build. Since then, the stock has hovered near $200, seemingly pinned by a market that wants to believe in the defense super-cycle but cannot quite ignore the gravity of the bond market.
The Duration Problem in a 5% World
The fundamental issue with RTX Corporation is not that it is a bad business. It is a very good business with a massive moat. If you want to build a Pratt & Whitney GTF engine, you cannot simply download a blueprint and start a 3D printer. You need decades of metallurgical expertise and a global service network. However, the financial markets do not reward “goodness” in a vacuum; they reward the spread between a company’s cash generation and the cost of capital.
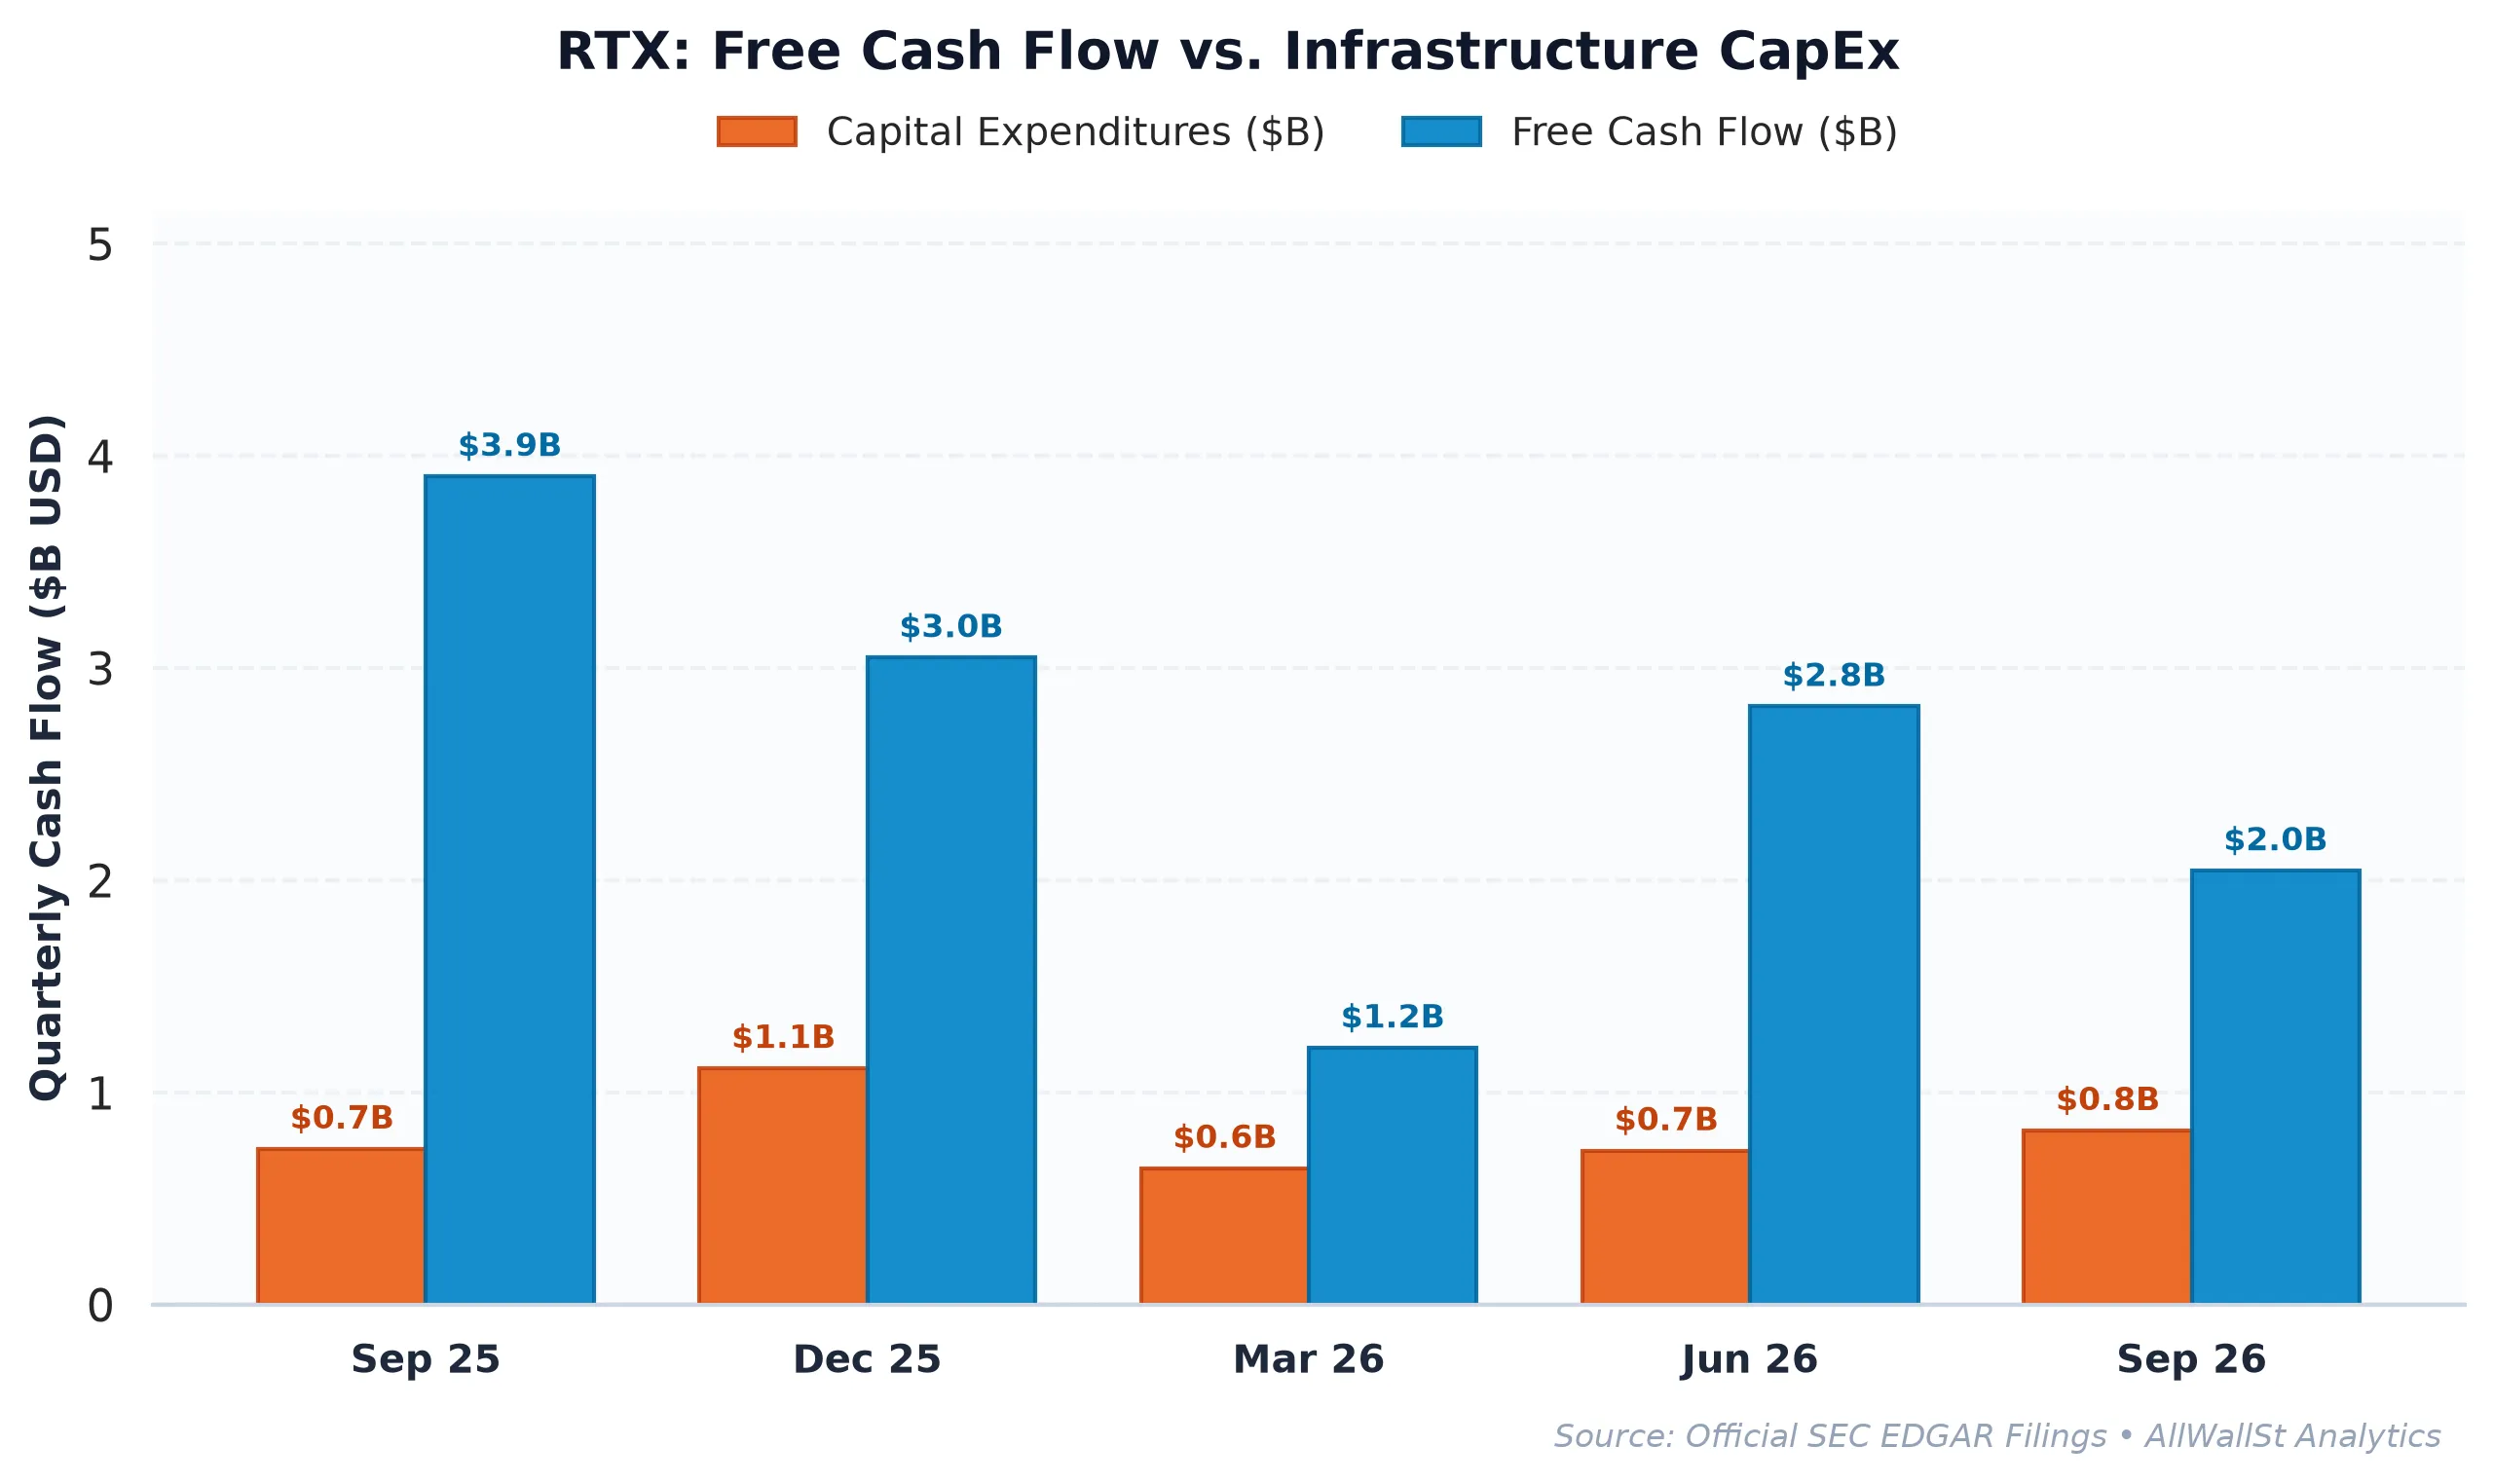
Currently, RTX Corporation offers a free cash flow yield of 3.08%. If you adjust for the $1.09 billion in stock-based compensation (SBC), which accounted for nearly 9% of operating cash flow in the recent filings, the real economic yield drops to 2.68%. Meanwhile, the US 10-Year Treasury yield is sitting comfortably at 5.00%. This creates a negative spread of 1.91%. Investors are essentially paying RTX Corporation for the privilege of taking on industrial execution risk, supply chain headaches, and fixed-price contract exposure, all while earning significantly less than they would from a risk-free government bond.
The multi-year trajectory shows a company that has successfully grown its top line from $67 billion in 2022 to nearly $96 billion on a trailing basis. Operating margins have improved from the 5.2% nadir in 2023 back toward 13.11%. This is impressive operational work by management. Yet, the Rule of 40 score stands at 19.7%, well below the 25% hurdle we expect for high-conviction industrial compounders. The company is growing, but it is doing so with a capital intensity that requires $4.13 billion in annual CapEx just to keep the gears turning.
Peer Relative Valuation and the GE Outlier
When we compare RTX Corporation to its peers in the defense and aerospace sector, the valuation disconnect becomes even more apparent. The sector is currently divided between the “pure-play” defense primes and the “aerospace-heavy” giants. RTX Corporation straddles both, but it is being priced closer to the latter without the same margin profile.
| Company (Ticker) | Market Cap | Forward P/E | EV/EBITDA | Rev Growth (YoY) | Operating Margin | FCF Yield |
|---|---|---|---|---|---|---|
| RTX (RTX) | $269.2B | 24.7x | 17.8x | 11.10% | 13.11% | 3.08% |
| Lockheed Martin (LMT) | $139.9B | 18.2x | 15.6x | 11.3% | 10.8% | 4.04% |
| GE Aerospace (GE) | $353.1B | 36.5x | 31.0x | 15.9% | 19.7% | 1.79% |
| Northrop Grumman (NOC) | $77.5B | 18.2x | 12.5x | 6.7% | 13.3% | 4.05% |
Lockheed Martin and Northrop Grumman both trade at roughly 18x forward earnings, offering free cash flow yields north of 4%. These are the traditional defense benchmarks. GE Aerospace trades at a massive 36x multiple, but it carries a nearly 20% operating margin and dominates the commercial widebody engine market. RTX Corporation is caught in the middle. It lacks the pure-play defense valuation discount of Lockheed, yet it cannot match the specialized margin profile of the new GE Aerospace.
The market seems to be giving RTX Corporation credit for a commercial aerospace recovery that is already well underway, while ignoring the fact that its defense segments are still grappling with the same labor and material inflation that has compressed margins across the Pentagon’s supplier base. With a Price to Book ratio of 3.89x, the market is placing a high premium on the intangible value of the backlog, even though that backlog will take years to convert into actual, spendable cash.
Options Gamma and the $195 Gravity Well
From a market structure perspective, the plumbing suggests that the stock is currently in a state of suspended animation. The Put/Call Open Interest ratio of 1.14 indicates a balanced distribution of hedges. There is no extreme speculative fervor, but there is also no significant panic.
The Max Pain strike is currently sitting at $195.00, which is roughly 2.25% below the current spot price. In the world of dealer gamma, this strike acts as a magnetic anchor. As we approach the upcoming monthly expirations, options dealers who have sold those $195 puts and calls will likely need to adjust their hedges in a way that pins the stock near that level. The primary call resistance is layered at $200 and $210, suggesting that any breakout to the upside will be met with mechanical selling from dealers as they unwind long positions.
Conversely, the put support is deep, with major walls at $175 and $165. This suggests that while the valuation is rich, there is a structural floor provided by institutional hedging. The expected 30-day move is approximately 9.8%, which would put the lower bound near $180. Given the current macro environment and the negative equity risk premium, a drift toward that lower bound seems more likely than a surge toward the $220 call wall.
The company’s recent 10-Q filings confirm that while the commercial aftermarket is a tailwind, the defense side of the house is still managing the fallout from legacy fixed-price contracts. These contracts are the bane of industrial margins in an inflationary regime. Every time a parts supplier raises prices, the prime contractor eats the difference until the contract can be renegotiated, which, in the world of government procurement, can take years.
Since our last audit, the business has executed well, but the price has already run to reflect that execution. The gap between the 3% cash yield and the 5% risk-free rate is a fundamental barrier that is difficult to overcome without a massive acceleration in margin expansion that the current supply chain simply cannot support. We remain disciplined.
AllWallSt Investment Verdict: HOLD (Reaffirming)
RTX Corporation (RTX)
Trailing P/E
Marcus Wolfe Screen
Leverage Profile
30D Channel
Dealer Gamma Pinning & Max Pain Alignment (RTX)
🎯 Max Pain: $195.00
Spot $199.49
Ceiling $210C Resistance
Pristine cash flow conversion (1.57x) and healthy accrual ratio (-2.24%). Zero accounting anomalies detected (LOW ANOMALY RISK).
Prudent Leverage (1.75x Net Debt/EBITDA); well within investment-grade covenant headroom.
Negative yield spread (-1.91% vs 5.00% Treasury); equity requires robust multiple expansion or growth.
Max Pain: $195.00 (-2.25%) | P/C Ratio: 1.14 | 30D Channel: $179.90 – $219.08. Dealer gamma bounded between $175 Put Wall and $210 Call Wall.
RTX carries standard index weighting (< 0.6% SPY footprint); sell-side consensus reflects standard earnings momentum rather than index-tracking mandates.
Accumulation Deferred (Await Pullback toward $171.50 – $178.50 Support Pinning)
Sustained weekly close below $175.00 (Put Wall) or acceleration in margin compression.
Sources & References
- RTX Corporation Investor Relations: https://www.rtx.com/investors
- SEC EDGAR Search for RTX Corp: https://www.sec.gov/edgar/browse/?CIK=0000101829
- SEC Form 10-Q (October 20, 2026): https://www.sec.gov/Archives/edgar/data/101829/000010182926000031/rtx-20260930.htm
- SEC Form 10-K (February 6, 2026): https://www.sec.gov/Archives/edgar/data/101829/000010182926000006/rtx-20251231.htm
Regulatory Disclaimer: This research is for informational purposes only and does not constitute financial, legal, or investment advice. AllWallSt is a financial journalism outlet and is not a registered investment advisor. The author may hold positions in the securities mentioned. Investing in public equities involves significant risk. Past performance is not indicative of future results. Consult with a professional advisor before making any investment decisions. Analytical metrics are based on primary SEC filings and market data feeds available as of November 11, 2026.