
The thing about software companies that claim to predict the future is that they eventually have to live in the present. For Palantir Technologies Inc. (PLTR), the present arrived on Wednesday with a 19 percent haircut. This was not a subtle adjustment. It was the kind of market reaction that suggests the collective consciousness of Wall Street suddenly realized that while artificial intelligence might be infinite, the patience of a discount rate is decidedly finite.
We last looked at Palantir Technologies Inc. on October 22, when the stock was trading at $200.66. At the time, we assigned a HOLD rating, noting that the company was effectively a 77x revenue story. Since then, the reality of the 10-Year Treasury yield sitting at 5.00 percent has begun to exert its gravitational pull. When the risk-free rate is five percent, a company yielding 0.63 percent in free cash flow is not just an investment: it is an act of faith. And as the recent news flow suggests, the congregation is starting to look for the exits.
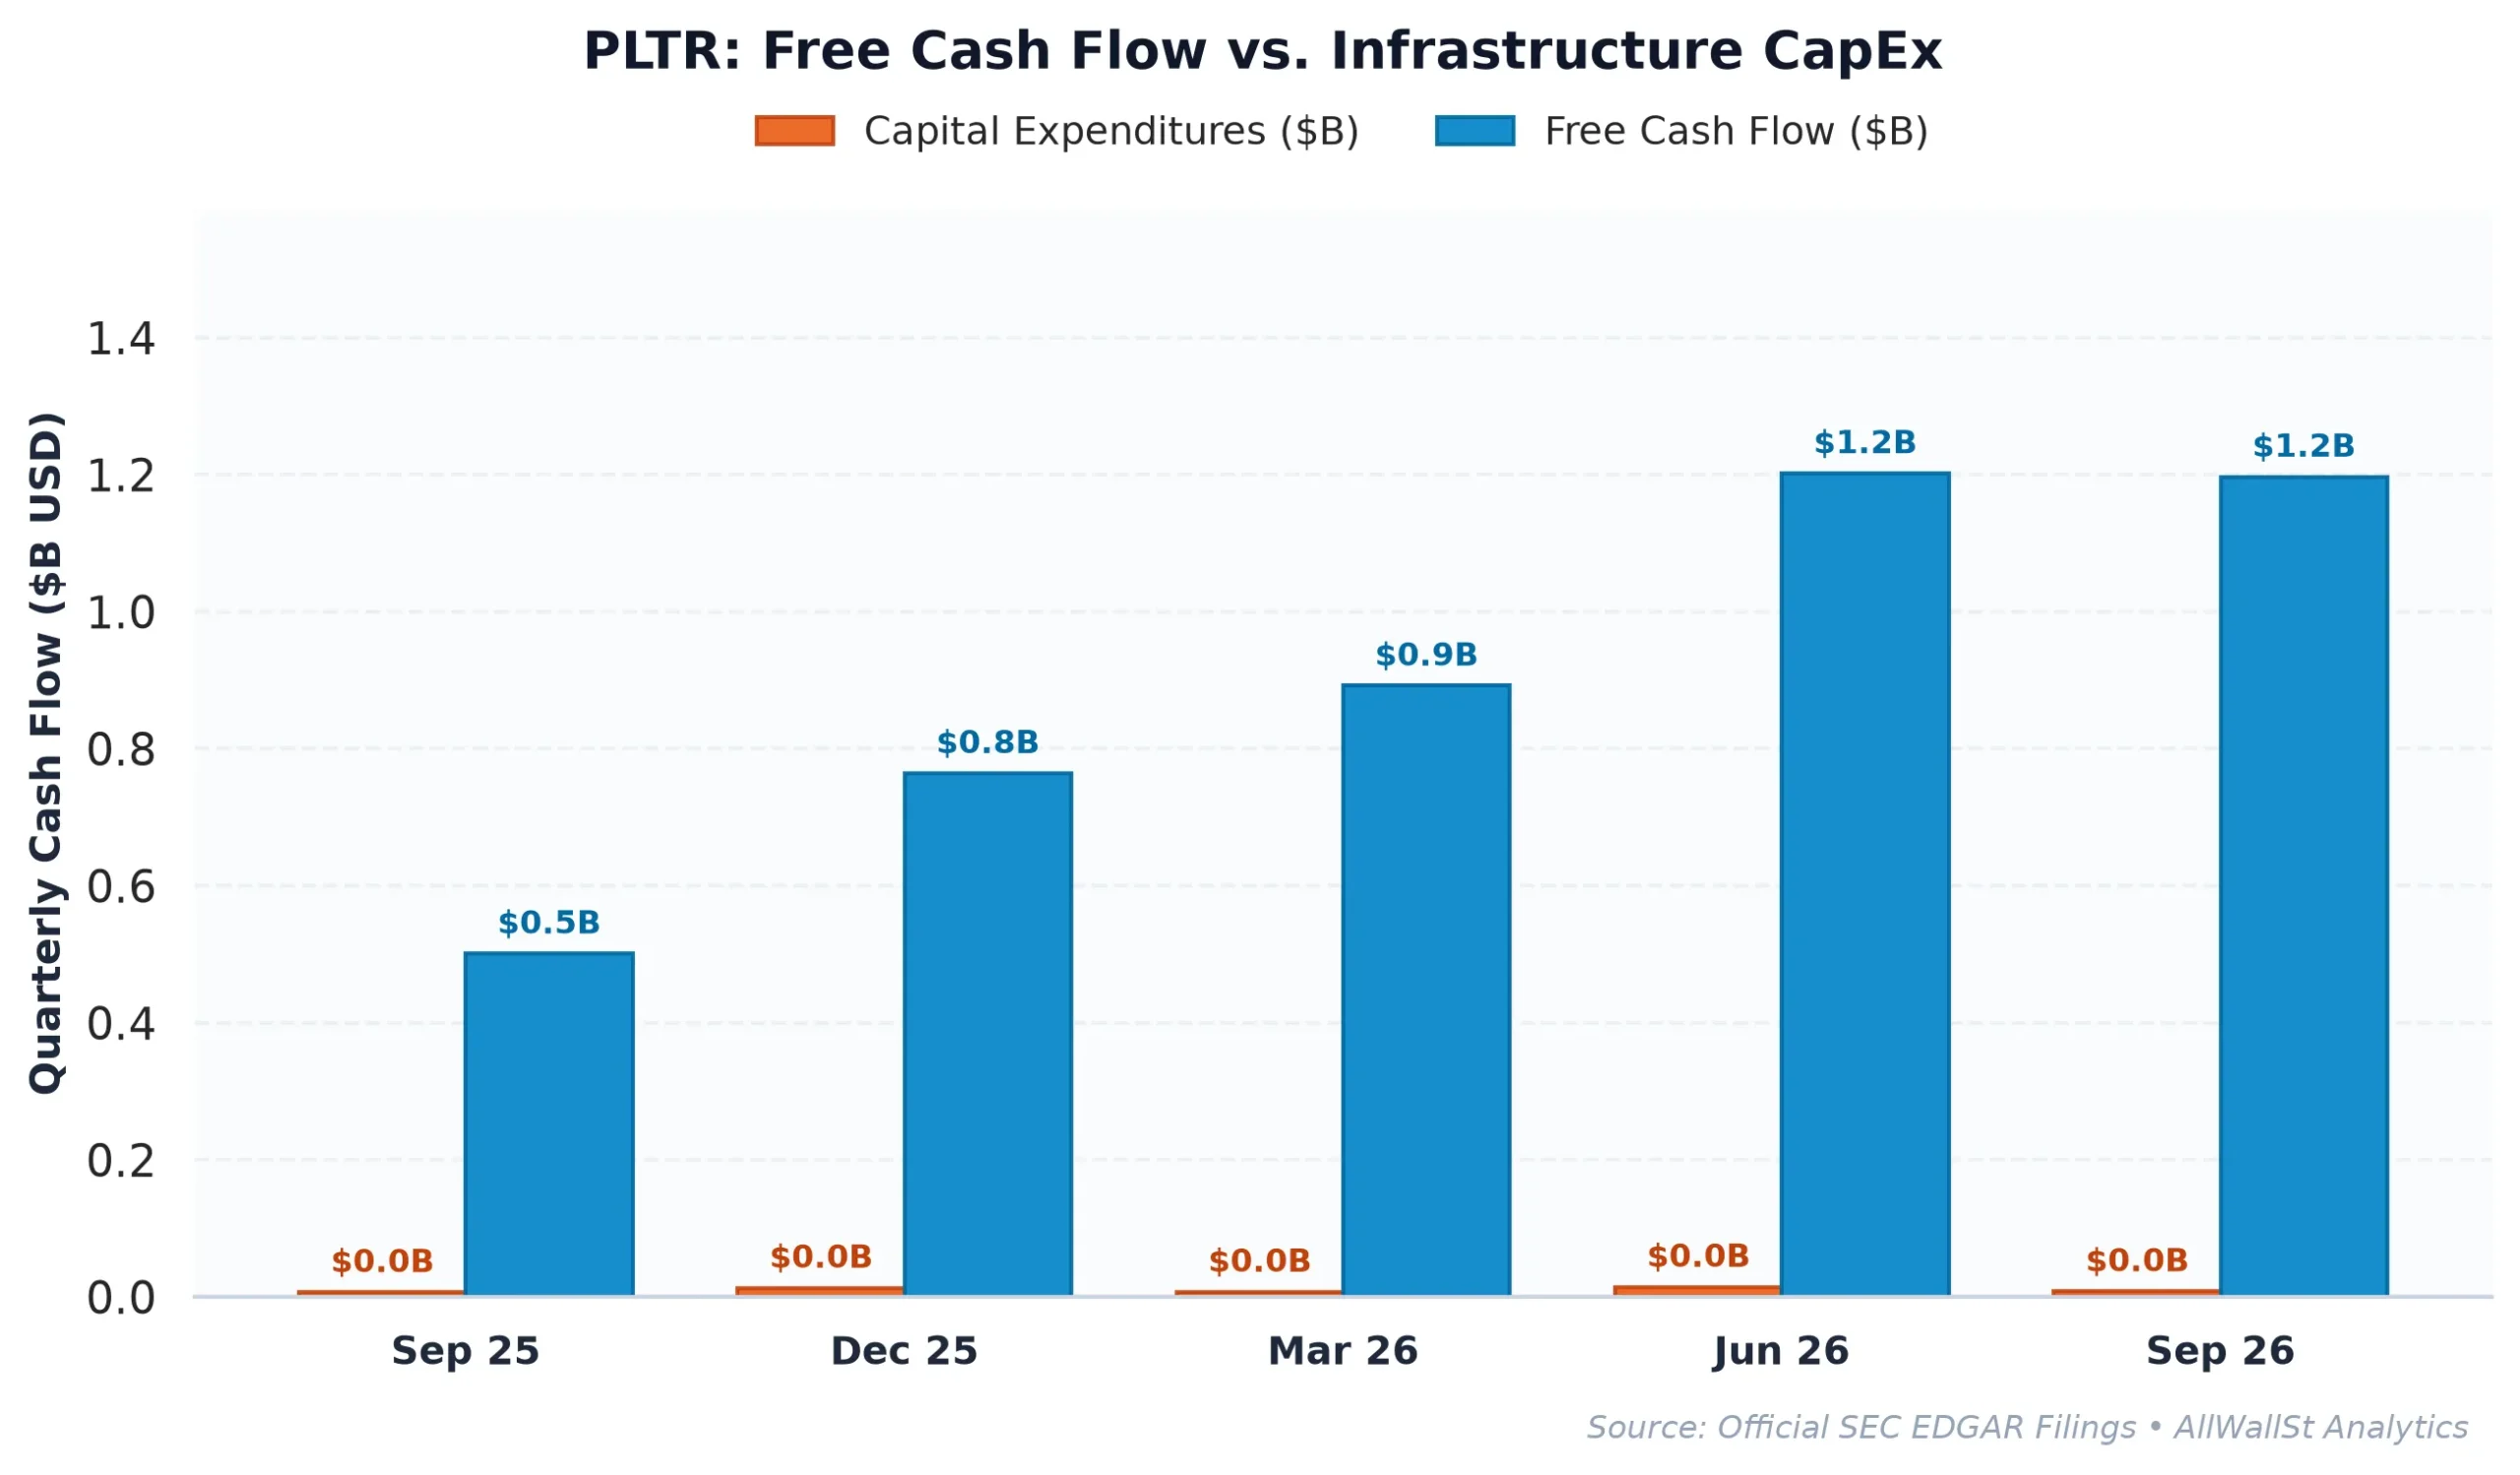
Round 1: The Bull Case for Durable Compounding
The bull case for Palantir Technologies Inc. is, on paper, a work of art. The company has spent the last two decades building an operating system for modern warfare and corporate logistics that is essentially impossible to rip out once installed. This is the definition of a high-moat business. If you are a government agency or a Fortune 500 company using Palantir Gotham or Foundry, you are not just a customer: you are a partner in a long-term marriage where Palantir owns the house and the car.
The financial trajectory reflects this. In 2022, Palantir reported an operating loss of $161.2 million. Fast forward to the most recent filings, and the company is generating an operating margin of 45.64 percent. That is a staggering level of operational leverage. Revenue growth has accelerated to 95.90 percent year over year, driven by the massive adoption of its Artificial Intelligence Platform (AIP). When a company is growing at nearly 100 percent with 84 percent gross margins, the traditional rules of valuation often take a backseat to the sheer momentum of the compounding machine.
| Period | Revenue | Operating Income | Operating Margin | Free Cash Flow | SBC Expense |
|---|---|---|---|---|---|
| FY2022 | $1.91B | $-161.2M | -8.5% | $183.7M | $564.8M |
| FY2023 | $2.23B | $120.0M | 5.4% | $697.1M | $475.9M |
| FY2024 | $2.87B | $310.4M | 10.8% | $1.14B | $691.6M |
| FY2025 | $4.48B | $1.41B | 31.6% | $2.10B | $684.0M |
The Return on Invested Capital (ROIC) of 632.74 percent is an outlier that suggests Palantir is finding ways to deploy capital that are vastly more efficient than its peers. For the bulls, the current price is simply the entry fee for owning a generational technology asset that is just beginning to monetize the enterprise AI cycle.
Round 2: The Bear Cross-Examination of the Non-GAAP Mirage
The problem with the bull case is that it requires you to ignore the cost of the capital being used to generate those returns. While the revenue growth is undeniable, the quality of the cash flow remains a forensic battleground. Palantir Technologies Inc. issued $0.68 billion in stock-based compensation (SBC) over the last twelve months. This represents 16.7 percent of its operating cash flow.
When you strip out the SBC to find the real economic free cash flow available to common shareholders, the yield drops from an already thin 0.63 percent to a microscopic 0.47 percent. In a world where you can get 5.00 percent from a Treasury bill without having to worry about whether a change in Congressional leadership will jeopardize government contracts, the equity risk premium for Palantir is deeply negative. Specifically, the spread is negative 4.36 percent. You are essentially paying Palantir for the privilege of taking on its operational risk.
Furthermore, the working capital accruals show signs of strain. With a negative 5.72 percent impact from working capital, the company is seeing cash tied up in the business faster than it is being converted from the income statement. Then there is the valuation multiple itself. Even after the 19 percent drop, Palantir trades at 68.4x forward earnings and 54.4x revenue. To justify these levels, the company would need to maintain its current near-triple-digit growth rate for several more years without any degradation in margin or increase in competition.
| Company (Ticker) | Market Cap | Forward P/E | EV/EBITDA | Rev Growth (YoY) | Operating Margin | FCF Yield |
|---|---|---|---|---|---|---|
| Palantir Technologies (PLTR) | $418.5B | 68.4x | 118.2x | 95.90% | 45.64% | 0.63% |
| ServiceNow (NOW) | $106.8B | 21.4x | 33.1x | 20.5% | 12.8% | 5.39% |
| Snowflake (SNOW) | $108.1B | 100.6x | N/A | 35.1% | -22.4% | 1.61% |
| CrowdStrike Holdings (CRWD) | $240.3B | 145.8x | 2124.3x | 25.8% | -2.5% | 0.83% |
Compared to ServiceNow (NOW), which offers a 5.39 percent FCF yield and a much more reasonable 21.4x forward P/E, Palantir looks like a speculative bubble wrapped in a defense contract. Even Snowflake (SNOW) and CrowdStrike (CRWD), which carry their own high-growth premiums, do not possess the same level of absolute valuation extremity relative to their cash generation.
Round 3: Options Plumbing and the Max Pain Magnet
While the fundamental analysts debate the terminal value of AI, the options market is doing the heavy lifting of price discovery. The market structure for Palantir Technologies Inc. is currently balanced but carries a heavy speculative overhang. The Put/Call Open Interest ratio of 0.88 suggests that while there is some hedging activity, the predominant sentiment remains positioned for upside.
However, the Max Pain strike is sitting at $170.00. With the current spot price around $173.70, there is a natural magnetic pull toward that $170 level as we head toward the November 13 expiration. Dealers are currently in a neutral gamma regime, meaning they are not yet forced into the kind of reflexive selling that creates a true liquidity hole, but that could change if the $170 floor is breached.
The Call Wall resistance at $180 and $185 is formidable. Over 37,000 contracts are sitting at those strikes, acting as a ceiling for any relief rally. Meanwhile, the primary Put support does not show up in size until $150 and $130. This creates a significant air pocket between the current price and the next structural floor. If the 30-day expected move of plus or minus 13.32 percent resolves to the downside, the descent could be rapid as dealers unwind hedges.
Round 4: The Final Verdict and Risk Boundaries
The primary catalyst for the recent selloff appears to be a realization that the political landscape is shifting. With Democrats taking over Congress, the tailwinds for massive, unscrutinized defense and intelligence spending may face new friction. For a company like Palantir Technologies Inc., which relies on government contracts for a significant portion of its high-margin revenue, any delay in procurement cycles is a direct threat to the 95.9 percent growth narrative.
We must also address the “Benchmark Gravity” problem. Because Palantir is a core pillar of the S&P 500 with an approximate 0.8 percent weighting, institutional managers are often forced to hold the stock to avoid tracking error. This creates a floor of “must-buy” demand that has nothing to do with fundamentals and everything to do with index mechanics. However, when the fundamental story breaks, this passive support can evaporate as active managers rush to underweight the name.
The valuation is simply too far ahead of the cash flow reality. A 0.63 percent FCF yield is unsustainable in a 5.00 percent interest rate environment. The market is finally beginning to price in the risk that Palantir is a brilliant software company trapped in a sovereign bond’s world.
AllWallSt Investment Verdict: SELL (Downgrade from HOLD)
Palantir Technologies Inc. (PLTR)
Trailing P/E
Marcus Wolfe Screen
Leverage Profile
30D Channel
Dealer Gamma Pinning & Max Pain Alignment (PLTR)
🎯 Max Pain: $170.00
Spot $173.70
Ceiling $180C Resistance
MODERATE WATCHLIST (1 flag): Receivables growth outstripped revenue growth by >15%, pointing to potential revenue recognition or collection friction.
Fortress Balance Sheet (Net Cash Position; zero net refinancing distress).
Negative yield spread (-4.36% vs 5.00% Treasury); equity requires robust multiple expansion or growth.
Max Pain: $170.00 (-2.13%) | P/C Ratio: 0.88 | 30D Channel: $150.56 – $196.84. Dealer gamma bounded between $150 Put Wall and $180 Call Wall.
PLTR represents a core ~0.8% index pillar. Institutional managers face persistent benchmark drag if under-allocated during sector rallies, biasing sell-side consensus toward institutional overweight.
$176.40 – $183.60 (Call Wall Resistance Distribution Ceiling)
Sustained weekly close above $180.00 (Call Wall Resistance) or structural rebound in GAAP Free Cash Flow.
Sources & References
-
Palantir Technologies Inc. SEC Filings (CIK 0001321655): https://www.sec.gov/edgar/browse/?CIK=0001321655
- Palantir Investor Relations: https://www.palantir.com
- SEC Form 10-Q (Quarterly Report) filed November 3, 2026: https://www.sec.gov/Archives/edgar/data/1321655/000132165526000048/pltr-20260930.htm
- SEC Form 8-K (Earnings Release) filed November 2, 2026: https://www.sec.gov/Archives/edgar/data/1321655/000132165526000045/pltr-20261102.htm
Regulatory Disclaimer: This article is for informational purposes only and does not constitute investment advice, financial analysis, or a recommendation regarding any securities. AllWallSt and its contributors are not registered investment advisors. The price and value of investments and the income derived from them can go down as well as up, and you may not get back the amount you invest. Past performance is not a reliable indicator of future results. Standard market risks apply to all discussed equities, including Palantir Technologies Inc. (PLTR). Standard options risks apply to all quantitative market structure analysis. All data is sourced from primary SEC filings and exchange feeds as of November 11, 2026.