
⚡ Executive Morning Takeaways
- Overnight Futures & Rates Impulse: Equity futures are leaning defensive with E-Mini Nasdaq 100 contracts (NQ=F) leading the decline at -0.75%. The 10-Year Treasury yield is holding firm at the 5.00% handle, exerting gravity on high-multiple duration assets as the US Dollar Index (UUP) hits a fresh 52-week high.
- Sector Rotation Leaders & Laggards: Capital is clustering into Technology (XLK) and Energy (XLE), while Consumer Discretionary (XLY) remains the primary laggard. The rotation suggests a preference for high-margin software and inflation-linked commodities over interest-rate-sensitive consumer spend.
- Primary Corporate Catalyst: The Walt Disney Company (DIS) enters the pre-market session following a strategic AI collaboration with Adobe, aimed at streamlining production workflows. While the stock has seen overbought RSI signals recently, the options market shows a concentrated Call Wall at $120, capping immediate upside ahead of the November 17 earnings release.
🌐 Pre-Market Macro, Futures & Rates Dashboard
| Asset / Benchmark | Ticker | Current Price / Level | Change (%) | 52-Week Low | 52-Week High |
|---|---|---|---|---|---|
| E-Mini S&P 500 Futures (ES=F) | ES=F | $7612.75 | -0.36% | $6353.25 | $7897.50 |
| E-Mini Nasdaq 100 Futures (NQ=F) | NQ=F | $28259.75 | -0.75% | $22961.50 | $31616.50 |
| S&P 500 (SPY) | SPY | $759.81 | +1.32% | $629.28 | $781.62 |
| Nasdaq 100 (QQQ) | QQQ | $690.38 | +2.31% | $555.60 | $762.86 |
| Russell 2000 (IWM) | IWM | $283.09 | +0.89% | $228.90 | $305.18 |
| 20+ Year Treasury (TLT) | TLT | $80.92 | +0.05% | $76.43 | $90.86 |
| High Yield Corporate (HYG) | HYG | $77.35 | +0.22% | $76.39 | $81.24 |
| Gold (GLD) | GLD | $365.17 | -1.13% | $354.67 | $509.70 |
| WTI Crude Oil (CL=F) | CL=F | $85.81/bbl | -0.83% | $54.98 | $119.48 |
| US Dollar Index Bullish (UUP) | UUP | $29.35 | +0.69% | $26.40 | $29.36 |
| CBOE Volatility Index (^VIX) | ^VIX | 18.30 | +4.63% | 13.38 | 35.30 |
| 2-Yr US Treasury Yield (2YY=F) | 2YY=F | 4.75% | +0.00% | 3.38% | 4.88% |
| 10-Yr US Treasury Yield (^TNX) | ^TNX | 5.00% | +0.30% | 3.96% | 5.36% |
The macro regime remains dominated by the 5.00% barrier on the 10-Year Treasury. When risk-free paper pays 5%, the mathematical hurdle for equities becomes punishing. We are currently seeing a negative equity risk premium across many large-cap names, where investors are essentially paying for the privilege of taking corporate risk. The surge in the US Dollar Index (UUP) to $29.35 acts as a secondary tightening mechanism, pressuring multinationals with significant overseas revenue.
Volatility is creeping back into the frame, with the VIX rising over 4% this morning to 18.30. This suggests the complacency seen in early November is thawing. If the 30-year bond auction later today shows weak demand, expect the yield curve to bear-steepen further, which historically forces a re-rating of companies with high capital intensity.
📊 Sector Rotation Leaders & Laggards
| Rotation Rank | Sector ETF | Ticker | Price | Change (%) | Trailing P/E | Dividend Yield | 52-Week Low | 52-Week High |
|---|---|---|---|---|---|---|---|---|
| Leader (#1) | Technology (XLK) | XLK | $174.36 | +3.23% | 30.7x | 0.47% | $126.68 | $203.25 |
| Leader (#2) | Energy (XLE) | XLE | $63.37 | +1.86% | 15.8x | 2.18% | $43.77 | $70.15 |
| Leader (#3) | Industrials (XLI) | XLI | $170.97 | +1.33% | 27.4x | 1.13% | $147.14 | $188.19 |
| Spotlight Sector | Communication Services (XLC) | XLC | $108.60 | +0.78% | 17.3x | 1.38% | $99.33 | $120.41 |
| Laggard (#8) | Utilities (XLU) | XLU | $43.82 | +0.21% | 18.0x | 2.79% | $39.03 | $47.80 |
| Laggard (#9) | Healthcare (XLV) | XLV | $188.95 | +0.04% | 30.8x | 1.38% | $141.97 | $192.32 |
| Laggard (#10) | Consumer Discretionary (XLY) | XLY | $120.99 | -0.05% | 25.3x | 0.81% | $105.19 | $125.01 |
The sector dispersion is widening. Technology remains the runaway leader, trading at a steep 30.7x trailing multiple, as investors treat AI-exposed names as the new “defensive” play. Conversely, Consumer Discretionary is flat to negative, reflecting anxiety over the consumer’s ability to absorb persistent wholesale inflation. Communication Services (XLC), where Disney resides, is currently the middle-child of the market: offering a reasonable 17.3x multiple and a modest dividend, but lacking the explosive growth of pure-play semiconductors.
⏱️ Today’s Earnings & Economic Radar
Imminent Corporate Earnings Releases
| Company / Ticker | Timing | Consensus EPS | Consensus Revenue | Key Strategic Theme |
|---|---|---|---|---|
| Applied Materials (AMAT) | Today (Nov 12) | $4.05 | $10.30B | Gate-All-Around (GAA) & Advanced Packaging Equipment Spend |
| Cisco Systems (CSCO) | Today (Nov 12) | $1.33 | $18.13B | Enterprise AI Ethernet Switching & Splunk Security ARR |
| CoreWeave (CRWV) | Nov 10 (Reported) | $-0.64 | $4.80B | GPU Cloud Capacity Contracts & Sovereign Infrastructure CapEx |
| Walt Disney (DIS) | Nov 17 (Scheduled) | $1.69 | $25.15B | Direct-to-Consumer Streaming Operating Income & Parks DTC Demand |
| Home Depot (HD) | Nov 17 (Scheduled) | $3.84 | $42.77B | Pro-Contractor Backlog vs High-Rate Big-Ticket Remodeling |
| NVIDIA (NVDA) | Nov 17 (Scheduled) | $2.47 | $109.01B | Blackwell/Rubin Rack Shipments & Hyperscaler Gross Margin |
High-Impact Economic Data & Central Bank Actions
| Time (ET) | Event | Impact | Key Institutional Focus |
|---|---|---|---|
| 08:30 AM | Producer Price Index (PPI) Final Demand | CRITICAL | Wholesale Pipeline Margin Pass-Through |
| 08:30 AM | Initial Jobless Claims & Continuing Claims | HIGH | 4-Week Moving Average Labor Inflection |
| 01:00 PM | US 30-Year Treasury Bond Auction | CRITICAL | Long-Duration Pension & Foreign Demand |
The Producer Price Index (PPI) print at 08:30 AM is the primary gatekeeper for today’s session. If wholesale inflation remains sticky, it reinforces the “higher for longer” narrative that has already pushed the 10-Year yield to 5.00%. Institutional desks will also be laser-focused on the 30-Year Treasury auction at 1:00 PM: a “tail” in the auction results could trigger a sharp sell-off in long-duration equities.
🎯 Pre-Market Spotlight: The Walt Disney Company (DIS)
The Walt Disney Company (DIS) is currently engaged in a fascinating piece of corporate alchemy. For years, the narrative was about the transition from linear television to streaming: a process that involved burning billions of dollars in cash to acquire subscribers who might, one day, pay enough to cover the cost of the content they were consuming. Now, the story has shifted to margin recovery and “AI-enabled efficiency.” The recent deal with Adobe to integrate generative AI into production is the latest signal that management is desperate to lower the cost of its content flywheel.
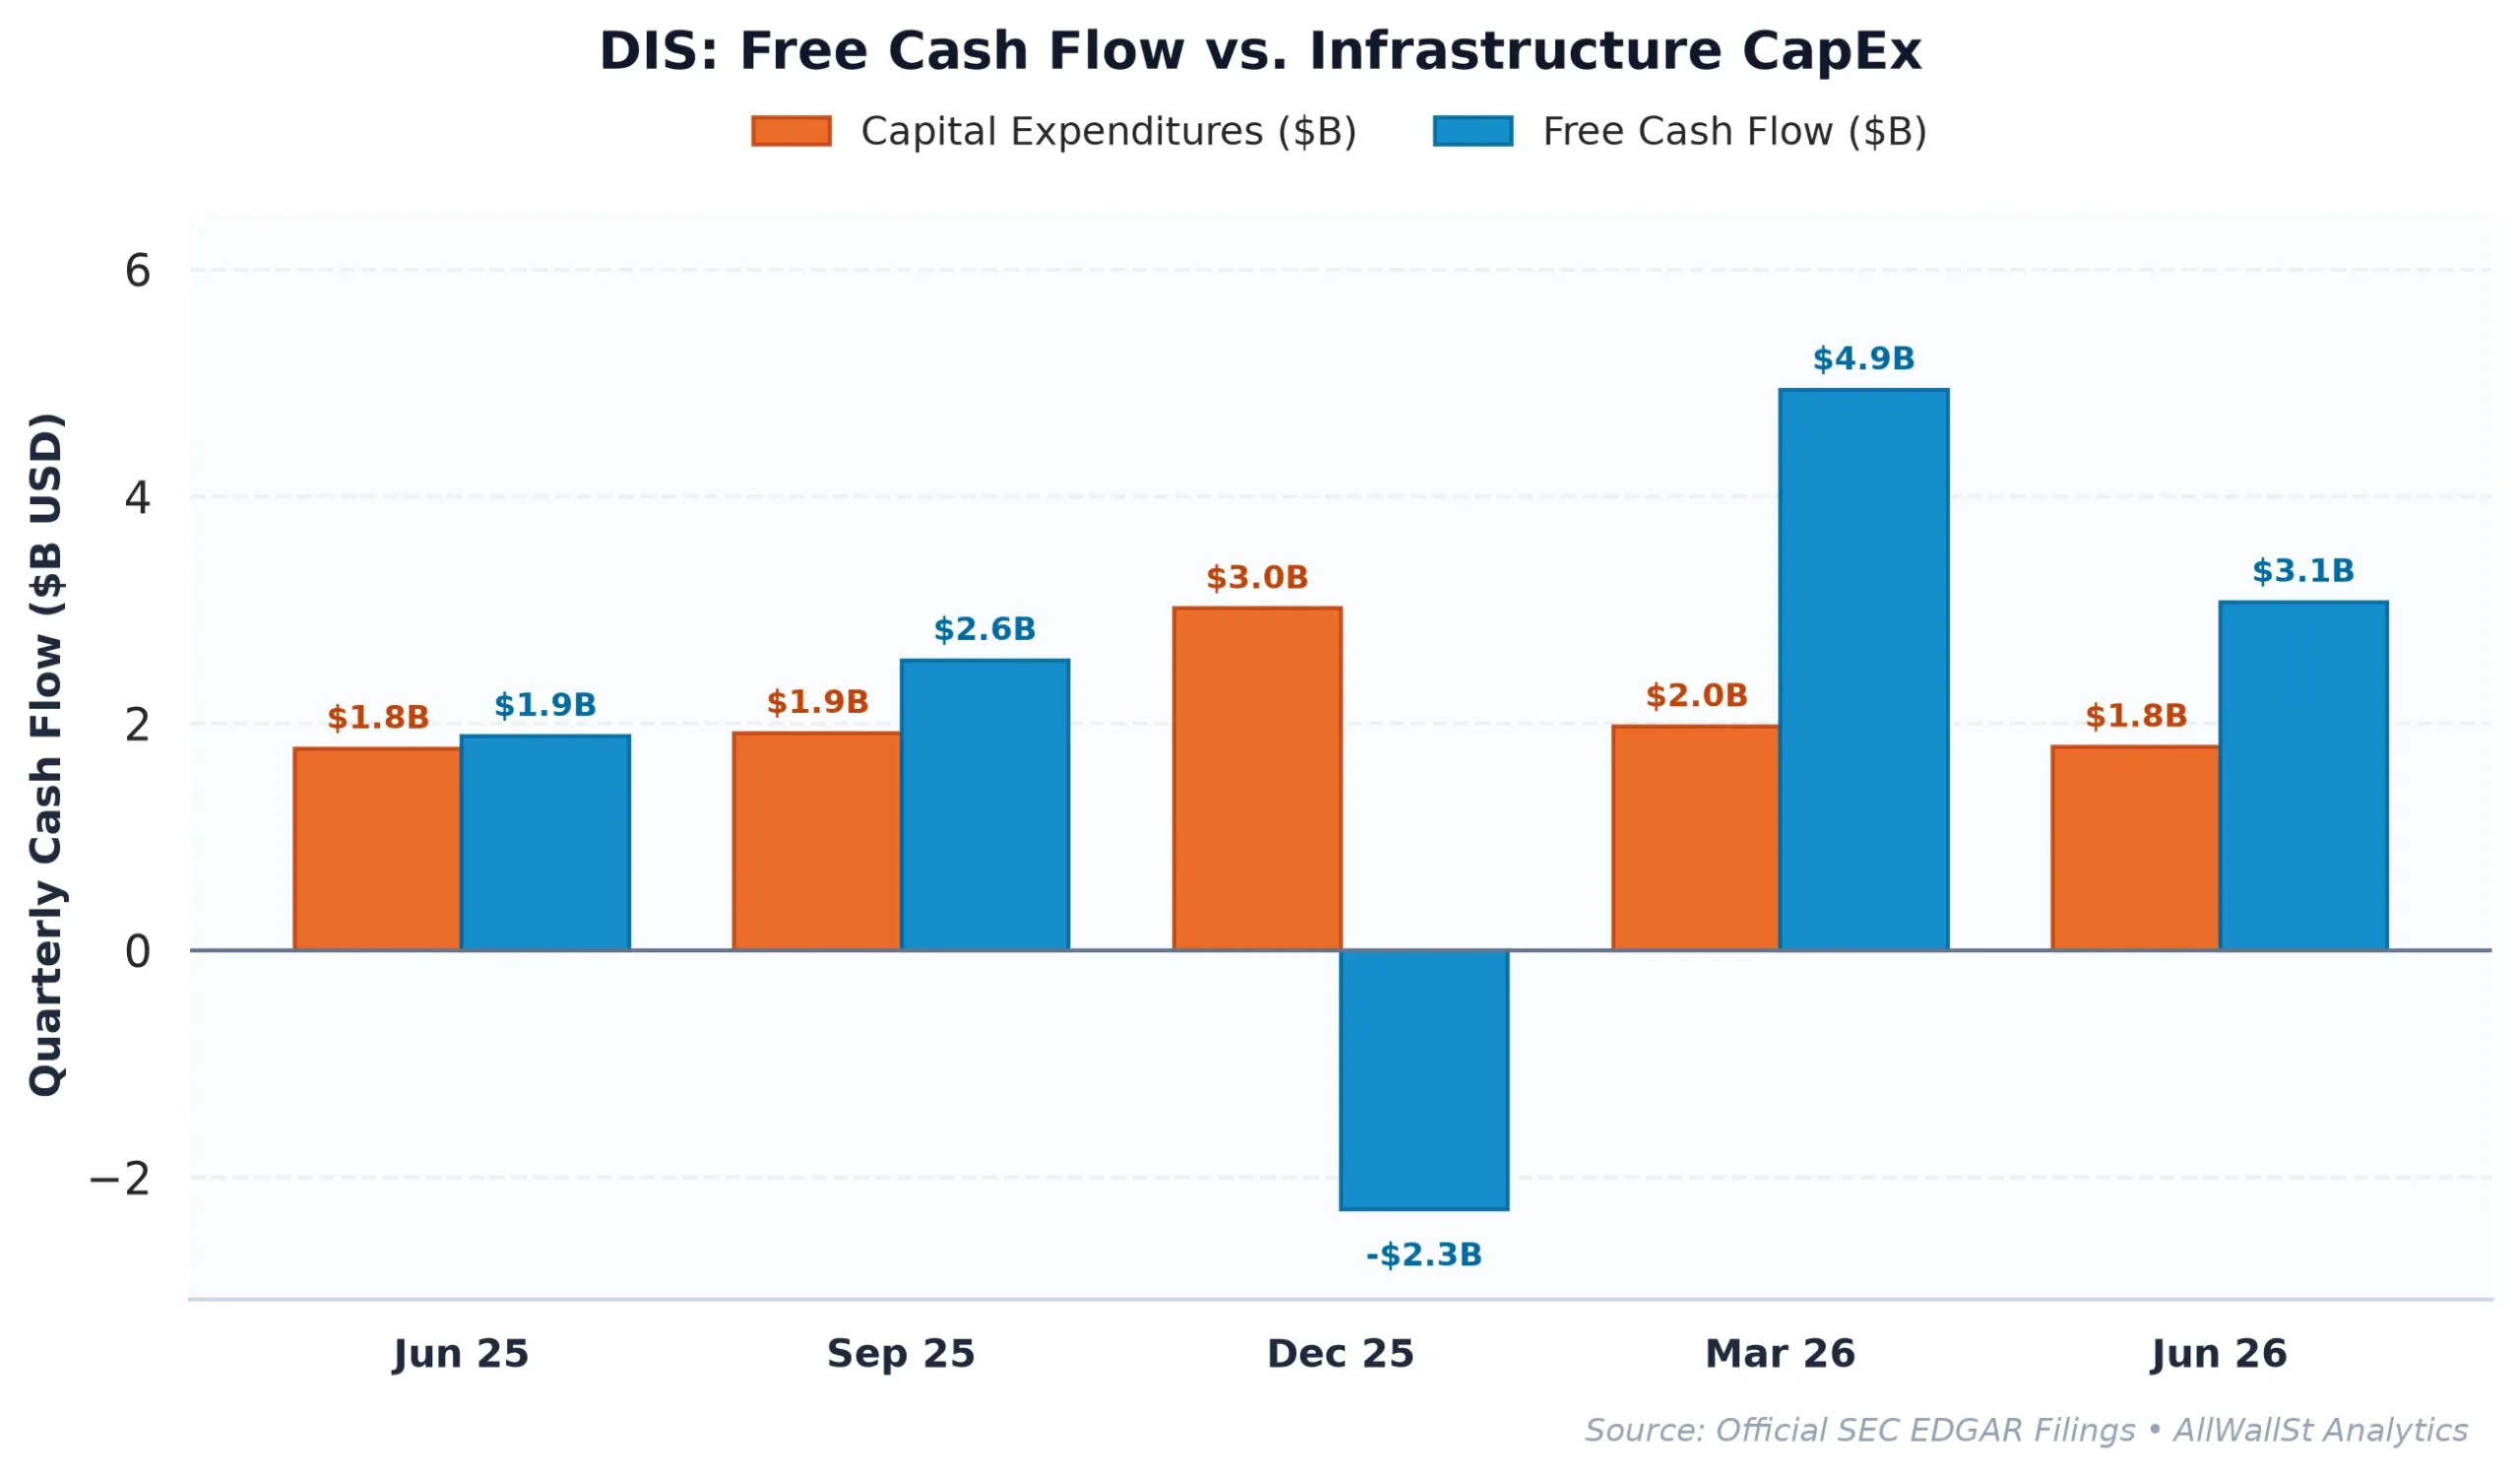
From a fundamental perspective, Disney is beginning to look like a disciplined operator again. Operating margins have climbed from a dismal 8.2% in FY2022 to a projected 15.6% today. However, the math remains tricky in a 5% rate environment. With a Free Cash Flow (FCF) yield of 2.35%, Disney is currently yielding significantly less than a risk-free US Treasury bond. When you subtract stock-based compensation (SBC), the “Real” FCF yield drops to a meager 1.69%. This creates a negative spread of -2.65% against the 10-Year yield, suggesting that the market is pricing in a massive acceleration in earnings that has yet to fully materialize.
Comparing Disney to its peers in the Communication Services and Tech space reveals the valuation gap. Microsoft (MSFT) and Alphabet (GOOGL) trade at much higher multiples, but they also boast operating margins in the 30% to 47% range. Disney’s 16.0x forward P/E is attractive relative to the S&P 500, but it reflects the reality that Disney is still a capital-intensive business: its CapEx intensity sits at 12.27%, largely driven by the relentless need to refresh theme park attractions and produce “must-watch” streaming hits.
The options market structure for DIS is currently balanced but shows signs of a near-term ceiling. Total put open interest is minimal at 83 contracts in the front expirations, while the Put/Call ratio of 0.85 indicates a neutral bias. The most important data point is the $120 Call Wall. With the stock trading at $119.65, dealers are heavily incentivized to pin the price below $120 to avoid being forced to buy underlying shares to hedge upside gamma. This suggests that unless the PPI data provides a massive tailwind, Disney may struggle to break out of its current range before its November 17 earnings report.
AllWallSt Investment Verdict: BUY
The Walt Disney Company (DIS)
Trailing P/E
Marcus Wolfe Screen
Leverage Profile
30D Channel
Dealer Gamma Pinning & Max Pain Alignment (DIS)
🎯 Max Pain: $94.00
Spot $119.65
Ceiling $120C Resistance
Pristine cash flow conversion (1.46x) and healthy accrual ratio (-2.88%). Zero accounting anomalies detected (LOW ANOMALY RISK).
Prudent Leverage (1.95x Net Debt/EBITDA); well within investment-grade covenant headroom.
Negative yield spread (-2.65% vs 5.00% Treasury); equity requires robust multiple expansion or growth.
Max Pain: $94.00 (-21.44%) | P/C Ratio: 0.85 | 30D Channel: $115.37 – $123.93. Dealer gamma bounded between $91 Put Wall and $120 Call Wall.
DIS carries standard index weighting (< 0.6% SPY footprint); sell-side consensus reflects standard earnings momentum rather than index-tracking mandates.
$89.18 – $92.82 (Options Support Pinning)
Sustained weekly close below $91.00 (Put Wall) or gross margin compression below 37.59%.
Sources & References
- Official SEC Form 10-Q Quarterly Report (Filed 2026-08-05)
- The Walt Disney Company Investor Relations: https://thewaltdisneycompany.com/investor-relations/
- SEC EDGAR Filing (Latest 10-K): https://www.sec.gov/Archives/edgar/data/1744489/000174448925000155/dis-20250927.htm
- SEC EDGAR Search (CIK 0001744489): https://www.sec.gov/edgar/browse/?CIK=0001744489
Regulatory Disclaimer: This report is for informational purposes only and does not constitute financial, legal, or investment advice. AllWallSt and its analysts are not registered investment advisors. All equity investments carry significant risk, and past performance is not indicative of future results. The analysis provided is based on public filings and market data believed to be reliable at the time of publication. Consult with a qualified financial professional before making any investment decisions. AllWallSt may hold positions in the securities mentioned.