
The fundamental beauty of an index fund is that it does not have to think. If you manage a passive vehicle tracking the MSCI USA Index, your job is not to wonder if a software company that spends all its time buying Bitcoin is a good investment. Your job is to buy the things in the index and sell the things that leave the index. It is a wonderfully mechanical existence. However, for Strategy Inc (MSTR), this mechanical reality has suddenly turned quite dark.
On Wednesday and into Thursday, November 12, 2026, the news broke that MSCI is dropping Strategy Inc from its flagship US index. This is not a matter of opinion or a “sell” recommendation from a research desk: it is a mandate for every passive fund manager on the planet to hit the ‘sell’ button by November 30. Estimates suggest roughly $2.8 billion in forced selling is coming for a stock that already trades like a high-beta fever dream.
Strategy Inc has long operated as a sort of perpetual motion machine. The company issues debt or sells stock to buy Bitcoin, which (hopefully) makes the stock price go up, which allows the company to issue more debt or sell more stock to buy more Bitcoin. It is a brilliant bit of financial engineering, provided the market is willing to pay a massive premium over the value of the underlying Bitcoin. But when the largest mechanical buyers in the world are legally required to exit the building, that premium starts to look very fragile.
The Software Side-Hustle and the Cash Flow Void
If you look at Strategy Inc as a software company, which is technically what its SEC filings claim it is, the numbers are difficult to process without a strong drink. For the fiscal year 2026, the company reported total revenue of roughly $495 million. That is a fine amount of money for a mid-sized enterprise software firm, but it is currently supporting a market capitalization of $48.2 billion. This gives us an Enterprise Value to Revenue multiple of 132x. For context, most software companies are considered expensive at 10x or 15x revenue.
The actual business operations are, to put it politely, secondary. Revenue growth is negative 2.5 percent year over year. The operating margin is a staggering negative 1100 percent. It is rare to see a margin that requires four digits to express, but Strategy Inc has managed it through a combination of shrinking core sales and massive impairment charges related to its digital asset holdings.
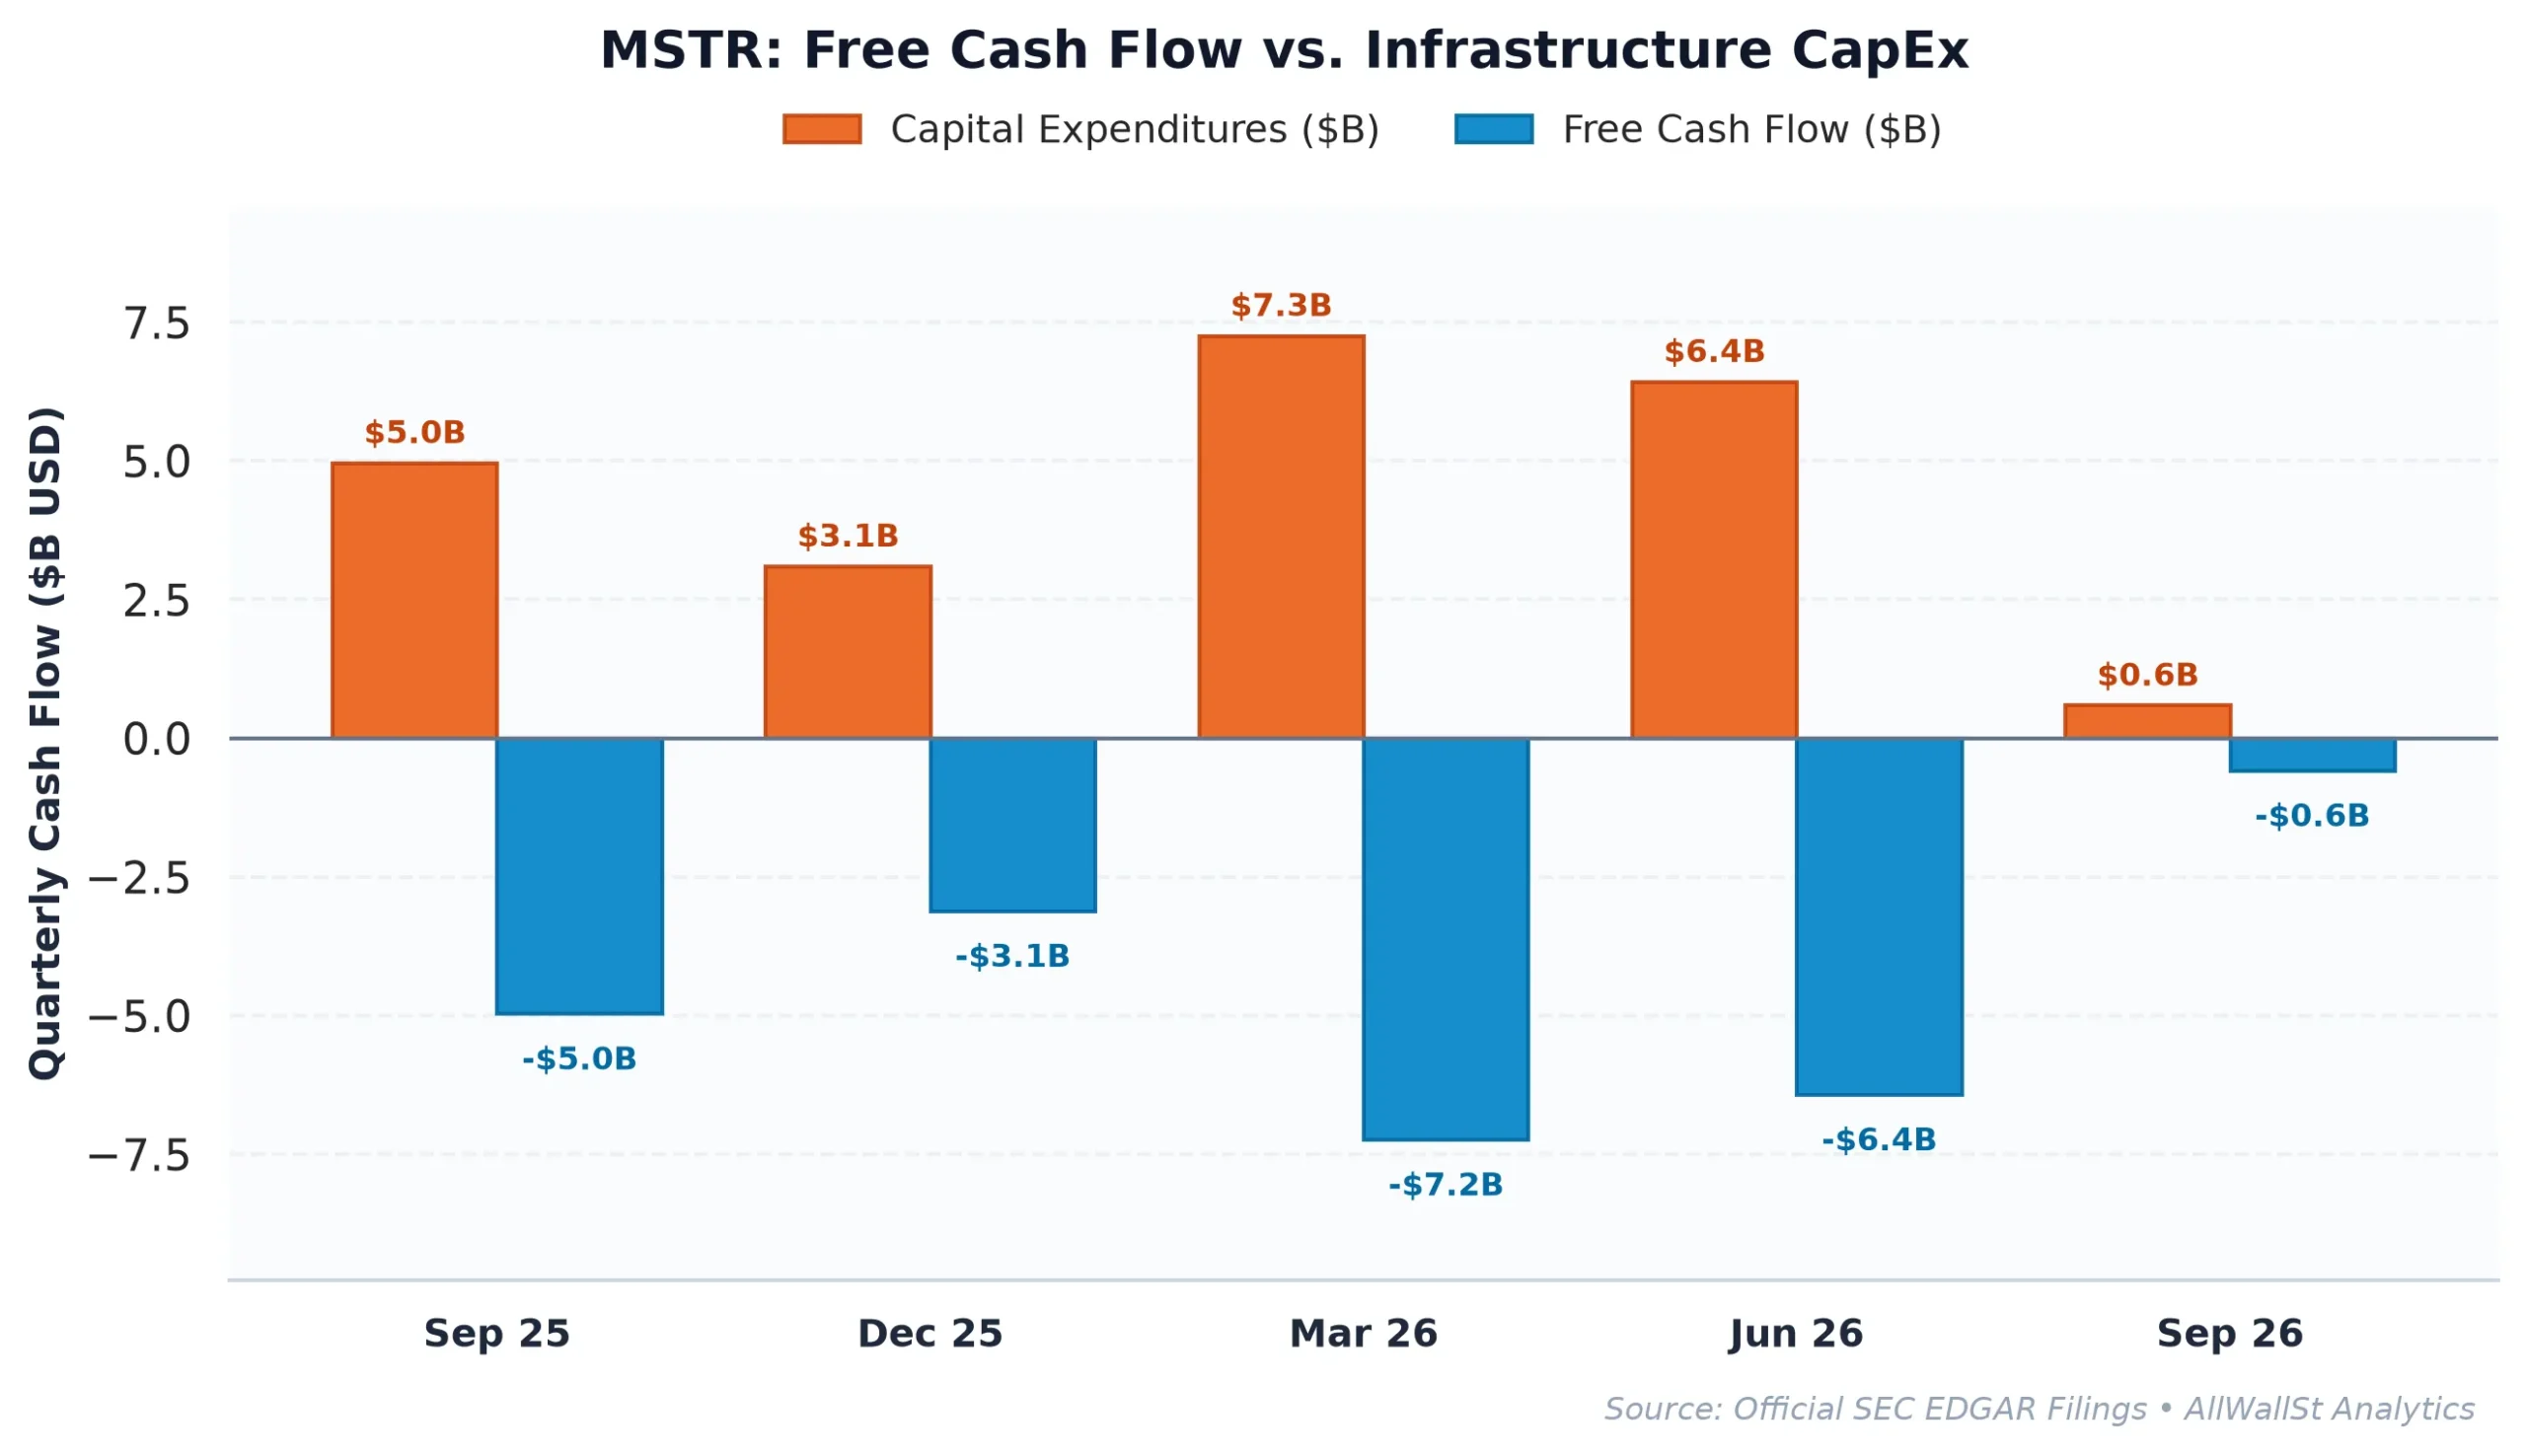
When we audit the cash flow, the picture becomes even more strained. The company reported a net loss of $14.89 billion. While much of this is driven by non-cash accounting for Bitcoin prices, the actual Free Cash Flow (FCF) was negative $3.24 billion. When you strip out the $50 million in stock-based compensation, the real economic drain on the business is nearly $3.29 billion. In an environment where the 10-Year Treasury Yield is sitting at 5.05 percent, investors are essentially paying Strategy Inc for the privilege of losing money at an industrial scale. The spread between the company’s negative 6.72 percent FCF yield and the risk-free rate is a cavernous negative 11.77 percent. This is not a value proposition: it is a high-stakes bet on a single asset class.
Peer Realities and the Premium Problem
To understand why the MSCI removal is so dangerous, one must look at how Strategy Inc compares to other firms in the digital asset and fintech ecosystem. While Strategy Inc trades at 132 times its revenue, its peers are operating in a different universe of valuation.
| Company (Ticker) | Market Cap | Forward P/E | EV/EBITDA | Rev Growth (YoY) | Operating Margin | FCF Yield |
|---|---|---|---|---|---|---|
| Strategy (MSTR) | $48.2B | 6.6x | N/A | -2.50% | -1100.13% | -6.72% |
| Coinbase Global (COIN) | $34.8B | 54.4x | 125.8x | -34.2% | 0.1% | 10.58% |
| Robinhood Markets (HOOD) | $74.0B | 24.1x | N/A | 11.8% | 45.7% | N/A |
| MARA Holdings (MARA) | $2.8B | N/A | N/A | -34.9% | -335.5% | -37.45% |
Coinbase Global (COIN) provides an interesting contrast. While it also deals in the volatility of the crypto markets, it actually generates a positive Free Cash Flow yield of 10.58 percent. Robinhood Markets (HOOD) is growing its revenue at 11.8 percent and maintaining a 45.7 percent operating margin. Strategy Inc, meanwhile, is shrinking its top line while burning through billions in cash.
The primary argument for owning Strategy Inc has always been the “Saylor Premium”: the idea that this is the most efficient, levered way to own Bitcoin within a brokerage account. But as Bitcoin ETFs have become ubiquitous and institutional-grade, that efficiency is debatable. If you own the Bitcoin ETF, you pay a small management fee. If you own Strategy Inc, you are paying for a legacy software business that is losing money and a management team that is constantly diluting shareholders to buy more tokens. The MSCI removal effectively removes a massive, price-insensitive buyer that helped maintain this premium. Without the index-mandated bid, the stock must trade on its own idiosyncratic merits, which are currently obscured by a mountain of debt and negative margins.
Gamma Pinning and the November 30 Cliff
The options market is currently reflecting a state of high-velocity uncertainty. The At-The-Money (ATM) Implied Volatility is a massive 73.46 percent, suggesting the market expects a 30-day move of plus or minus 21 percent. That is a lot of room for things to go wrong.
Interestingly, the Max Pain strike is sitting at $131, which is roughly 15 percent above the current price of $114. In a normal environment, this might suggest a magnetic pull upward as dealers hedge their positions. However, the structural reality of the MSCI exit creates a massive “Put Wall” at $80 and $90. If the forced selling by index funds begins in earnest as we approach the November 30 deadline, the dealer hedging could flip from supportive to accelerating. When dealers are short gamma, they are forced to sell into a falling market to stay delta-neutral. If $2.8 billion in sell orders hit the tape and break the current support levels, the mechanical nature of the options market could turn a rebalancing into a rout.
We last looked at Strategy Inc on October 8, 2026, when the stock was trading at $151.47. At that time, we issued a HOLD rating, noting that the “perpetual motion machine” was still functioning. Since then, the machine has hit a regulatory and structural wall. The software business continues to decay, the interest rate environment remains hostile with a 5.05 percent benchmark, and the single largest catalyst for the stock has shifted from “inclusion” to “eviction.”
The company’s negative ROIC of -7.98 percent against a WACC of 8.5 percent means that for every dollar of capital Strategy Inc deploys, it is effectively destroying value for shareholders. When you add a $2.8 billion forced liquidation event to a business that is already cash-flow negative and shrinking, the risk-reward profile shifts decisively to the downside. The premium to Net Asset Value is no longer a feature: it is a target.
AllWallSt Investment Verdict: SELL (Downgrade from HOLD)
Strategy Inc (MSTR)
Trailing P/E
Marcus Wolfe Screen
Leverage Profile
30D Channel
Dealer Gamma Pinning & Max Pain Alignment (MSTR)
🎯 Max Pain: $131.00
Spot $114.00
Ceiling $135C Resistance
Pristine cash flow conversion (0.02x) and healthy accrual ratio (-6.13%). Zero accounting anomalies detected (MODERATE WATCHLIST).
Manageable liability structure relative to institutional cash flow.
Negative yield spread (-11.77% vs 5.05% Treasury); equity requires robust multiple expansion or growth.
Max Pain: $131.00 (+14.92%) | P/C Ratio: 0.84 | 30D Channel: $89.99 – $138.01. Dealer gamma bounded between $80 Put Wall and $135 Call Wall.
MSTR operates with negligible index gravitational pull. Sell-side ratings reflect pure idiosyncratic fundamental consensus without passive indexing distortion.
$132.30 – $137.70 (Call Wall Resistance Distribution Ceiling)
Sustained weekly close above $135.00 (Call Wall Resistance) or structural rebound in GAAP Free Cash Flow.
Sources & References
- Official SEC Form 10-K Annual Report (Filed 2026-02-19)
- SEC EDGAR Filings for Strategy Inc (CIK: 0001050446): https://www.sec.gov/edgar/browse/?CIK=0001050446
- Strategy Inc Investor Relations: https://www.strategy.com
- MSCI Index Announcement (November 2026 Review): https://www.msci.com/index-review
- SEC Form 10-Q (Quarterly Report) filed November 2, 2026: https://www.sec.gov/Archives/edgar/data/1050446/000105044626000060/mstr-20260930.htm
Disclaimer: This report is for informational purposes only and does not constitute financial advice. The author is a financial journalist and may hold positions in the securities mentioned. All investments involve risk, and past performance is not indicative of future results.