
The Governance Shock and the Key-Person Haircut
There is a specific type of market panic that occurs when a company becomes synonymous with a single human being, and that human being suddenly decides to do something else. For NVIDIA Corporation (NVDA), that human is Jensen Huang. For the better part of a decade, the investment thesis for the entire semiconductor industry has essentially been a bet on one man’s ability to predict the future of accelerated computing while wearing a black leather jacket. Today, that thesis hit a structural wall.
The news broke this afternoon with the clinical coldness of a regulatory disclosure. NVIDIA filed a Form 8-K under Item 5.02, announcing the departure of its founder and CEO. In the world of corporate governance, Item 5.02 is the section where dreams go to die, or at least where the market finds out that the person responsible for a $4 trillion market capitalization is leaving the building. The stock immediately dropped nearly 10 percent, which, for a company of NVIDIA’s size, is equivalent to erasing the entire market value of several mid-sized European nations in a single trading session.
The problem for NVIDIA is not just that it lost a CEO. It is that it lost its primary narrative engine. When a company grows its revenue by 105.9 percent year-over-year, as NVIDIA did in its most recent reporting period, investors are willing to overlook a lot of things. They will overlook the fact that the Free Cash Flow (FCF) yield is a measly 1.05 percent, which is significantly lower than the 5.07 percent you can get from a risk-free 10-Year Treasury bond. They will overlook the $92.55 billion in capital expenditures. They will even overlook the fact that the company is trading at over 17 times its book value. They do this because they believe in the visionary at the helm. When that visionary leaves, the “key-person haircut” is applied immediately and without mercy.
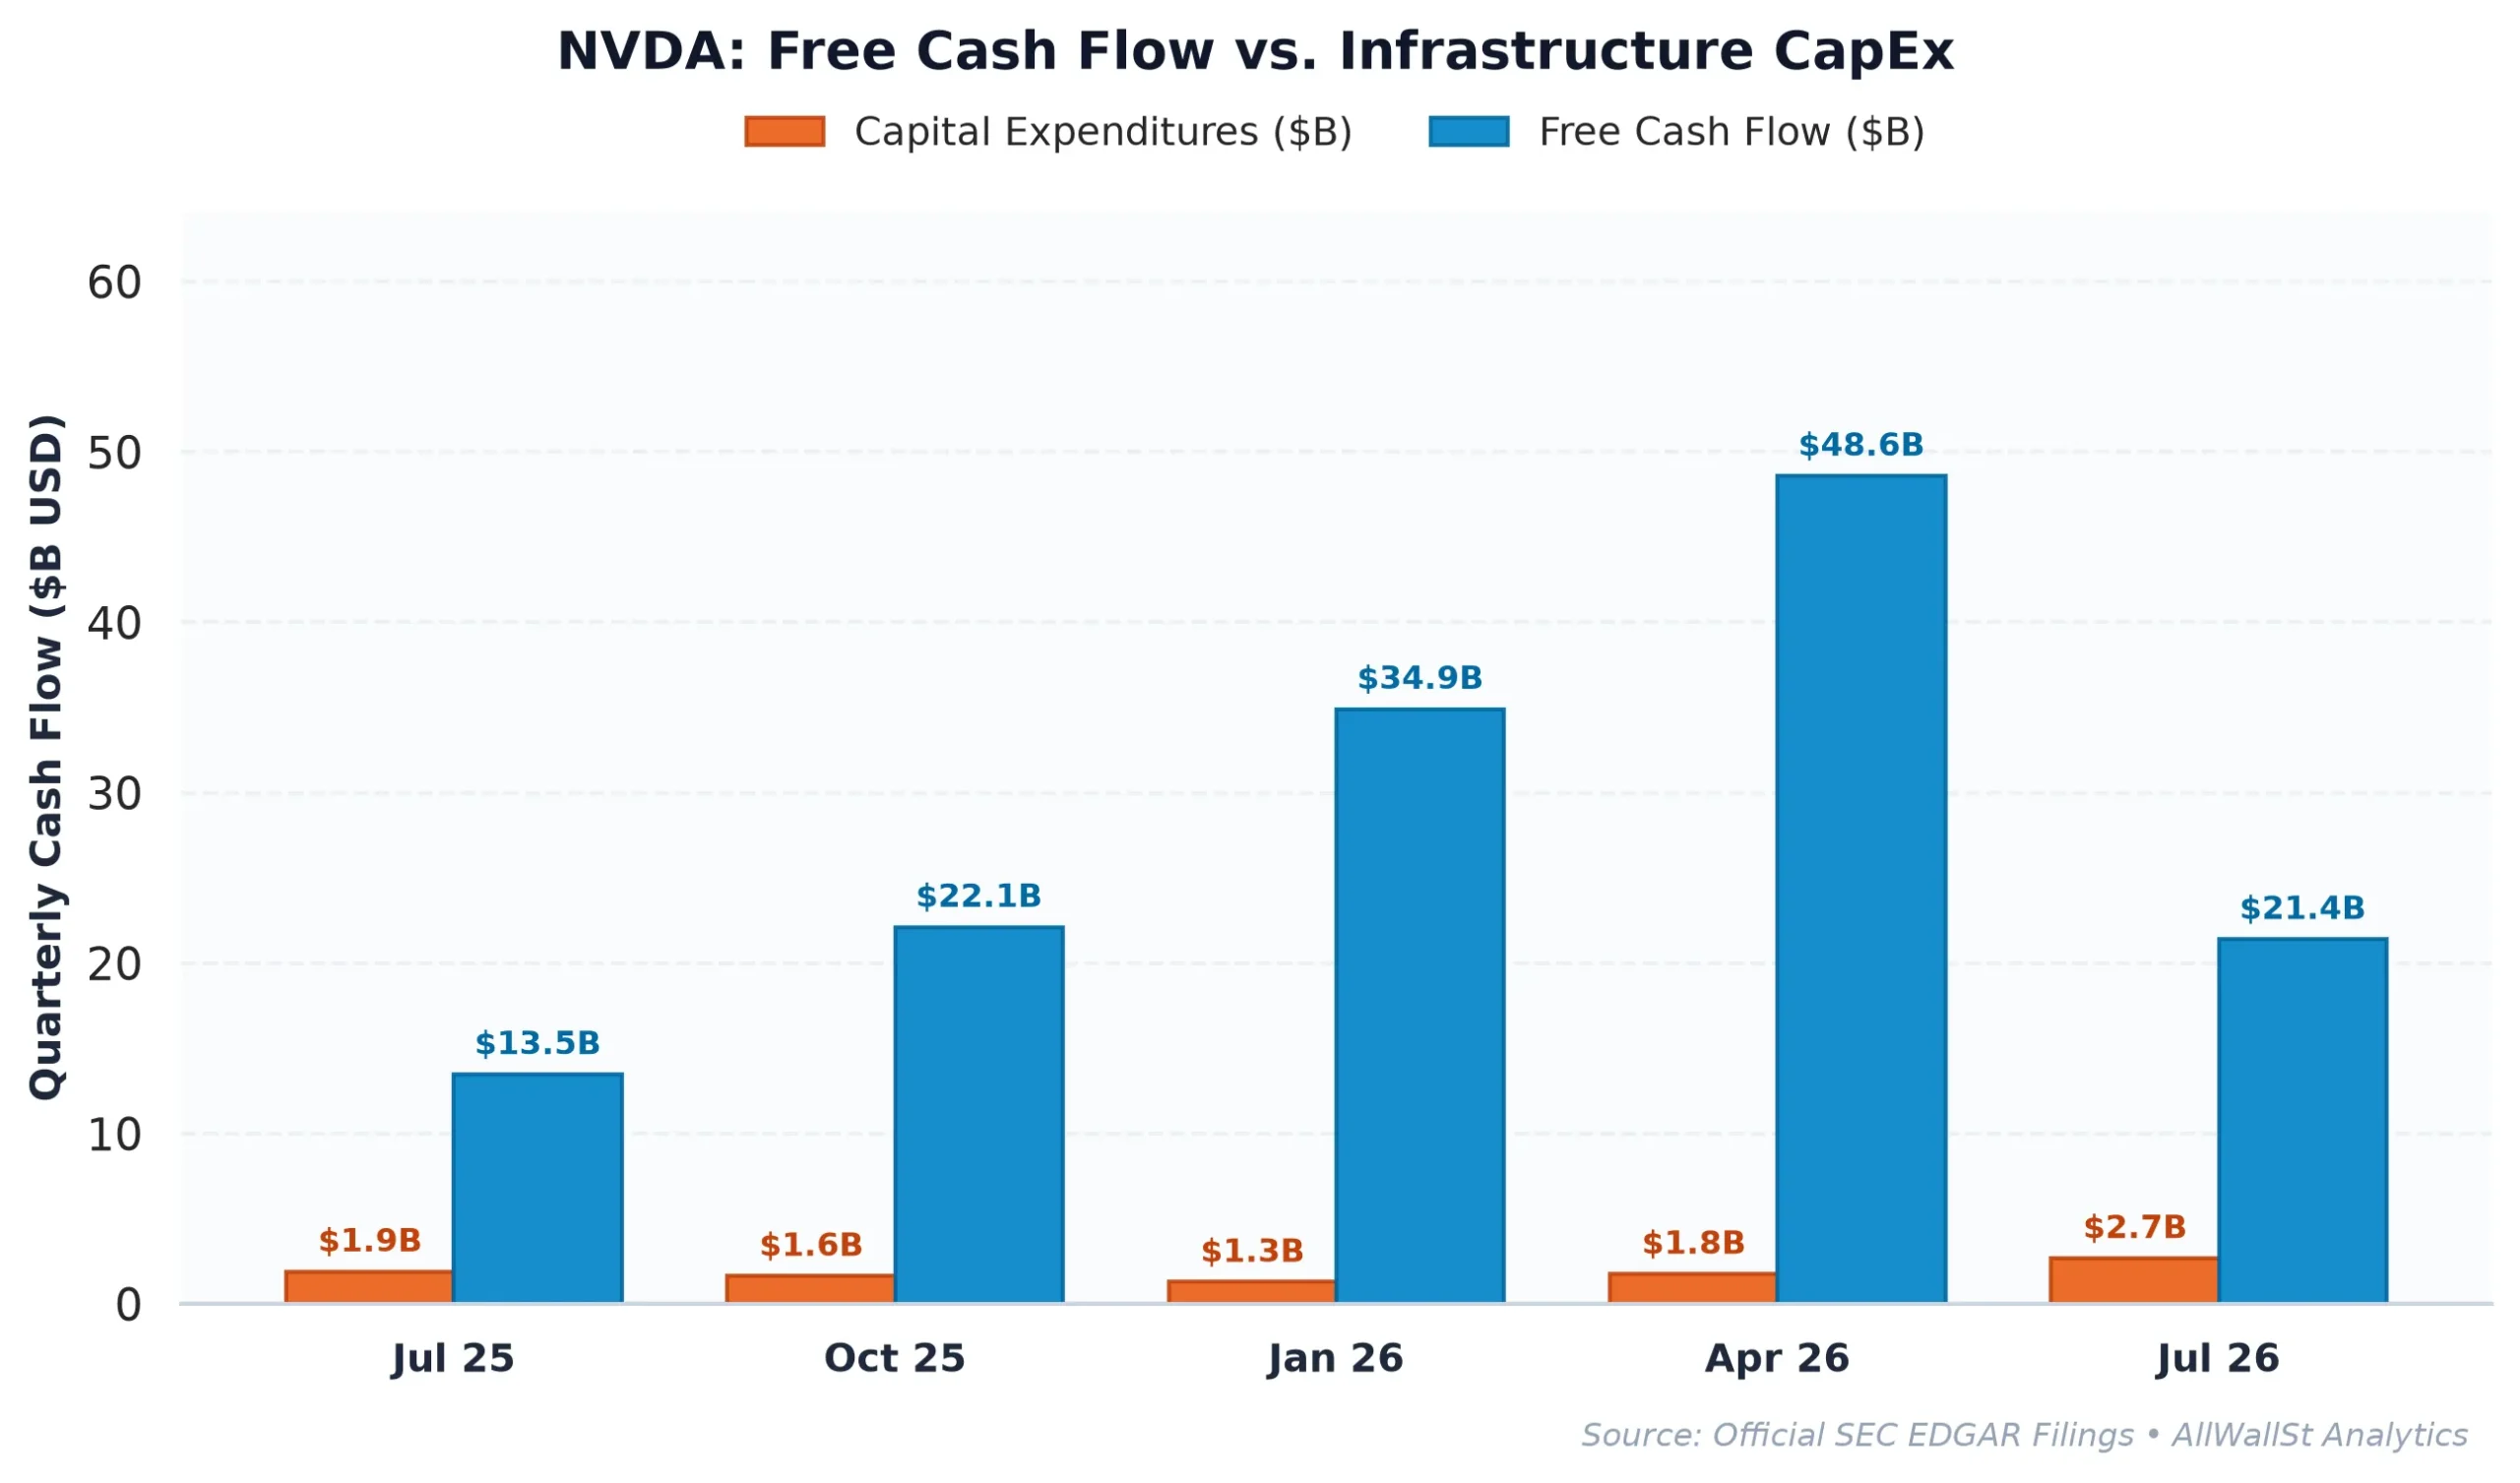
The $215 Billion Trajectory and the CapEx Reality
To understand why the market is reacting with such violence, we have to look at the sheer scale of the financial machine NVIDIA has built over the last four years. In fiscal year 2023, the company was generating $26.97 billion in revenue with an operating margin of 20.7 percent. It was a respectable business, but it was not yet the sun around which the entire technology sector orbited. By fiscal year 2026, revenue has exploded to $215.94 billion, and the operating margin has expanded to a staggering 60.4 percent.
This is not supposed to happen to hardware companies. Usually, as you scale, your margins compress because of competition and the physical reality of manufacturing things. NVIDIA, however, managed to behave like a software monopoly with the pricing power of a luxury brand. The table below illustrates this unprecedented ascent:
| Period | Revenue | Operating Income | Operating Margin | Free Cash Flow | SBC Expense |
|---|---|---|---|---|---|
| FY2023 | $26.97B | $5.58B | 20.7% | $3.81B | $2.71B |
| FY2024 | $60.92B | $32.97B | 54.1% | $27.02B | $3.55B |
| FY2025 | $130.50B | $81.45B | 62.4% | $60.85B | $4.74B |
| FY2026 | $215.94B | $130.39B | 60.4% | $96.68B | $6.39B |
The catch, of course, is the capital intensity required to maintain this lead. NVIDIA’s CapEx intensity is currently 30.55 percent, representing over $92 billion in spending. This is “ghost CapEx” in the sense that while the cash leaves the balance sheet today, the depreciation hit to the income statement is deferred. Furthermore, while the company reports $41.8 billion in Free Cash Flow, a significant chunk of that value is offset by $6.39 billion in Stock-Based Compensation (SBC). When you strip away the SBC, the real economic FCF yield drops to 0.89 percent. In a world where the 10-Year Treasury yield is sitting at 5.07 percent, you are essentially paying a massive premium for the privilege of owning a company that is currently returning less cash to you than the federal government.
Peer Relative Valuation and the Moat Question
The central question for the interim leadership is whether the competitive moat Jensen Huang built can survive his absence. NVIDIA currently commands a 65.21 percent operating margin, which is vastly superior to its closest rivals. For comparison, Advanced Micro Devices (AMD) is operating at a 17.8 percent margin, and even the foundry giant Taiwan Semiconductor (TSM) sits at 58 percent.
NVIDIA’s forward P/E of 10.3x looks remarkably cheap on the surface, especially compared to AMD’s 32.1x. However, this multiple assumes that the 105.9 percent revenue growth is sustainable without the strategic guidance of its founder. Wall Street’s institutional consensus remains a Strong Buy, largely because NVIDIA represents 7.3 percent of the S&P 500. For an index-tracking fund manager, being underweight NVIDIA is a career-ending risk. If the stock goes up and you do not own it, you lose your job. If the stock goes down and you own it, you can simply blame the market. This forced institutional bid creates a floor, but it does not necessarily reflect fundamental value.
| Company (Ticker) | Market Cap | Forward P/E | EV/EBITDA | Rev Growth (YoY) | Operating Margin | FCF Yield |
|---|---|---|---|---|---|---|
| NVIDIA (NVDA) | $3.99T | 10.3x | 20.7x | 105.90% | 65.21% | 1.05% |
| Advanced Micro Devices (AMD) | $932.4B | 32.1x | 80.8x | 44.7% | 17.8% | 0.79% |
| Broadcom (AVGO) | $1.73T | 18.6x | 32.2x | 85.5% | 48.8% | 1.77% |
| Taiwan Semiconductor M (TSM) | $2.11T | 17.4x | 3.9x | 50.9% | 58.0% | 1.73% |
The disparity between NVIDIA and its peers is largely a function of its vertical integration. While Broadcom and AMD are fighting for specific niches in the data center, NVIDIA has built an entire ecosystem (CUDA) that makes its hardware sticky. The danger is that without Huang, the aggressive roadmap that keeps customers locked in might lose its edge. If the operating margin begins to decay toward the industry average of 40 to 50 percent, the current valuation, even at 10x forward earnings, starts to look optimistic.
Options Gamma Pinning and the Path to Stability
As the fundamental analysts debate the future of the AI cycle, the options market is doing the actual work of setting the price floor. The current market structure for NVIDIA is defined by a heavy speculative long skew, with a Put/Call Open Interest ratio of 0.64. This means there are far more people betting on upside calls than hedging with downside puts.
When a CEO departs unexpectedly, this positioning becomes a liability. As the stock price falls, options dealers who are long the stock to hedge the calls they sold must sell that stock to remain delta-neutral. This creates a mechanical selling pressure that can accelerate a decline. We see significant “Put Walls” at $160 and $165. These levels represent the strikes where dealers have the most significant hedging requirements. If the price manages to hold above $160, the dealer hedging will likely act as a cushion, pinning the stock in a range as the market waits for more clarity on the succession plan.
The Max Pain strike is currently at $175, which is nearly 6 percent above the current price. In a normal week, we would expect the price to gravitate toward that strike as expiration approaches. However, the governance shock is a “gamma-shifting” event. The expected 30-day move is now +/- 23 percent, suggesting that the market is pricing in extreme uncertainty. Until the board provides a clear roadmap for the next phase of leadership, the stock is likely to remain trapped between the $160 support and the $190 call resistance wall. Fundamental execution remains elite, but the loss of the visionary premium means that the stock is no longer a “buy at any price” asset. It is now a “wait and see” story.
AllWallSt Investment Verdict: HOLD (Governance Shock)
NVIDIA Corporation (NVDA)
Trailing P/E
Marcus Wolfe Screen
Leverage Profile
30D Channel
Dealer Gamma Pinning & Max Pain Alignment (NVDA)
🎯 Max Pain: $175.00
Spot $165.16
Ceiling $190C Resistance ▲
MODERATE WATCHLIST (1 flag): Inventory growth outpaced COGS growth by >15%, signaling potential inventory bloat or pending margin compression.
Fortress Balance Sheet (Net Cash Position; zero net refinancing distress).
Negative yield spread (-4.02% vs 5.07% Treasury); equity requires robust multiple expansion or growth.
Max Pain: $175.00 (+5.93%) | P/C Ratio: 0.64 | 30D Channel: $126.77 – $203.55. Dealer gamma bounded between $160 Put Wall and $190 Call Wall.
NVDA commands a massive ~7.3% S&P 500 benchmark footprint. Wall Street sell-side consensus reflects structural career-risk defense: institutional funds face severe benchmark tracking penalties for underweighting mega-cap heavyweights, forcing mandatory allocations regardless of current Free Cash Flow yield.
Accumulation Deferred (Await Pullback toward $156.80 – $163.20 Support Pinning)
Sustained weekly close below $160.00 (Put Wall) or acceleration in margin compression.
Sources & References
- Official SEC Form 10-K Annual Report (Filed 2026-02-25)
- Official SEC Form 10-Q Quarterly Report (Filed 2026-08-26)
- NVIDIA Corporation Investor Relations: https://www.nvidia.com
- SEC EDGAR Filing Form 8-K (Filed Nov 12, 2026): https://www.sec.gov/Archives/edgar/data/1045810/000104581026000082/nvda-20261111.htm
- SEC EDGAR Company Search: https://www.sec.gov/edgar/browse/?CIK=0001045810
- U.S. Department of the Treasury (10-Year Benchmark): https://home.treasury.gov
Disclaimer: AllWallSt is a financial publisher, not an investment advisor. This analysis is for informational purposes only and does not constitute a recommendation to buy or sell any security. Investing in equities involves substantial risk, including the loss of principal. Please consult with a qualified financial professional before making any investment decisions.
Investigative Reporting & Public Record Sourcing: Dispatches published under Word on Wall St constitute financial news reporting, investigative journalism, and market commentary on matters of public and economic interest. Information is synthesized from publicly available regulatory filings (including SEC Form 8-K, Form 10-K, and Form 10-Q disclosures), official corporate press communications, verified news reports, and discussions with institutional market participants.
Presumption of Innocence & Unadjudicated Allegations: Any references to executive conduct, personal relationships, workplace misconduct, whistleblower claims, espionage inquiries, internal governance reviews, or government investigations represent reported allegations and active inquiries as of the publication date. They do not constitute formal judicial determinations, legal verdicts, or findings of guilt, civil liability, or statutory wrongdoing unless expressly identified as adjudicated final court judgments.
Protected Editorial Commentary & Non-Investment Counsel: All quantitative scenario analyses, key-person risk haircuts, forward valuation estimates, dealer gamma pinning levels, and investment conviction ratings reflect protected analytical opinion, editorial commentary, and financial modeling under the First Amendment. Nothing herein constitutes legal counsel, personal tax advice, or individualized investment advice. AllWallSt and its contributors assume no liability for trading, investment, or commercial decisions taken on the basis of this report.