
The prevailing wisdom on Wall Street regarding The Home Depot, Inc. (HD) usually follows a fairly predictable, if somewhat unimaginative, script. The logic goes something like this: interest rates are high, the 10-Year Treasury is hovering around 5.08%, and therefore, nobody is buying houses. If nobody is buying houses, nobody is buying new kitchen cabinets or expensive flooring. Consequently, you should sell the company that sells the cabinets. It is a clean, linear, and remarkably intuitive piece of reasoning that happens to ignore how people actually behave when they are trapped in their homes by the golden handcuffs of a 3% mortgage.
If you cannot afford to move because your current monthly payment would double the moment you signed a new deed, you do not simply stop caring about your leaking faucet or your dated backsplash. In fact, you might spend more. You transition from the aspirational “I will fix this to sell it” mindset to the practical “I am stuck here for a decade, so I might as well make it livable” mindset. This is the structural reality that the mainstream consensus often misses. While the retail DIYer might be deferring the purchase of a new cordless drill, the professional contractor (the Pro) is still working through a backlog of renovations for homeowners who have decided to stay put and reinvest in their existing footprints.
The market currently views Home Depot through a lens of skepticism, pointing to a Free Cash Flow (FCF) yield of 3.08% which looks objectively unappealing when compared to the risk-free return of Uncle Sam. When the spread between equity cash yields and sovereign debt is negative 201 basis points, the valuation gravity is supposed to pull the stock lower. Yet, Home Depot continues to trade at 22.0x forward earnings because it is not a bond proxy: it is a high-efficiency compounding machine with a 20.67% Return on Invested Capital (ROIC).
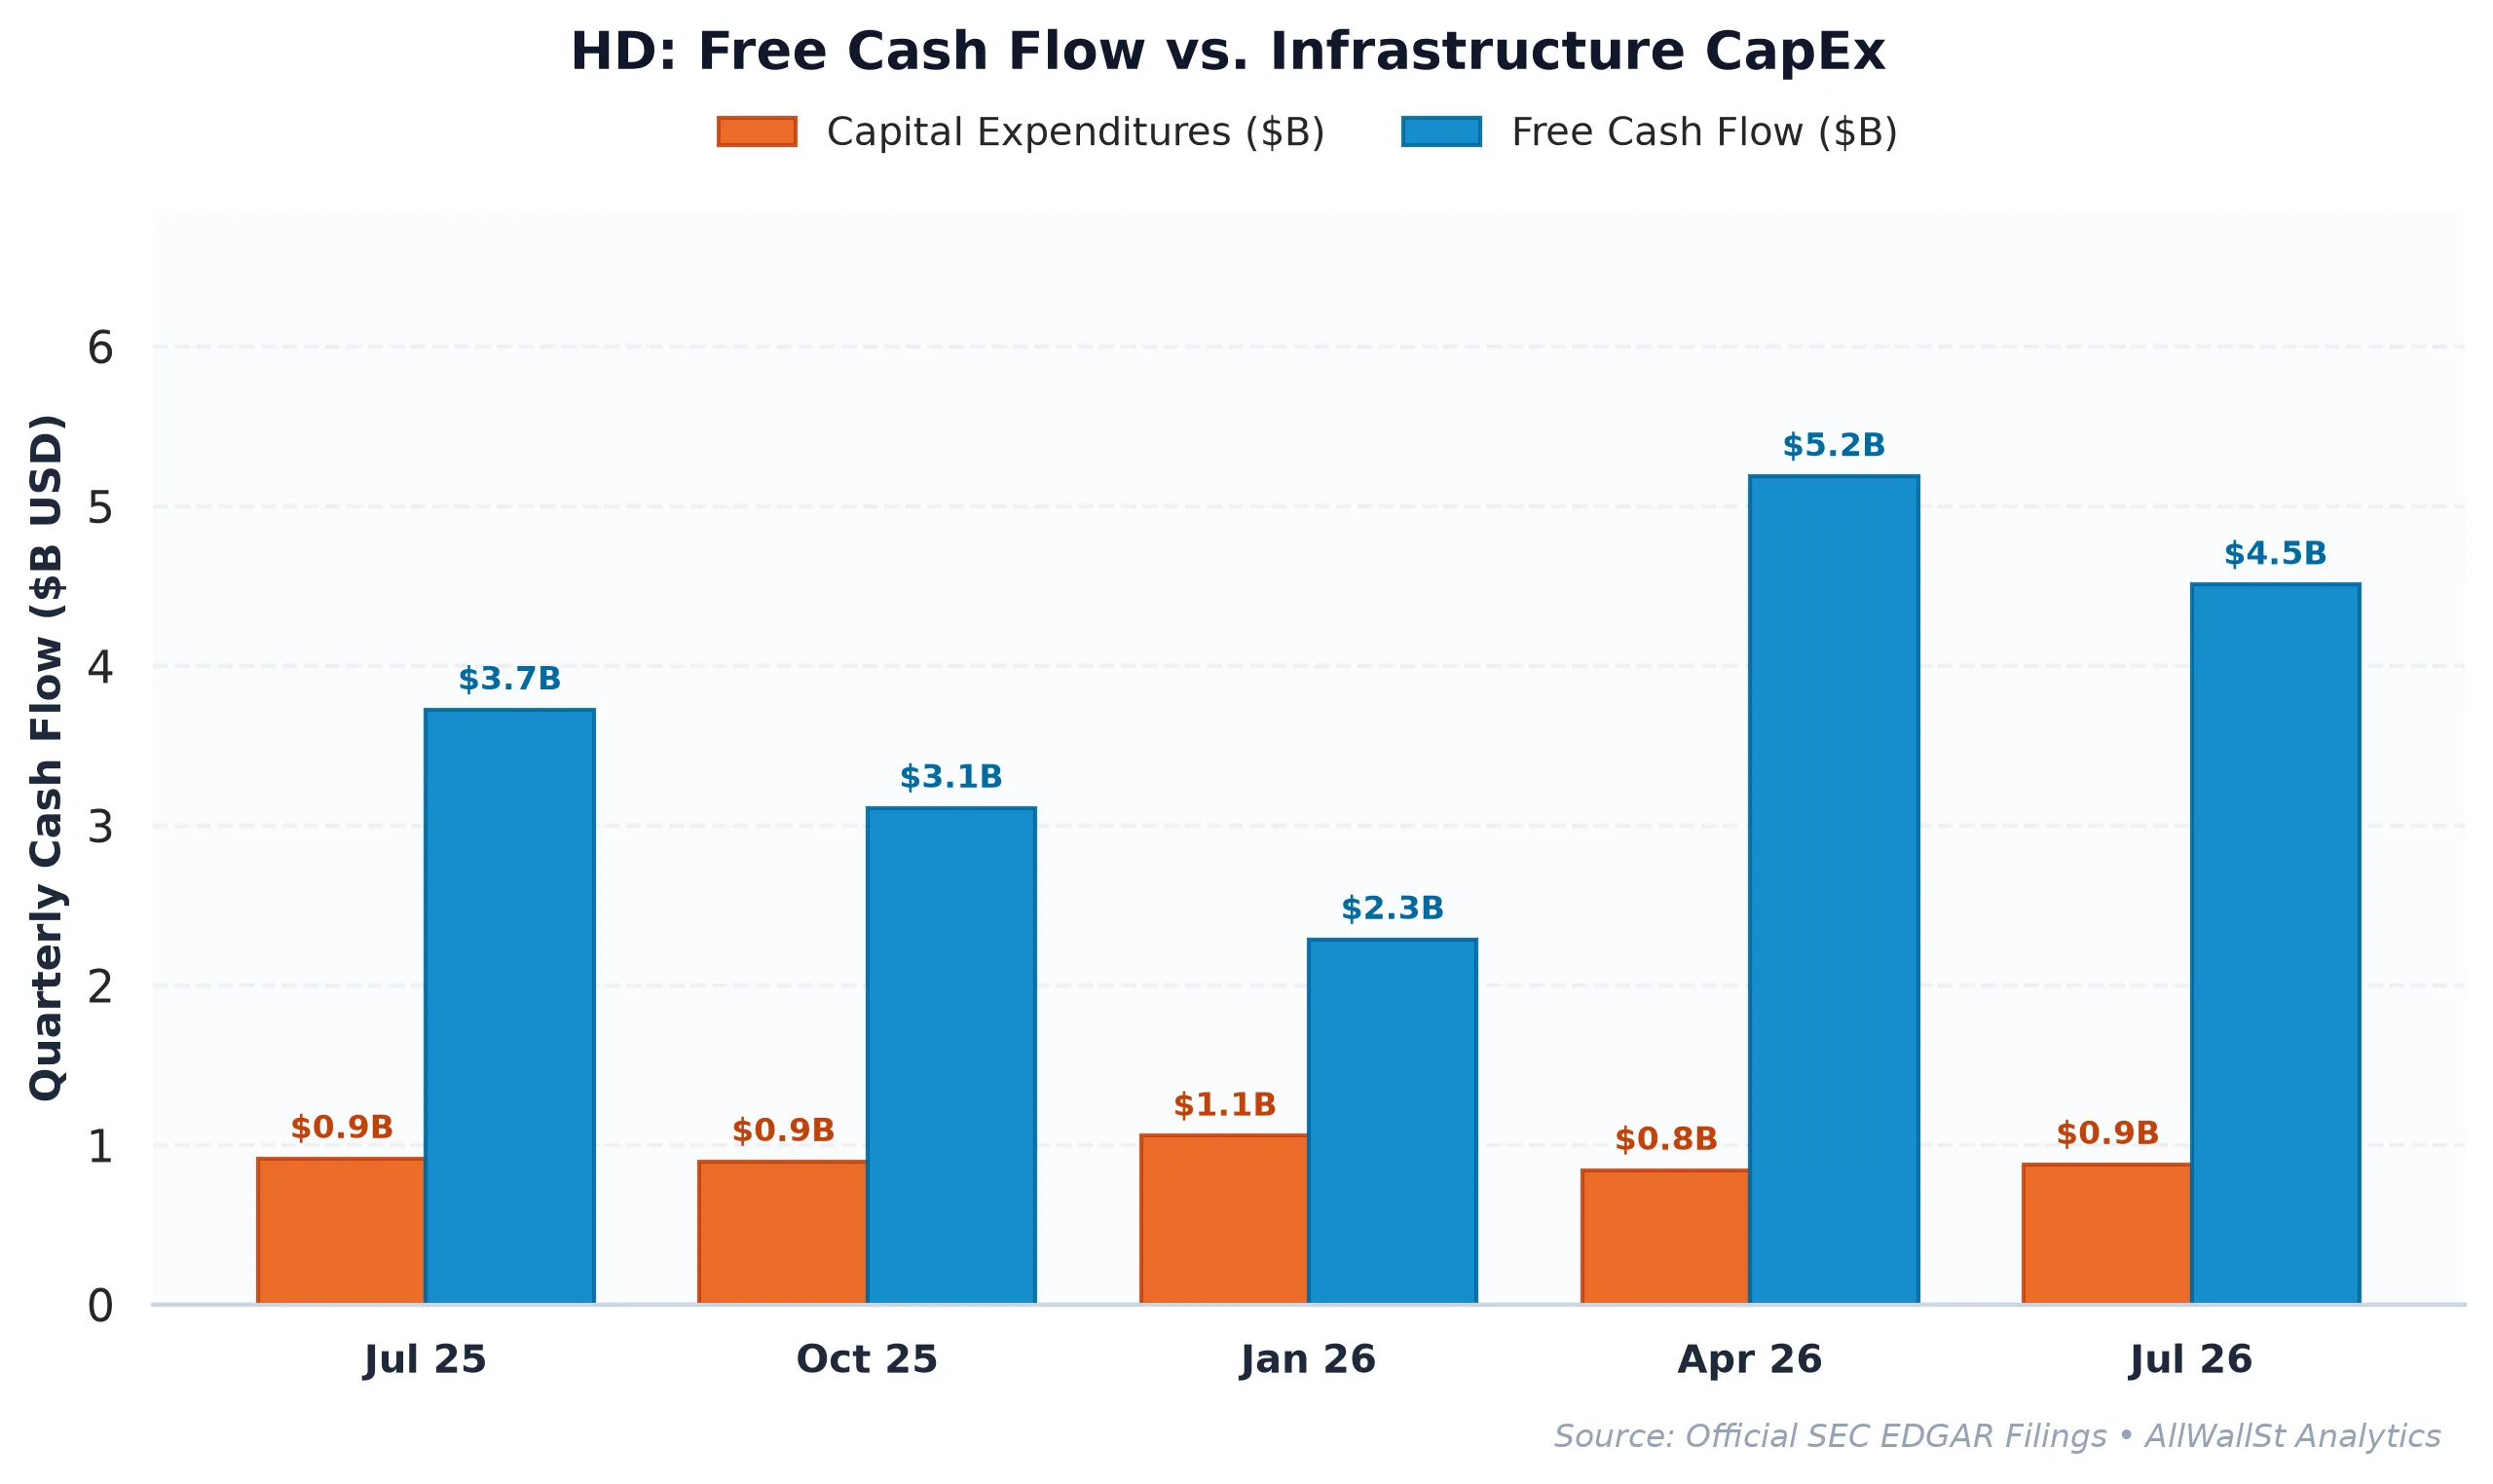
The Margin Compression Narrative vs. The Investment Reality
To understand where Home Depot is going, we have to look at where its cash has been traveling over the last four years. A cursory glance at the historical fundamental trajectory reveals what looks like a slow leak in the hull. In FY2023, the company boasted an operating margin of 15.3%. By FY2026, that figure has drifted down to 12.7%. In the world of retail, a 260 basis point drop in operating margin is usually treated as a sign of terminal illness or a desperate price war.
| Period | Revenue | Operating Income | Operating Margin | Free Cash Flow | SBC Expense |
|---|---|---|---|---|---|
| FY2023 | $157.40B | $24.04B | 15.3% | $11.50B | $366.0M |
| FY2024 | $152.67B | $21.69B | 14.2% | $17.95B | $380.0M |
| FY2025 | $159.51B | $21.53B | 13.5% | $16.32B | $442.0M |
| FY2026 | $164.68B | $20.89B | 12.7% | $12.65B | $522.0M |
However, this margin compression is not a result of Home Depot losing its touch. It is the result of a deliberate, multi-billion dollar pivot toward the complex Pro market. The acquisition of SRS Distribution and the build-out of a massive supply chain for professional contractors comes with upfront costs and lower initial margins than selling a single gallon of paint to a weekend warrior. The company is trading short-term margin purity for long-term ecosystem dominance.
The Free Cash Flow numbers tell a story of immense resilience. Even with higher capital expenditure intensity (4.74% of revenue), the company generated $10.76B in FCF over the last twelve months. When we adjust for Stock-Based Compensation (SBC) of $522M, which is a modest 2.8% of operating cash flow, we see a “Real” FCF yield that remains remarkably stable. This is a business that generates actual cash, unlike the speculative tech ventures that treat SBC as a magical non-expense. Home Depot is paying its bills, funding its dividends, and reinvesting in a moat that is increasingly difficult for competitors to bridge.
Peer Relative Valuation: The Premium of Dominance
When we place Home Depot next to its closest rival, Lowe’s Companies (LOW), the valuation gap becomes the central point of debate. Home Depot trades at 22.0x forward earnings, while Lowe’s trades at a more modest 17.7x. In a vacuum, the value investor would scream that Lowe’s is the better deal. But retail is rarely a vacuum: it is a battle for the wallet of the professional contractor.
| Company (Ticker) | Market Cap | Forward P/E | EV/EBITDA | Rev Growth (YoY) | Operating Margin | FCF Yield |
|---|---|---|---|---|---|---|
| The Home Depot (HD) | $349.6B | 22.0x | 16.7x | 5.70% | 12.02% | 3.08% |
| Lowe’s Companies (LOW) | $128.8B | 17.7x | 13.3x | 8.3% | 11.4% | 3.58% |
| Sherwin-Williams (SHW) | $85.7B | 26.8x | 20.9x | 7.9% | 16.2% | 2.89% |
| Walmart (WMT) | $1.00T | 39.0x | 24.2x | 5.9% | 3.9% | 0.71% |
Home Depot maintains superior operating margins (12.02% vs. 11.4%) despite its heavy investment cycle. More importantly, its ROIC of 20.67% dwarfs the typical cost of capital, suggesting that every dollar management retains is being deployed at rates that create significant shareholder value. Sherwin-Williams (SHW) trades at an even higher premium (26.8x P/E) because the market loves the “specialty” nature of its business. Home Depot is effectively becoming a specialty distributor for the entire home, yet it is priced closer to a general retailer.
The comparison to Walmart (WMT) is instructive for a different reason. Walmart is the ultimate defensive play, trading at a staggering 39.0x forward earnings with a measly 0.71% FCF yield. If the market is willing to pay that much for Walmart’s 3.9% operating margins, the 22.0x multiple for Home Depot’s much more profitable and specialized model looks like a bargain. The “Consensus” is worried about a housing slowdown, but they are ignoring the fact that Home Depot has a much higher floor than a typical discretionary retailer.
Options Market Structure and the Gamma Pin
As we approach the Q3 earnings report on November 17, the options market is signaling a period of calculated calm. The Put/Call Open Interest ratio of 0.91 suggests an almost perfectly balanced inventory among dealers. There is no evidence of the “panic hedging” that usually precedes a major fundamental breakdown.
The Max Pain strike sits at $325.00, which is roughly 7% below current spot prices. While this suggests some magnetic pull to the downside if the earnings call is a disaster, the primary Call Walls at $350 and $370 act as significant structural anchors. Dealers are currently in a “Long Gamma” or “Neutral” position, meaning they are likely to buy any dips toward the $330 level and sell into any exuberant rallies toward $370. This creates a volatility dampening effect that should keep the stock within its 30-day expected move of +/- 12.33%.
The most interesting data point in the plumbing is the concentration of call resistance at $350. The stock is currently fighting to stay above this level. If it can clear this strike and hold it through the earnings catalyst, it triggers a mechanical “short covering” from dealers who must buy back the underlying shares to remain delta-neutral. This could provide the technical fuel needed to push toward the $370 wall.
Ultimately, the investment case for Home Depot rests on the reality that the US housing stock is aging. The average American home is now over 40 years old. Whether the 10-Year Treasury is at 2% or 5%, roofs will leak, HVAC systems will fail, and kitchens will become obsolete. Home Depot has spent the last three years building the infrastructure to be the only partner the person fixing those problems needs. The market is pricing in a cyclical downturn that is being offset by a structural necessity. We are happy to take the other side of that trade.
AllWallSt Investment Verdict: BUY
The Home Depot, Inc. (HD)
Trailing P/E
Marcus Wolfe Screen
Leverage Profile
30D Channel
Dealer Gamma Pinning & Max Pain Alignment (HD)
🎯 Max Pain: $325.00
Spot $350.44
Ceiling $370C Resistance ▲
Pristine cash flow conversion (1.15x) and healthy accrual ratio (-2.06%). Zero accounting anomalies detected (LOW ANOMALY RISK).
Moderate Leverage (2.48x Net Debt/EBITDA); manageable through operating cash generation.
Negative yield spread (-2.01% vs 5.08% Treasury); equity requires robust multiple expansion or growth.
Max Pain: $325.00 (-7.26%) | P/C Ratio: 0.91 | 30D Channel: $307.23 – $393.65. Dealer gamma bounded between $305 Put Wall and $370 Call Wall.
HD represents a core ~0.6% index pillar. Institutional managers face persistent benchmark drag if under-allocated during sector rallies, biasing sell-side consensus toward institutional overweight.
$298.90 – $311.10 (Options Support Pinning)
Sustained weekly close below $305.00 (Put Wall) or gross margin compression below 32.80%.
Sources & References
- Official SEC Form 10-K Annual Report (Filed 2026-03-18)
- Official SEC Form 10-Q Quarterly Report (Filed 2026-08-25)
- Official SEC EDGAR Filings for The Home Depot, Inc. (CIK 0000354950): https://www.sec.gov/edgar/browse/?CIK=0000354950
- The Home Depot Investor Relations: https://www.homedepot.com
- SEC Form 10-K (Annual Report) Filed March 18, 2026.
- SEC Form 10-Q (Quarterly Report) Filed August 25, 2026.
Disclaimer: This report is for informational purposes only and does not constitute financial advice. All investments involve risk, and past performance is not indicative of future results. The AllWallSt Quantitative Desk conviction is based on deterministic data models valid as of the time of publication.