
The fundamental problem with the American housing market is that it has become a game of musical chairs where the music has stopped, but everyone is too afraid to stand up because their current chair costs 3% in interest and the next one costs 7%. According to recent data, existing home sales have collapsed to levels not seen since the Great Recession. This is what we call velocity impairment. For a company like Zillow Group, Inc. (Z), which effectively operates as the high-tech tollbooth for the residential real estate industry, this is a significant complication.
Zillow Group, Inc. (Z) does not actually sell houses anymore. After the spectacular and somewhat hilarious exit from the iBuying business, where they discovered that algorithms are surprisingly bad at predicting the aesthetic value of a kitchen backsplash, the company returned to its roots as a media and lead-generation platform. It sells eyeballs. Specifically, it sells the contact information of people who want to buy houses to real estate agents who want to sell them. But if the total addressable market of transactions is shrinking because homeowners are locked into low-rate mortgages, the lead-generation engine begins to sputter.
The SBC Circular Economy
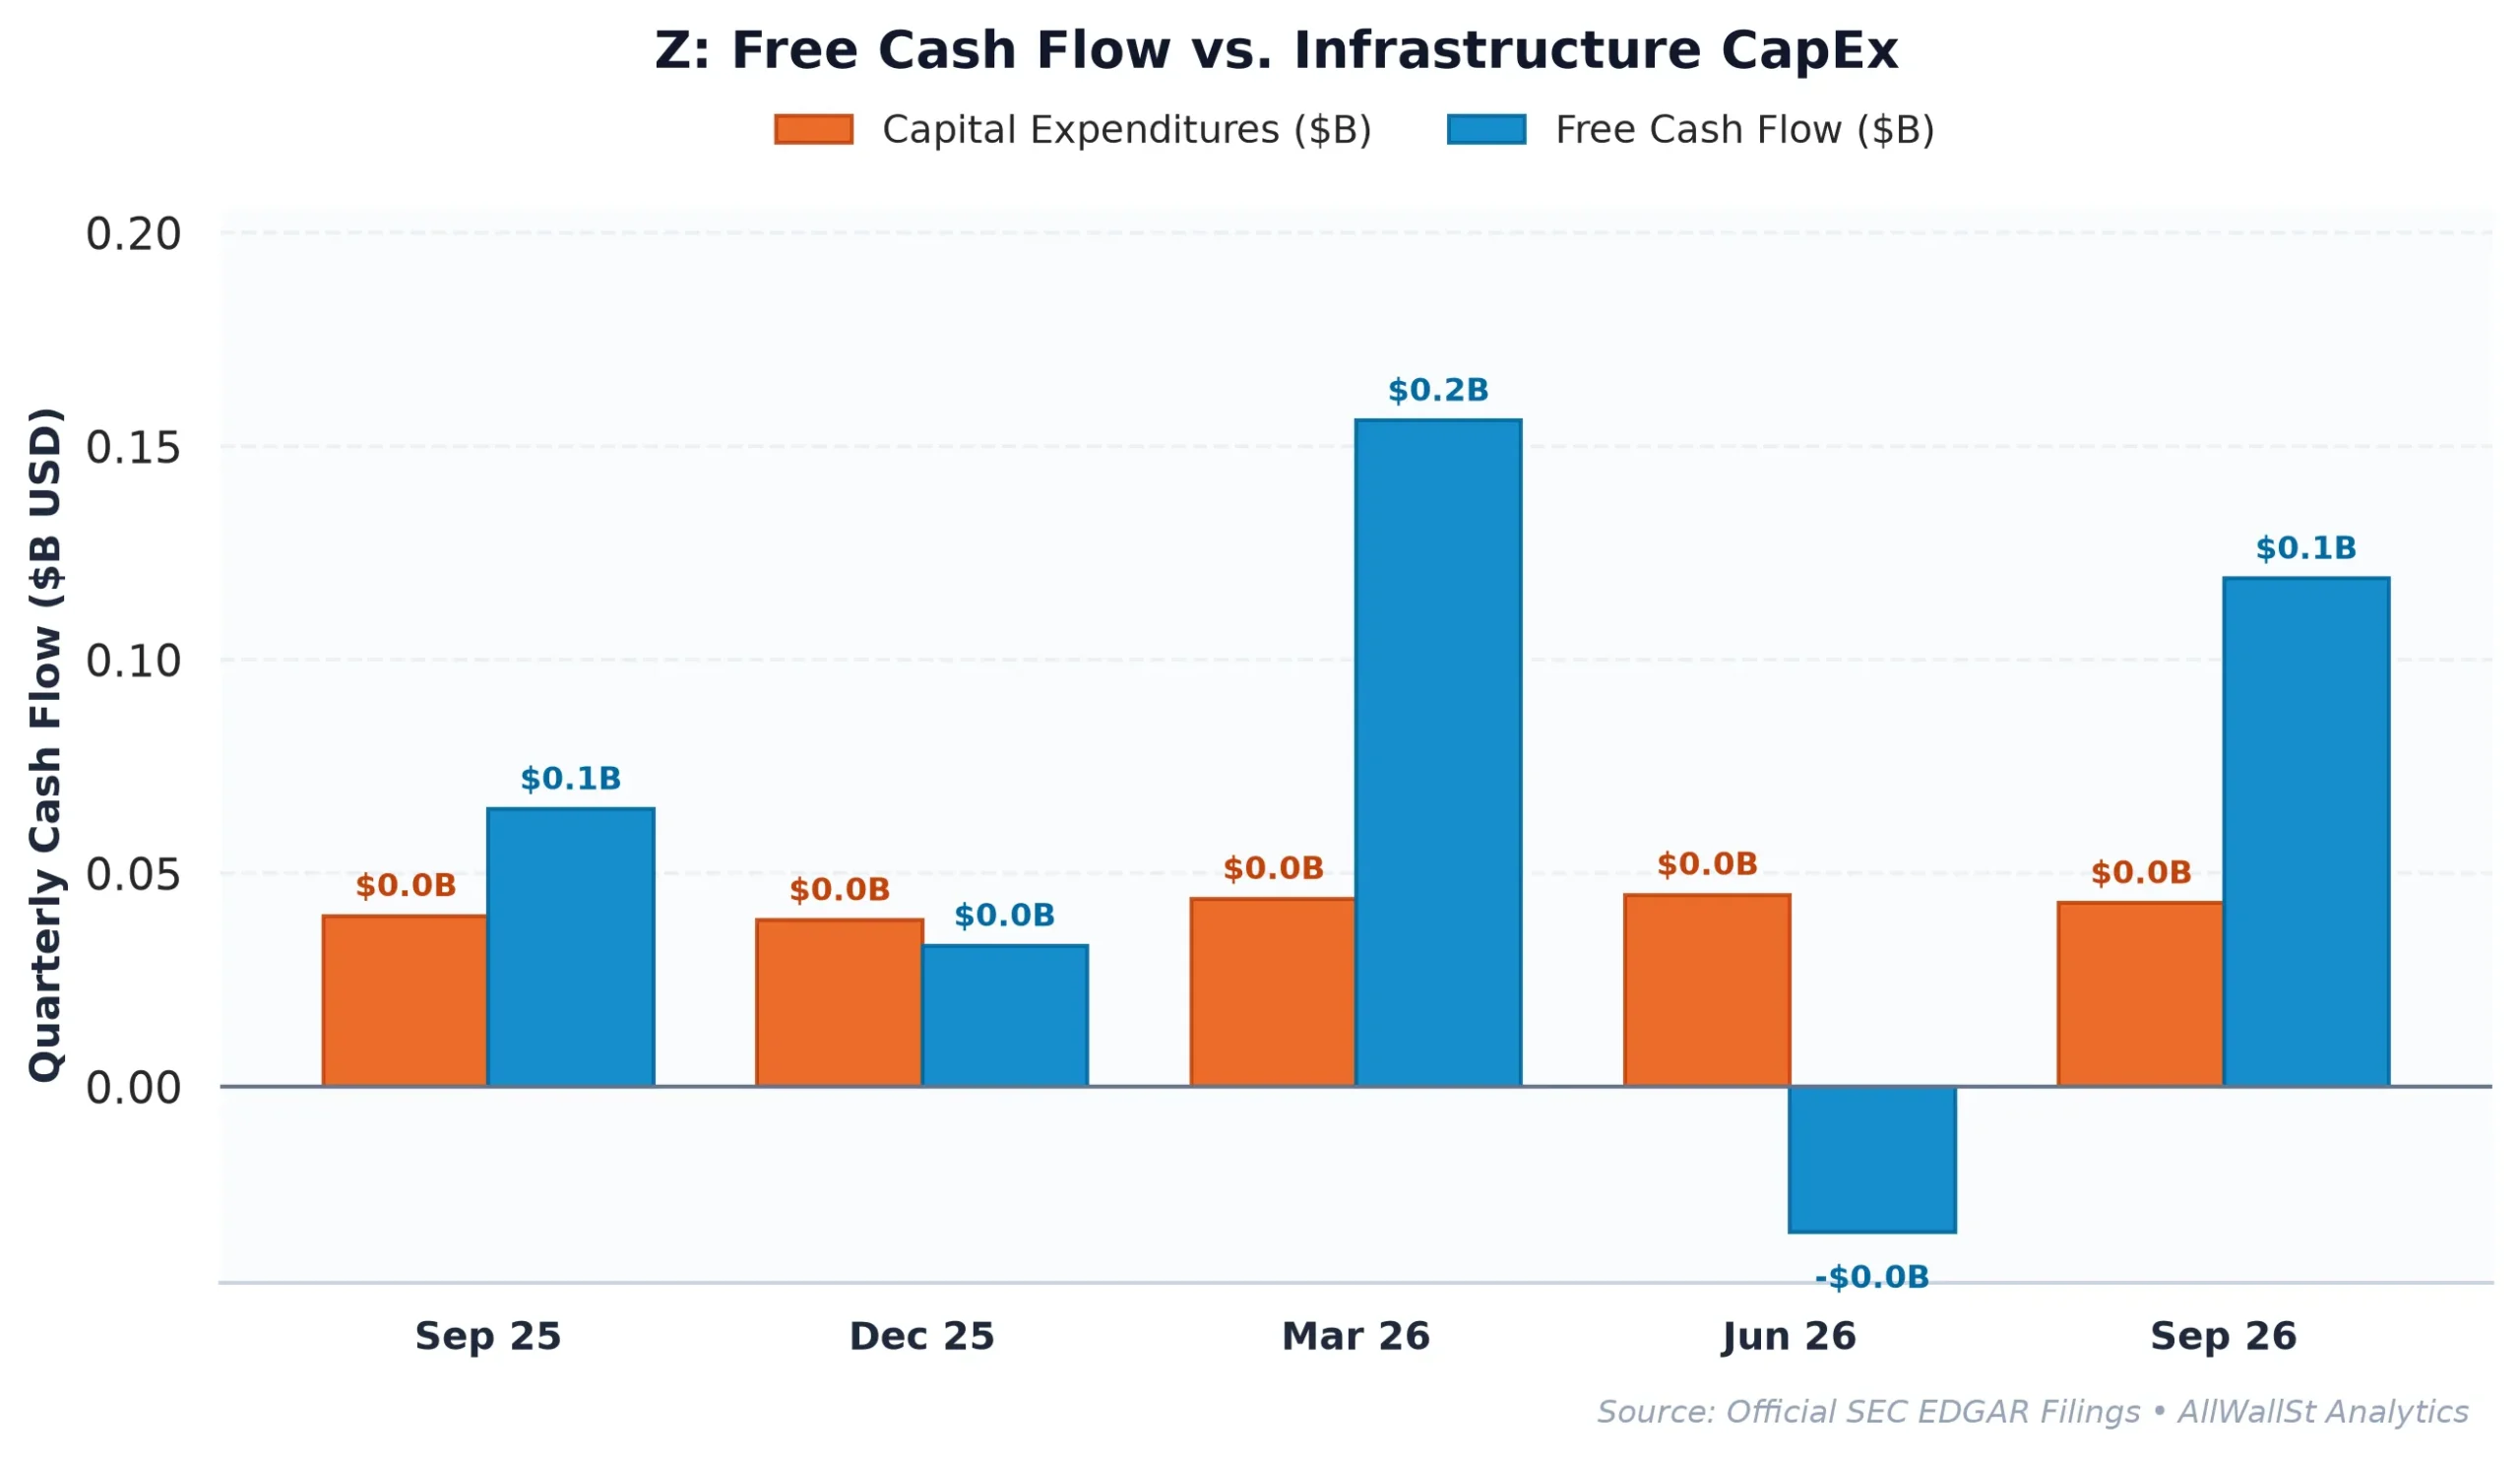
When you look at the balance sheet of Zillow Group, Inc. (Z), you see a company that appears to be a cash-flow machine. It boasts a Free Cash Flow (FCF) yield of 7.57%, which looks attractive when compared to the US 10-Year Treasury yield of 5.10%. However, a closer look at the plumbing reveals a different story. Zillow reported $491.5 million in free cash flow, but it also issued $390 million in stock-based compensation (SBC).
In institutional terms, SBC is 87.6% of the company’s operating cash flow. This means that for every dollar of cash the business generates, nearly ninety cents is essentially a promise to dilute existing shareholders to pay the staff. When you strip away the SBC to find the Real FCF Yield, the figure drops to a much more modest 1.56%. In an environment where risk-free government debt pays 5.10%, accepting a 1.56% real yield for the privilege of owning a real estate platform in a frozen market requires a heroic level of optimism.
Platform Aspirations vs. Utility Margins
The market frequently treats Zillow Group, Inc. (Z) as a high-margin tech platform, yet its operating reality is far more grounded. Its operating margin sits at a lean 4.23%. For comparison, consider the broader technology landscape. Microsoft (MSFT) operates with a 47.1% margin, and Alphabet (GOOGL) maintains 33.3%. Even Oracle (ORCL), often viewed as the stodgy incumbent of the software world, generates a 34.3% margin.
Zillow is growing revenue at 7.10% year-over-year, which is respectable but pales in comparison to the 24.7% growth seen at Alphabet or the 29.6% at Oracle. The strategic dilemma here is that Zillow is trying to build a housing super-app while the underlying transaction volume is in a secular slump. The company is essentially trying to sell more premium seats in a stadium where the game has been delayed indefinitely. While the buyback yield of 10.32% is an aggressive attempt to return capital, it is largely serving as a mop to soak up the dilution from the aforementioned stock-based compensation.
Market Structure and the $25 Floor
The options market is currently pricing in a significant amount of uncertainty. With an implied volatility of nearly 60%, the market expects a move of roughly 17% in either direction over the next 30 days. Interestingly, the Max Pain strike sits at $32.50, which is nearly 13% above the current spot price of $28.80. This suggests that if the stock can claw its way back toward the center of gravity, there is some technical upside.
However, the structural floor is clearly defined by a massive Put Wall at $25. This strike represents the primary area where dealers will likely provide support through hedging. On the upside, the $35 Call Wall acts as a formidable ceiling. Given the balanced dealer gamma and the lack of a clear directional catalyst in a high-rate environment, the stock seems destined to churn within this range. The bulls point to the 24.3% rental demand growth as a sign of life, but rentals are lower-margin than sales, and they do not solve the fundamental velocity problem in the core business.
The Cost of Waiting
Zillow Group, Inc. (Z) is a well-run company in a difficult neighborhood. It has a net cash surplus and a dominant brand, but it is fighting against the gravity of a 5.10% risk-free rate and a housing market that has effectively seized up. The Rule of 40 score of 24.3% confirms that the company is currently below the elite threshold for growth-at-any-price investing.
Until we see a meaningful expansion in operating margins or a definitive thaw in existing home sales volume, the valuation remains a bit of a stretch. The company is earning a 3.08% return on invested capital against a cost of capital that is significantly higher. In the world of finance, if you aren’t earning more than your cost of capital, you aren’t creating value: you are just moving furniture.
AllWallSt Investment Verdict: HOLD
Zillow Group, Inc. (Z)
Trailing P/E
Marcus Wolfe Screen
Leverage Profile
30D Channel
Dealer Gamma Pinning & Max Pain Alignment (Z)
🎯 Max Pain: $32.50
Spot $28.80
Ceiling $35C Resistance ▲
MODERATE WATCHLIST (1 flag): Receivables growth outstripped revenue growth by >15%, pointing to potential revenue recognition or collection friction.
Fortress Balance Sheet (Net Cash Position; zero net refinancing distress).
Favorable equity risk premium (+2.46% FCF yield spread over 5.10% US 10-Yr Treasury benchmark).
Max Pain: $32.50 (+12.85%) | P/C Ratio: 0.97 | 30D Channel: $23.85 – $33.75. Dealer gamma bounded between $25 Put Wall and $35 Call Wall.
Z operates with negligible index gravitational pull. Sell-side ratings reflect pure idiosyncratic fundamental consensus without passive indexing distortion.
Accumulation Deferred (Await Pullback toward $24.50 – $25.50 Support Pinning)
Sustained weekly close below $25.00 (Put Wall) or acceleration in margin compression.
Sources & References
- Official SEC Form 10-K Annual Report (Filed 2026-02-11)
- SEC EDGAR Search: Zillow Group, Inc. (CIK 0001617640)
- Zillow Investor Relations: https://www.zillow.com
- SEC Filing Form 10-Q (November 4, 2026): Quarterly Report
Regulatory Disclaimer: This article is for informational purposes only and does not constitute financial, investment, or legal advice. AllWallSt is a financial journalism organization and is not a registered investment advisor. Investing in public equities involves significant risk. Historical performance is not indicative of future results. Always consult with a qualified financial professional before making investment decisions. Data provided by primary SEC filings and market feeds is believed to be accurate at the time of publication but is not guaranteed. AllWallSt and its contributors may hold positions in securities mentioned.