
The Core Thesis & Market Dislocation
BlackRock, Inc. (BLK) has reached a state of corporate development where it is no longer merely a company, but rather a permanent feature of the global financial architecture. When you manage over $10 trillion in assets, you are not just participating in the market: you are the market. However, the current dislocation in BlackRock shares stems from a fundamental shift in how the firm intends to extract value from that architecture. For decades, the story was about the relentless march of low-cost, passive indexation. That story is mostly over, as the margins in passive have been squeezed to the point of being a public utility. The new story, and the reason for the recent 19.1% year over year revenue growth, is the aggressive colonization of private markets and alternative investments.
The recent governance activity disclosed in SEC Form 8-K filings, specifically the Item 5.02 disclosures regarding director departures and the Item 5.01 changes in control, suggests a board that is actively retooling for this new era. While the headlines focus on Bitcoin ETF inflows from the likes of Barclays and Citi, the institutional reality is that BlackRock is transforming into a high-margin private equity and credit shop that happens to have a massive, low-margin indexing business attached to it. This transition creates a valuation tension: the market currently prices BlackRock at a forward P/E of 18.8x, which is a significant premium to traditional banks but a discount to pure-play alternative giants like Blackstone.
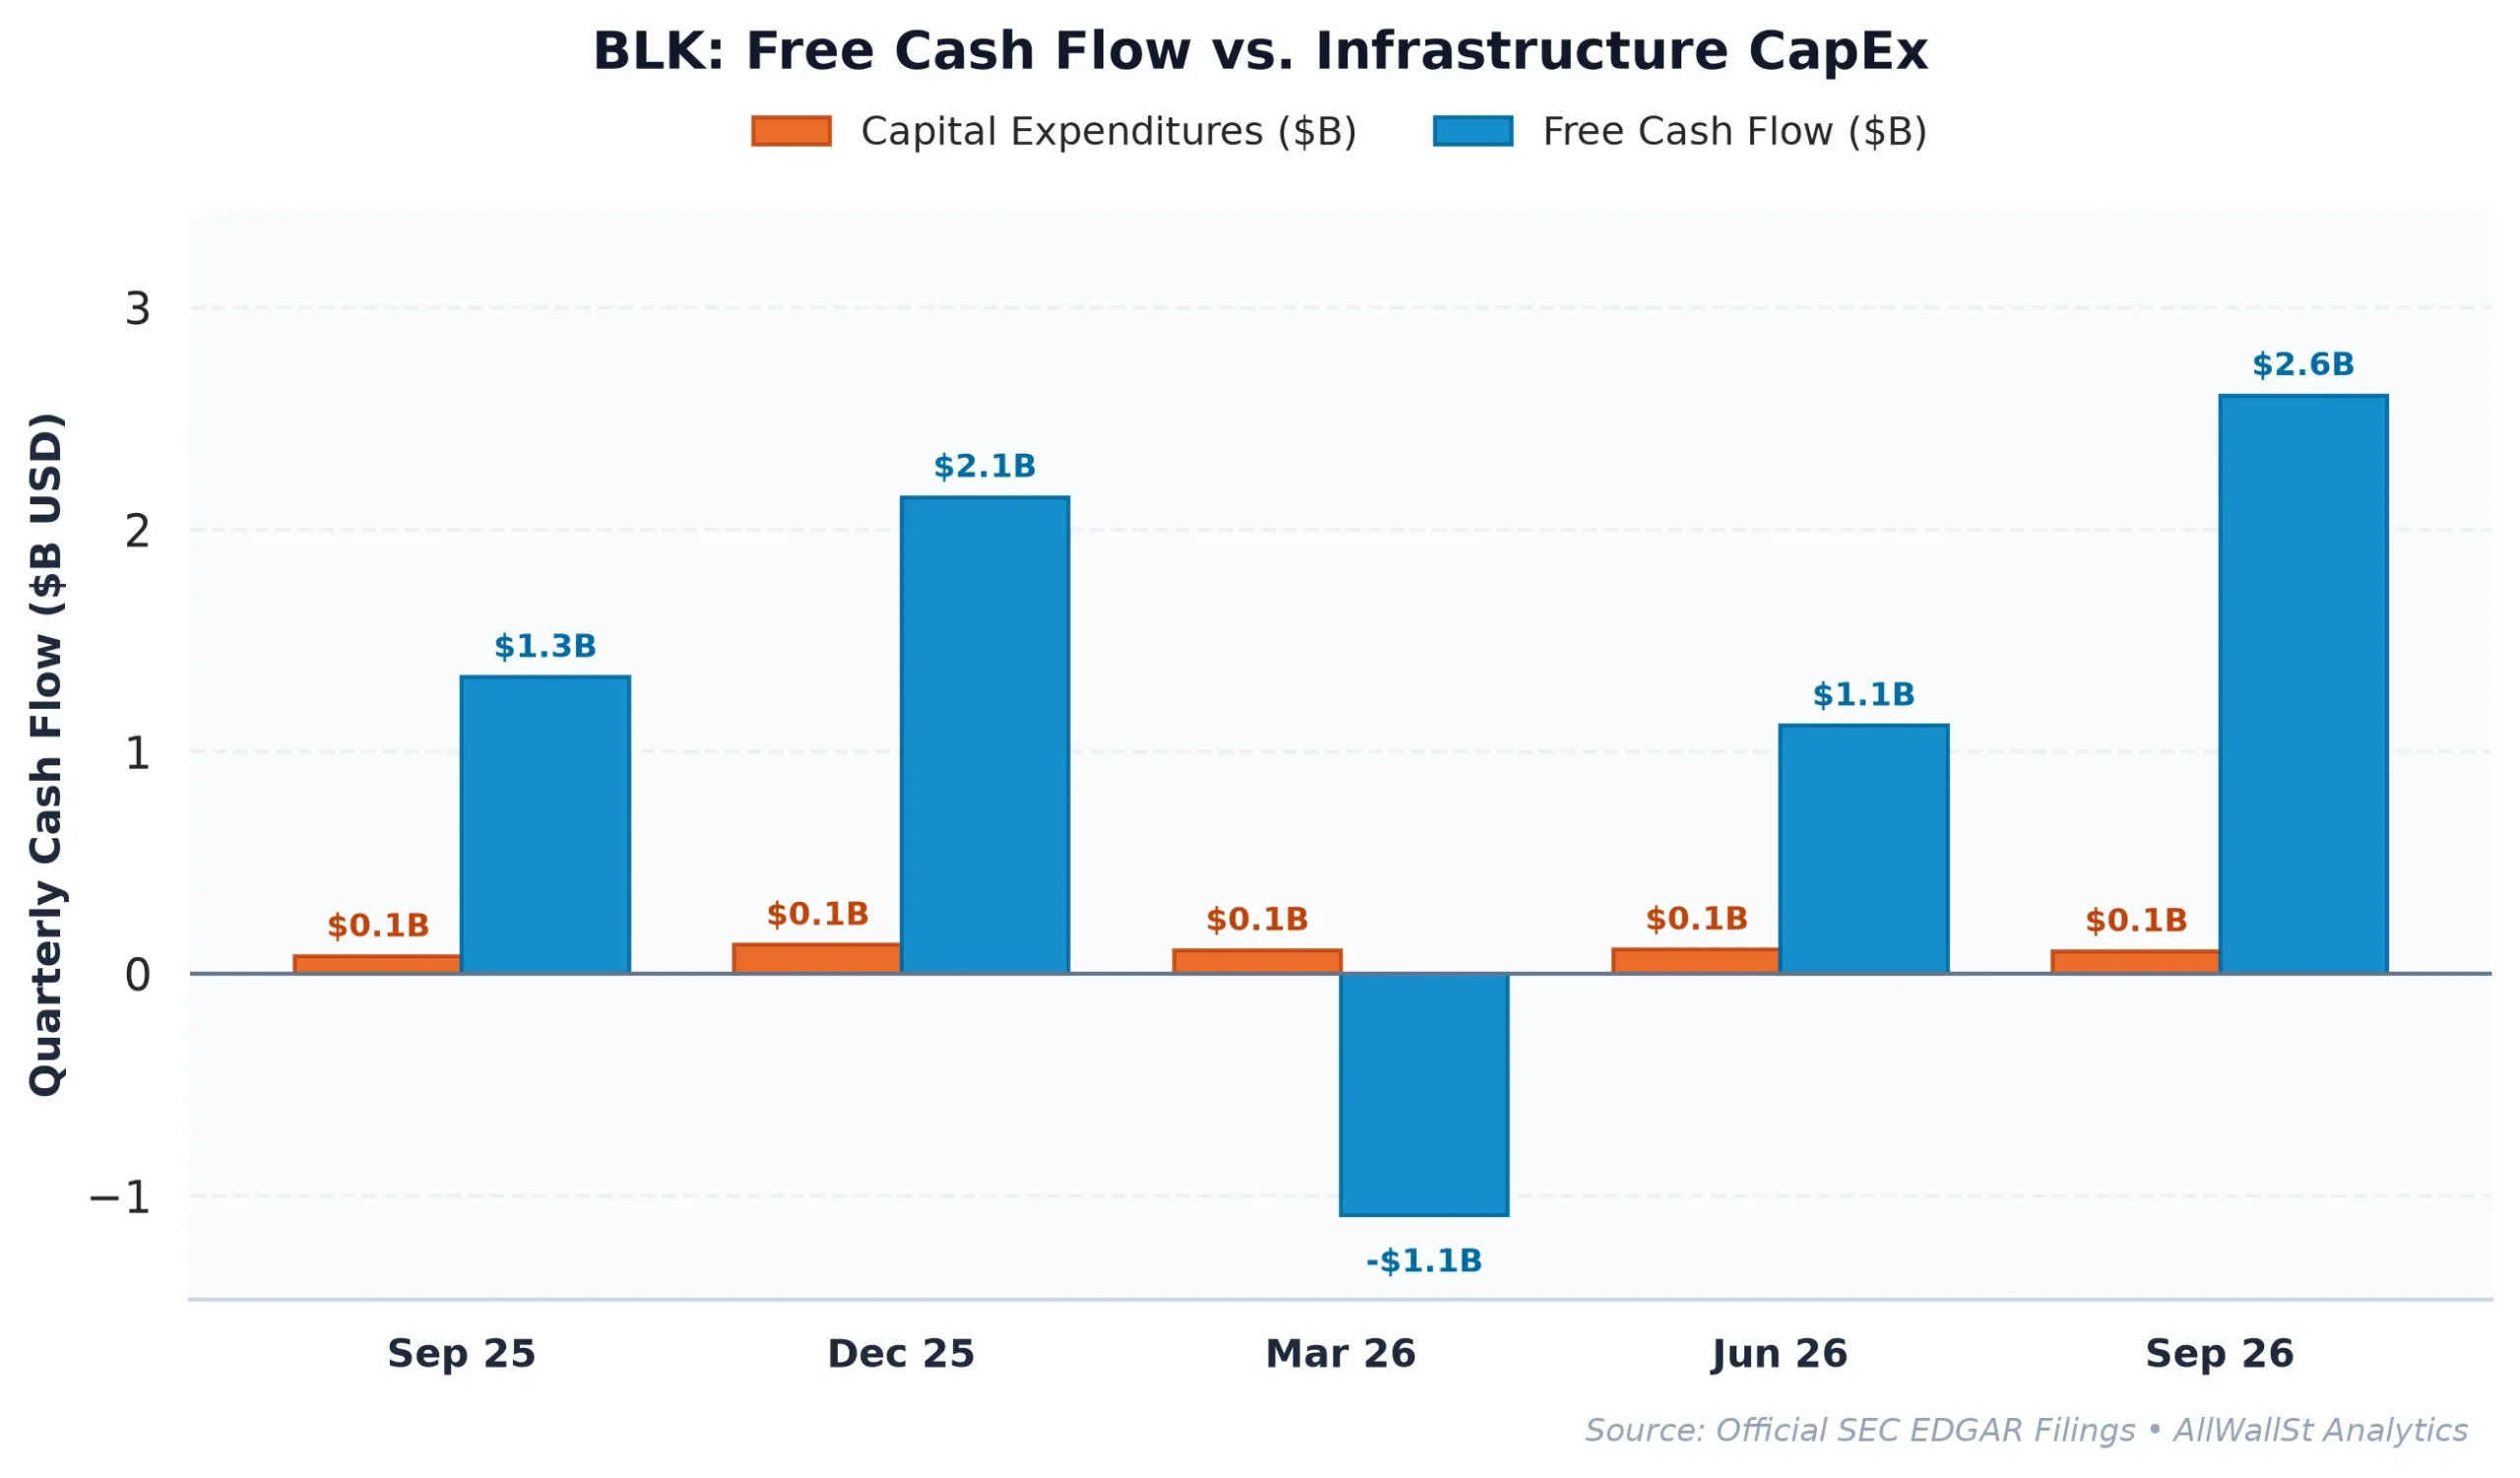
The market is currently wrestling with the fact that BlackRock’s Free Cash Flow (FCF) yield of 4.50% sits below the risk-free rate of the US 10-Year Treasury, which is currently yielding 5.10%. In a vacuum, a negative spread of 60 basis points would suggest an overvalued equity. However, when a firm has a Rule of 40 score of 48.7% and an operating margin of nearly 37%, you are not buying the current yield: you are buying the compounding efficiency of a platform that has successfully weaponized its scale to enter the most lucrative corners of finance.
Multi-Year Financial Trajectory, ROIC & Cash-Flow Mechanics
If you examine the historical trajectory of BlackRock over the last four years, the most striking feature is not just the revenue growth, but the discipline of the operating model. In FY2022, the company generated $17.87 billion in revenue with a 36.2% operating margin. By FY2025, revenue surged to $24.22 billion. While the operating margin dipped slightly to 32.7% during that expansion phase, the absolute dollar amount of cash being generated remains staggering. The company reported $8.45 billion in Free Cash Flow over the trailing twelve months, providing a massive war chest for the “Private Markets” expansion that leadership has signaled is the primary long term growth driver.
There is, however, a catch that institutional investors must monitor: the Stock-Based Compensation (SBC). In FY2025, SBC expense hit $1.31 billion, representing roughly 25% of operating cash flow. This is a significant jump from the $708 million recorded in 2022. When you strip out this SBC to calculate the “Real” FCF Yield, the figure drops to 3.80%. BlackRock is essentially using its equity as a high-priced currency to retain the talent necessary to build out its private credit and infrastructure desks. For a firm with a net cash surplus of $1.19 billion and a total cash position exceeding $16 billion, this dilution is manageable, but it highlights the rising cost of competing with the elite hedge funds and private equity firms for human capital.
The Return on Invested Capital (ROIC) stands at 14.56%, which comfortably clears the weighted average cost of capital (WACC) hurdle of approximately 8.5%. This spread indicates that BlackRock is still creating significant economic value with every dollar it reinvests into the business. Unlike regional banks that are struggling with deposit betas and interest rate mismatches, BlackRock’s balance sheet is remarkably clean, with a Net Debt to EBITDA ratio of -0.10x. It is a capital-light, high-intellect machine that is currently being mispriced as a simple asset manager rather than a diversified financial technology and private markets powerhouse.
Peer Relative Valuation & Competitive Moat
To understand why BlackRock deserves its current valuation, one must look at the landscape of its peers. The asset management industry is bifurcating into those who have scale and those who are destined to be acquired. BlackRock is the ultimate consolidator.
| Company (Ticker) | Market Cap | Forward P/E | EV/EBITDA | Rev Growth (YoY) | Operating Margin | FCF Yield |
|---|---|---|---|---|---|---|
| BlackRock (BLK) | $187.9B | 18.8x | 16.4x | 19.10% | 36.73% | 4.50% |
| Blackstone (BX) | $146.3B | 16.1x | N/A | -0.5% | 49.3% | N/A |
| KKR & Co. (KKR) | $89.2B | 13.5x | N/A | -28.3% | 25.0% | N/A |
| Charles Schwab (SCHW) | $158.3B | 11.8x | N/A | 16.9% | 51.1% | N/A |
When compared to Blackstone (BX) and KKR, BlackRock’s revenue growth of 19.1% is the clear outlier. While Blackstone boasts higher operating margins at 49.3%, its revenue growth has stagnated as the fundraising environment for traditional private equity became more challenging in a 5.10% rate world. BlackRock’s advantage is its diversified top line: it captures the “Morning Rush” of retail ETF flows while simultaneously scaling the institutional private credit business. This dual-engine growth is why BLK trades at a premium forward P/E of 18.8x compared to KKR’s 13.5x.
The competitive moat here is the Aladdin platform. Aladdin is the central nervous system for institutional risk management, used by many of the very competitors listed in the table above. This creates a “stickiness” that traditional asset managers lack. If a client moves their assets from a BlackRock fund to a competitor, there is a high probability they are still using BlackRock’s software to manage the risk of those assets. This software-like recurring revenue stream provides a floor for the valuation that peers like Charles Schwab, which is more sensitive to interest rate spreads and retail trading activity, simply do not possess.
Options Gamma Pinning, Risk Bounds & Verdict
Turning to the market structure, the options desk sees a fascinating setup. The Put/Call Open Interest ratio is currently 0.58, indicating a heavy speculative long skew. Institutional players and retail traders alike are piling into calls, creating a bullish call inflow that has pushed the price toward the $1216 level. However, this positioning creates a specific type of risk: dealer long liquidation. Because dealers are likely long the underlying stock to hedge these sold calls, any pause in upside momentum could force a mechanical sell-off as those hedges are unwound.
The primary Call Wall sits at $1300, with over 2,300 contracts. This level represents a formidable ceiling for the current monthly expiration cycle. On the downside, the Put Wall at $1160 serves as the first line of structural support, followed by a much larger wall at $1000. The Max Pain strike is currently $1135, which is about 6.7% below the current spot price. This suggests that if the market experiences a broader volatility shock, there is a magnetic pull toward that $1135 level where the most options contracts would expire worthless.
With an implied volatility of 12.5%, the market is pricing in a 30-day expected move of roughly $43.55 in either direction. This is a relatively complacent volatility regime for a company undergoing such a massive strategic pivot. For the long term investor, this complacency is an opportunity. You are getting an elite compounder with a Rule of 40 score of 48.7% at a price that does not fully reflect its burgeoning dominance in private markets. While the -0.60% spread against the 10-Year Treasury yield might scare off the bond-proxy crowd, the fundamental trajectory suggests that BlackRock is one of the few financial institutions capable of out-earning the cost of capital in a sustained high-rate environment.
Investment Committee Steelman Dissent
The bear case rests on the observation that BlackRock is becoming a victim of its own success, facing increasing regulatory scrutiny as a systemically important financial institution (SIFI) while its massive Stock-Based Compensation dilutes the very shareholders it claims to serve. Furthermore, if the pivot to private markets fails to offset the continued fee compression in the core iShares business, the forward multiple could de-rate toward the lower levels seen by traditional bank peers.
AllWallSt Investment Verdict: BUY
BlackRock, Inc. (BLK)
Trailing P/E
Marcus Wolfe Screen
Leverage Profile
30D Channel
Dealer Gamma Pinning & Max Pain Alignment (BLK)
🎯 Max Pain: $1135.00
Spot $1216.61
Ceiling $1300C Resistance ▲
Banking liquidity & regulatory capital compliant (Basel III / CET1 governed); deposit & trading settlement flows normalized.
Tier 1 Regulatory Capital & Liquidity Coverage Ratio (LCR) compliant; balance sheet governed by Basel III capital buffers.
Evaluated against 5.10% US 10-Yr Benchmark; bank net interest margins sensitive to yield curve slope (2s10s spread) and deposit beta.
Max Pain: $1135.00 (-6.71%) | P/C Ratio: 0.58 | 30D Channel: $1173.06 – $1260.16. Dealer gamma bounded between $1160 Put Wall and $1300 Call Wall.
BLK carries standard index weighting (< 0.6% SPY footprint); sell-side consensus reflects standard earnings momentum rather than index-tracking mandates.
$1136.80 – $1183.20 (Options Support Pinning)
Sustained weekly close below $1160.00 (Put Wall) or gross margin compression below 48.28%.
Bearish IC Dissent: At 27.7x trailing earnings and 4.50% FCF yield against a 5.10% 10-year risk-free hurdle, BlackRock, Inc. (BLK) leaves thin margin for top-line deceleration or margin compression. If institutional flows break below the $1160 put wall, dealer de-hedging can accelerate multiple contraction before fundamental buyers step in.
Investigative Reporting & Public Record Sourcing: Dispatches published under Word on Wall St constitute financial news reporting, investigative journalism, and market commentary on matters of public and economic interest. Information is synthesized from publicly available regulatory filings (including SEC Form 8-K, Form 10-K, and Form 10-Q disclosures), official corporate press communications, verified news reports, and discussions with institutional market participants.
Presumption of Innocence & Unadjudicated Allegations: Any references to executive conduct, personal relationships, workplace misconduct, whistleblower claims, espionage inquiries, internal governance reviews, or government investigations represent reported allegations and active inquiries as of the publication date. They do not constitute formal judicial determinations, legal verdicts, or findings of guilt, civil liability, or statutory wrongdoing unless expressly identified as adjudicated final court judgments.
Protected Editorial Commentary & Non-Investment Counsel: All quantitative scenario analyses, key-person risk haircuts, forward valuation estimates, dealer gamma pinning levels, and investment conviction ratings reflect protected analytical opinion, editorial commentary, and financial modeling under the First Amendment. Nothing herein constitutes legal counsel, personal tax advice, or individualized investment advice. AllWallSt and its contributors assume no liability for trading, investment, or commercial decisions taken on the basis of this report.
Sources & References
- Official SEC Form 10-Q Quarterly Report (Filed 2024-08-06)
- BlackRock, Inc. SEC EDGAR Filings: https://www.sec.gov/edgar/browse/?CIK=0001364742
- BlackRock Investor Relations: https://www.blackrock.com
- SEC Form 10-K (FY2023): https://www.sec.gov/Archives/edgar/data/1364742/000095017024019271/blk-20231231.htm
- SEC Form 8-K (October 1, 2024): https://www.sec.gov/Archives/edgar/data/1364742/000119312524229654/d856279d8k.htm
Regulatory Disclaimer: This article is provided for informational purposes only and does not constitute investment, legal, or tax advice. AllWallSt is a financial journalism outlet, not a registered investment advisor. Investing in public equities involves significant risk, including the potential loss of principal. Quantitative data, options market structure, and fundamental metrics are derived from primary SEC filings and exchange feeds but are subject to market volatility and reporting delays. Always consult with a qualified financial professional before making capital allocation decisions. AllWallSt and its contributors may hold positions in the securities discussed.