
The ritual of the retail earnings preview is one of the more reliable forms of performance art in the financial press. This week, the spotlight falls on Target Corporation (TGT), and the script is familiar. Analysts are described as conflicted, which is Wall Street code for they have no idea what will happen but feel obligated to publish a note anyway. There is talk of discretionary spending elasticity, the inevitable mention of inventory shrink, and a flurry of excitement over the appointment of a new board member, Sally Grimes. It is all very professional and very busy.
However, if you step back from the spreadsheets and the 48 hour news cycle, there is a much simpler, much more annoying reality sitting on the table. That reality is currently yielding 5.13 percent. That is the yield on the 10 Year US Treasury, the risk free benchmark that dictates the gravity of every other asset on the planet. Target, meanwhile, offers a free cash flow yield of 4.70 percent. This means that, in a strictly mathematical sense, you are paying Target a premium for the privilege of taking on retail execution risk, discretionary consumer exposure, and the vagaries of Minnesota winters, all while earning less than you would by lending money to Uncle Sam.
The Discretionary Dilemma and the Boardroom Shuffle
The consensus narrative heading into the November 18 earnings call is that Target is a recovery story. The stock has seen a modest rise recently, and the bull case rests on the idea that the worst of the post-pandemic inventory glut is over. The company recently added Sally Grimes, a consumer brands veteran, to its board of directors. In the world of corporate governance, adding a brand expert to the board is often a signal that the company knows its brand needs a bit of a polish. It is the corporate equivalent of buying a new tie before a job interview: it looks good, but it does not necessarily change your resume.
The actual resume, as found in the primary SEC filings, tells a more complicated story. Target is currently operating in a world where its core customer is feeling the pinch of a K-shaped economy. While the affluent are still buying high margin home decor, the median household is trading down to private labels. This is visible in the revenue trajectory.
When you look at the chart, you see a business that is essentially running in place. The enterprise value of $86.9 billion is supported by a gross margin of 28.38 percent, which is healthy for a discount retailer, but the operating margin of 5.03 percent leaves very little room for error. If shipping costs spike or if the holiday promotional environment gets too aggressive, that margin can compress faster than a clearance rack in January.
The Four Year Fundamental Stall
To understand why we are skeptical of the recovery narrative, one must look at the multi-year trajectory. Wall Street loves to focus on the next quarter, but the long term data suggests that Target is struggling to find its next gear.
| Period | Revenue | Operating Income | Operating Margin | Free Cash Flow | SBC Expense |
|---|---|---|---|---|---|
| FY2023 | $109.12B | $3.85B | 3.5% | $-1.51B | $220.0M |
| FY2024 | $107.41B | $5.71B | 5.3% | $3.81B | $251.0M |
| FY2025 | $106.57B | $5.57B | 5.2% | $4.48B | $304.0M |
| FY2026 | $104.78B | $5.12B | 4.9% | $2.83B | $281.0M |
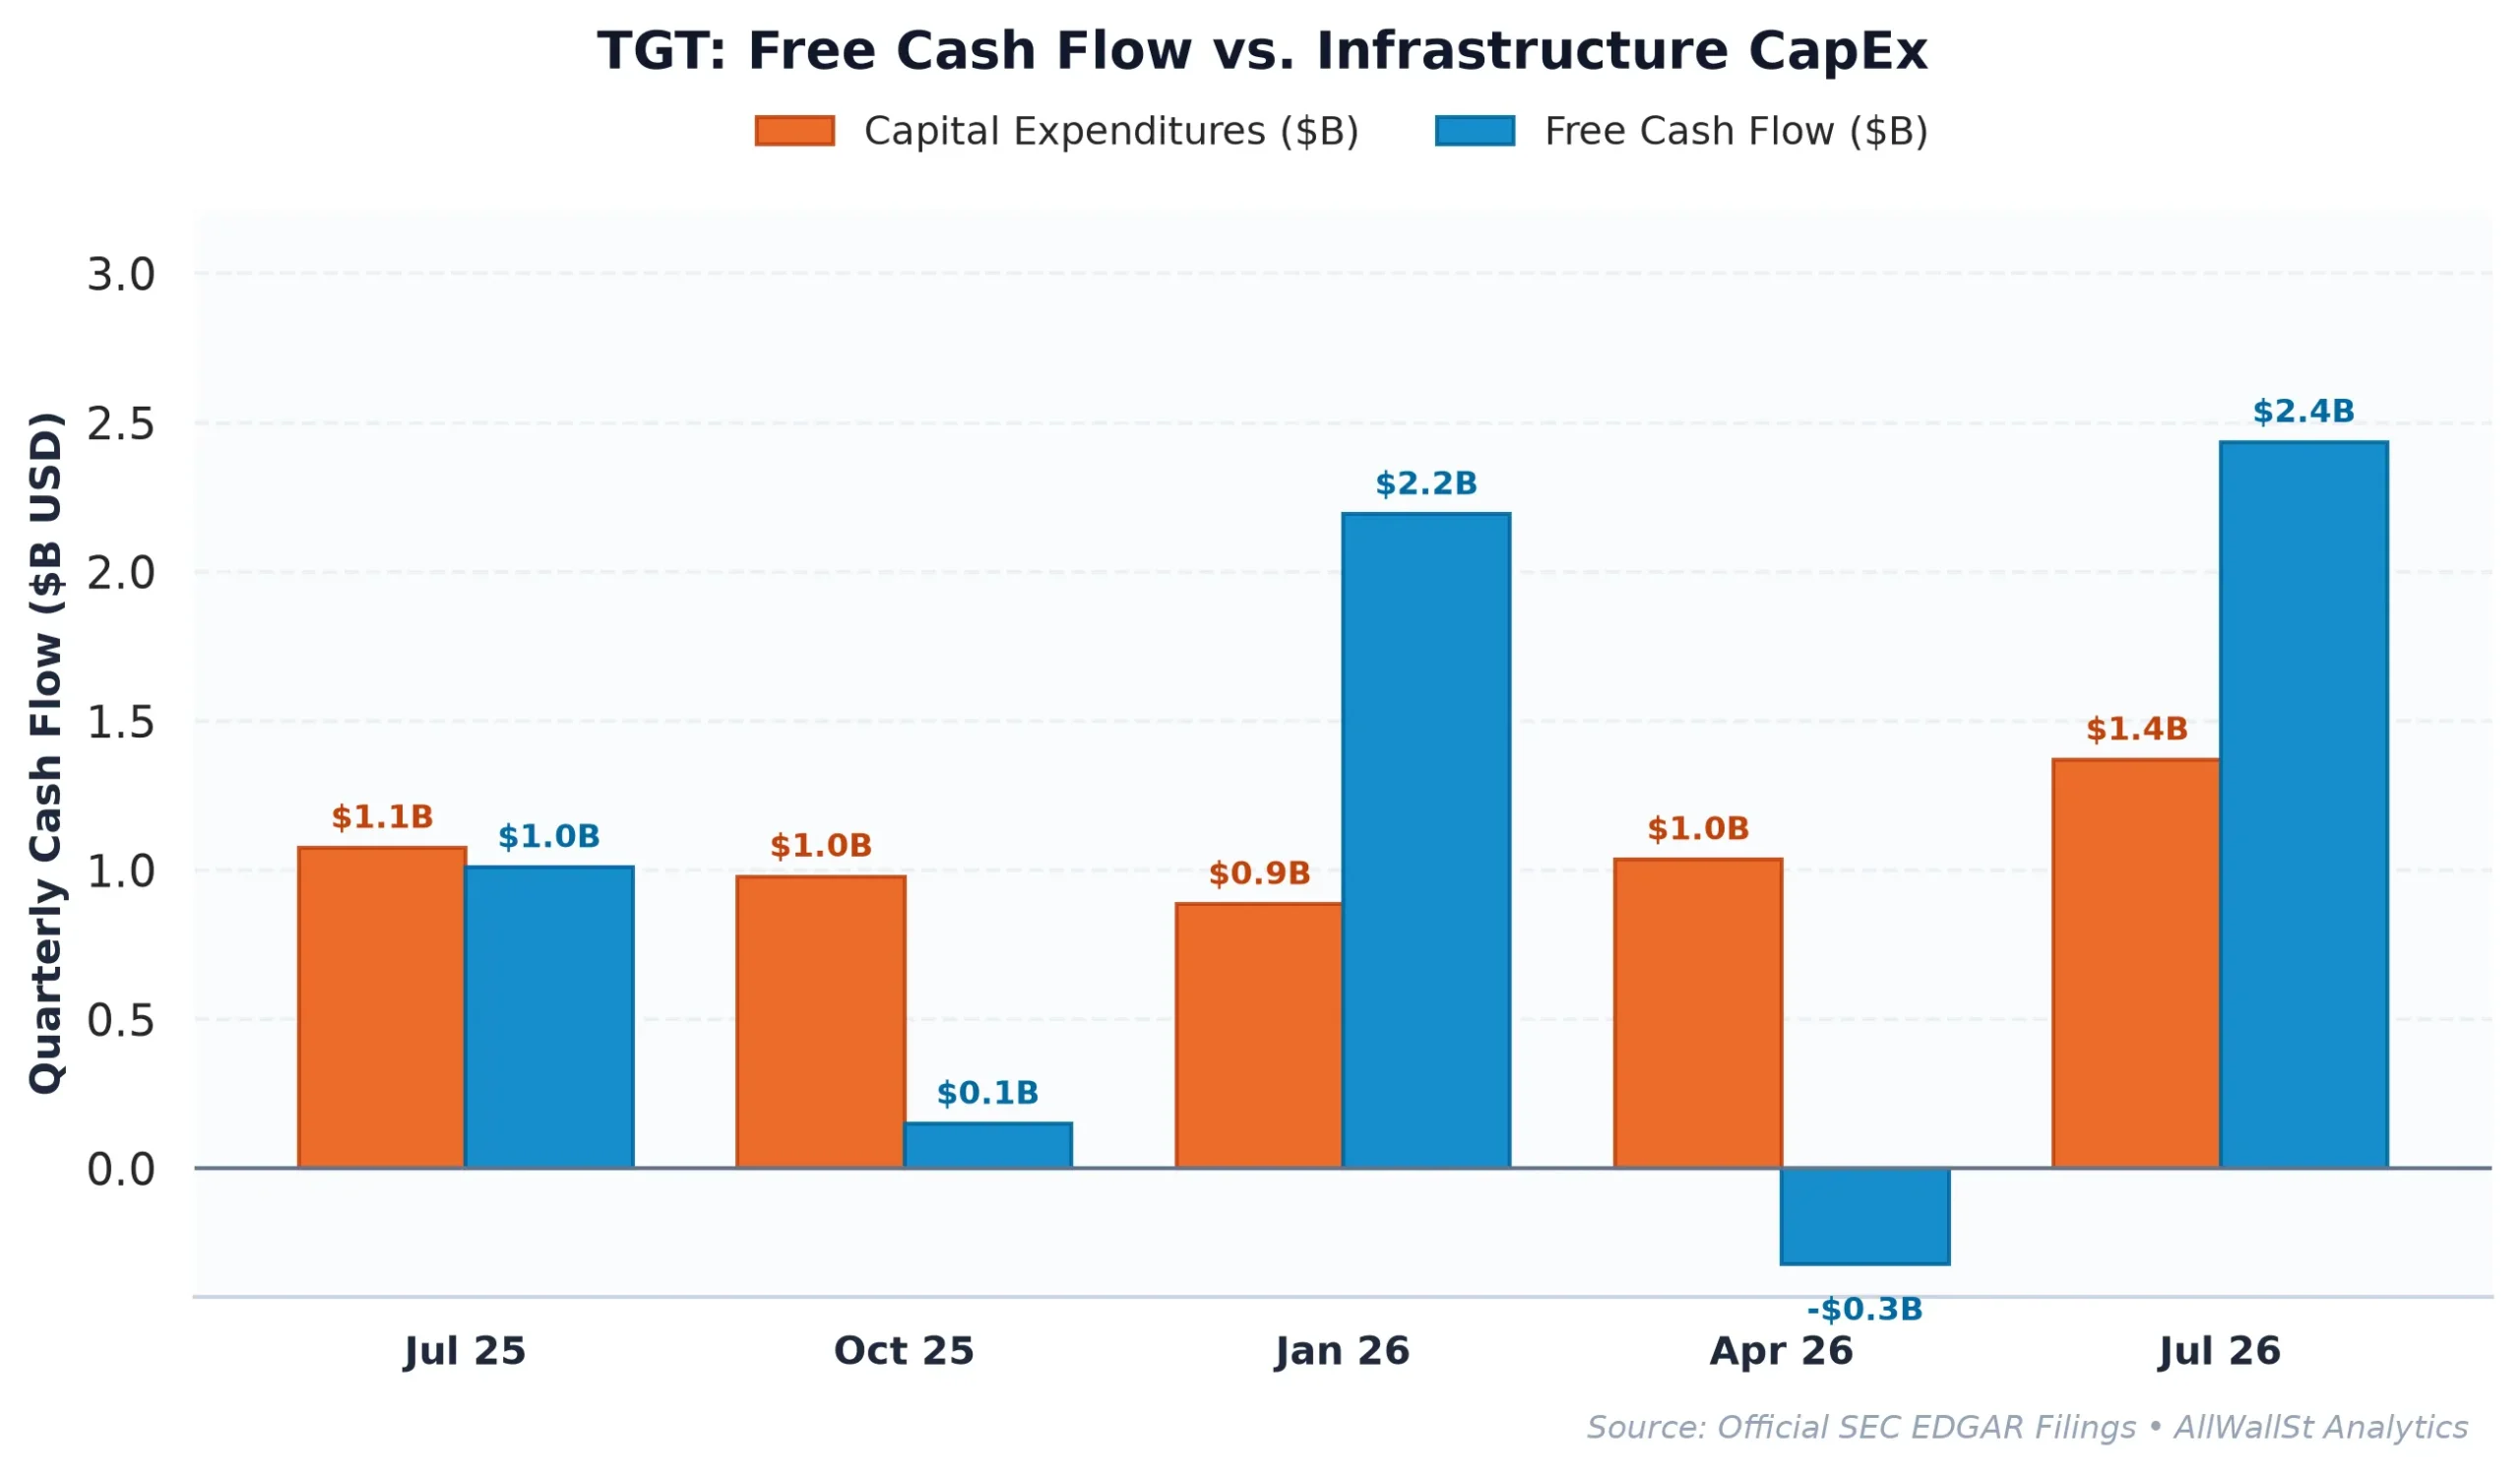
Between FY2023 and FY2026, revenue actually declined from $109 billion to $104.8 billion. In an inflationary environment, falling nominal revenue is a blinking red light. It means you are not just losing volume; you are losing the ability to pass on costs. While the company did a commendable job repairing margins after the 2023 disaster, the free cash flow has been volatile. The $2.83 billion in FCF for FY2026 is a significant step down from the prior year.
Furthermore, the Rule of 40 score (a metric we usually reserve for software but which is enlightening here) sits at a meager 8.5 percent. This is calculated as 5.3 percent revenue growth plus a 3.2 percent free cash flow margin. For a company to be considered a high quality compounder, we generally look for a score above 25 percent. At 8.5 percent, Target is a mature, slow growth utility that happens to sell throw pillows.
Peer Comparison: The Price of Being Second Best
The market currently values Target at 16.8 times forward earnings. On the surface, this looks like a bargain compared to its peers. However, in the world of retail, you usually get what you pay for.
| Company (Ticker) | Market Cap | Forward P/E | EV/EBITDA | Rev Growth (YoY) | Operating Margin | FCF Yield |
|---|---|---|---|---|---|---|
| Target (TGT) | $73.1B | 16.8x | 10.1x | 5.30% | 5.03% | 4.70% |
| Walmart (WMT) | $1.02T | 39.7x | 24.3x | 5.9% | 3.9% | 0.70% |
| Costco Wholesale (COST) | $489.7B | 44.1x | 33.3x | 11.1% | 3.8% | 1.38% |
| TJX Companies (TJX) | $147.9B | 23.4x | 17.7x | 5.4% | 12.2% | 2.97% |
Walmart and Costco are trading at valuations that suggest they are either immune to the laws of physics or that they are actually technology companies in disguise. Walmart’s 39.7x P/E is a reflection of its dominant grocery business and its burgeoning advertising arm. Costco’s 44.1x P/E is essentially a membership fee for investors who want to own the most efficient distribution engine in history.
Target sits in the middle. It does not have Walmart’s scale or Costco’s loyalty. It is more discretionary than both, which makes it more sensitive to the economic cycle. The 16.8x multiple is a “show me” valuation. The market is saying it will not pay a premium until Target proves it can grow revenue in a world where the 10 Year Treasury is the fiercest competitor for an investor’s dollar.
Options Plumbing and the Gamma Overhang
While the fundamental analysts debate the merits of the new board member, the options market has been busy building a very specific, and somewhat dangerous, structure. The Put/Call Open Interest ratio is currently 0.64. This indicates a heavy speculative long skew. Everyone and their cousin seems to be buying calls in anticipation of an earnings beat.
The problem with a lopsided call overhang is what happens if the news is merely “fine.” In the options market, dealers who sell those calls must hedge by buying the underlying stock. If the stock fails to rally past the primary Call Wall at $165, those calls begin to lose value due to time decay (charm) and volatility crush (vanna). As the calls lose value, dealers sell the stock they bought as a hedge, creating a mechanical downward pressure.
The Max Pain strike is currently sitting at $157.50, which is about 2 percent below the current price. In the absence of a massive, undeniable earnings blowout, the gravitational pull of dealer hedging often drags the stock toward that Max Pain level as expiration approaches. With the expected 30 day move sitting at a massive 17.11 percent, the market is pricing in a lot of drama, but the structural plumbing suggests that the upside is capped by that $165 wall.
The investment committee must also consider the cost of carry. With the 10 Year Treasury at 5.13 percent, the equity risk premium for Target is effectively negative. You are not being paid to take the risk. You are paying for the privilege.
Investment Committee Steelman Dissent
The strongest bull case for Target rests on a potential massive short squeeze if the company reports a surprise stabilization in discretionary margins and a significant reduction in inventory shrink, which could force a rapid re rating toward the multiples of its staple peers like Walmart. If the consumer proves more resilient than the macro data suggests, Target’s 16.8x multiple could be viewed in retrospect as a generational entry point for a dominant omnichannel retailer.
AllWallSt Investment Verdict: HOLD
Target Corporation (TGT)
Trailing P/E
Marcus Wolfe Screen
Leverage Profile
30D Channel
Dealer Gamma Pinning & Max Pain Alignment (TGT)
🎯 Max Pain: $157.50
Spot $160.80
Ceiling $165C Resistance ▲
MODERATE WATCHLIST (1 flag): Receivables growth outstripped revenue growth by >15%, pointing to potential revenue recognition or collection friction.
Prudent Leverage (1.60x Net Debt/EBITDA); well within investment-grade covenant headroom.
Negative yield spread (-0.43% vs 5.13% Treasury); equity requires robust multiple expansion or growth.
Max Pain: $157.50 (-2.05%) | P/C Ratio: 0.64 | 30D Channel: $133.29 – $188.31. Dealer gamma bounded between $160 Put Wall and $165 Call Wall.
TGT carries standard index weighting (< 0.6% SPY footprint); sell-side consensus reflects standard earnings momentum rather than index-tracking mandates.
Accumulation Deferred (Await Pullback toward $156.80 – $163.20 Support Pinning)
Sustained weekly close below $160.00 (Put Wall) or acceleration in margin compression.
IC Counter-Thesis: While our neutral stance balances 16.7x trailing earnings and 4.70% FCF yield against a 5.13% 10-year yield hurdle (1.60x Net Debt/EBITDA), a decisive breakout above $165 on accelerating earnings revisions could leave sidelined capital underexposed. Conversely, a breach of $160 would confirm that valuation support is illusory alongside 1 flagged accrual anomalies.
Sources & References
- Target Corporation SEC EDGAR Filings
- Target Investor Relations
- SEC Form 10-K: Target Corp (Filed March 11, 2026)
- SEC Form 10-Q: Target Corp (Filed August 28, 2026)
Disclaimer: This report is for informational purposes only and does not constitute financial, legal, or investment advice. AllWallSt and its analysts are not registered investment advisors. All equity investments carry significant risk, including the potential loss of principal. Please consult with a licensed financial professional before making any investment decisions.