
The thing about serving as the enterprise world’s default productivity backbone is that every infrastructure hiccup turns into a boardroom referendum on concentration risk. Following the recent Microsoft Corporation (MSFT) Office 365 service disruption, which initial reporting attributed to a hardware failure, corporate technology buyers are once again confronting the fragility of single-vendor cloud dependence.
Even when an outage stems from an isolated hardware failure rather than a software flaw, the capital allocation lesson remains the same: the event highlights a growing “redundancy tax” that may gradually pressure Microsoft’s margins. For years, the bull case for Microsoft has rested on the “one throat to choke” philosophy. Chief Information Officers love the simplicity of buying their cloud, their productivity suite, and their security from one vendor. It is efficient, it is integrated, and it is increasingly looking like a single point of failure.
The Bundling Backlash and the Redundancy Tax
Microsoft has spent the better part of a decade aggressively bundling its productivity and security stack into E5 enterprise licenses. This strategy has been a masterclass in cross-selling, helping the company maintain an operating margin of 47.10%. However, when a single infrastructure or hardware failure can interrupt mission-critical communications across global enterprises, the efficiency of a monoculture becomes a liability.
We expect enterprise customers to begin diversifying their infrastructure. This is not necessarily because they hate Windows, but because their insurance providers and regulators will likely demand it. If you are a global bank, you can no longer afford to have your entire front office dependent on a single software ecosystem. This pivot toward multi-vendor strategies represents a structural headwind for Microsoft’s “stickiness” and could force a decoupling of services that the market currently prices at a premium.
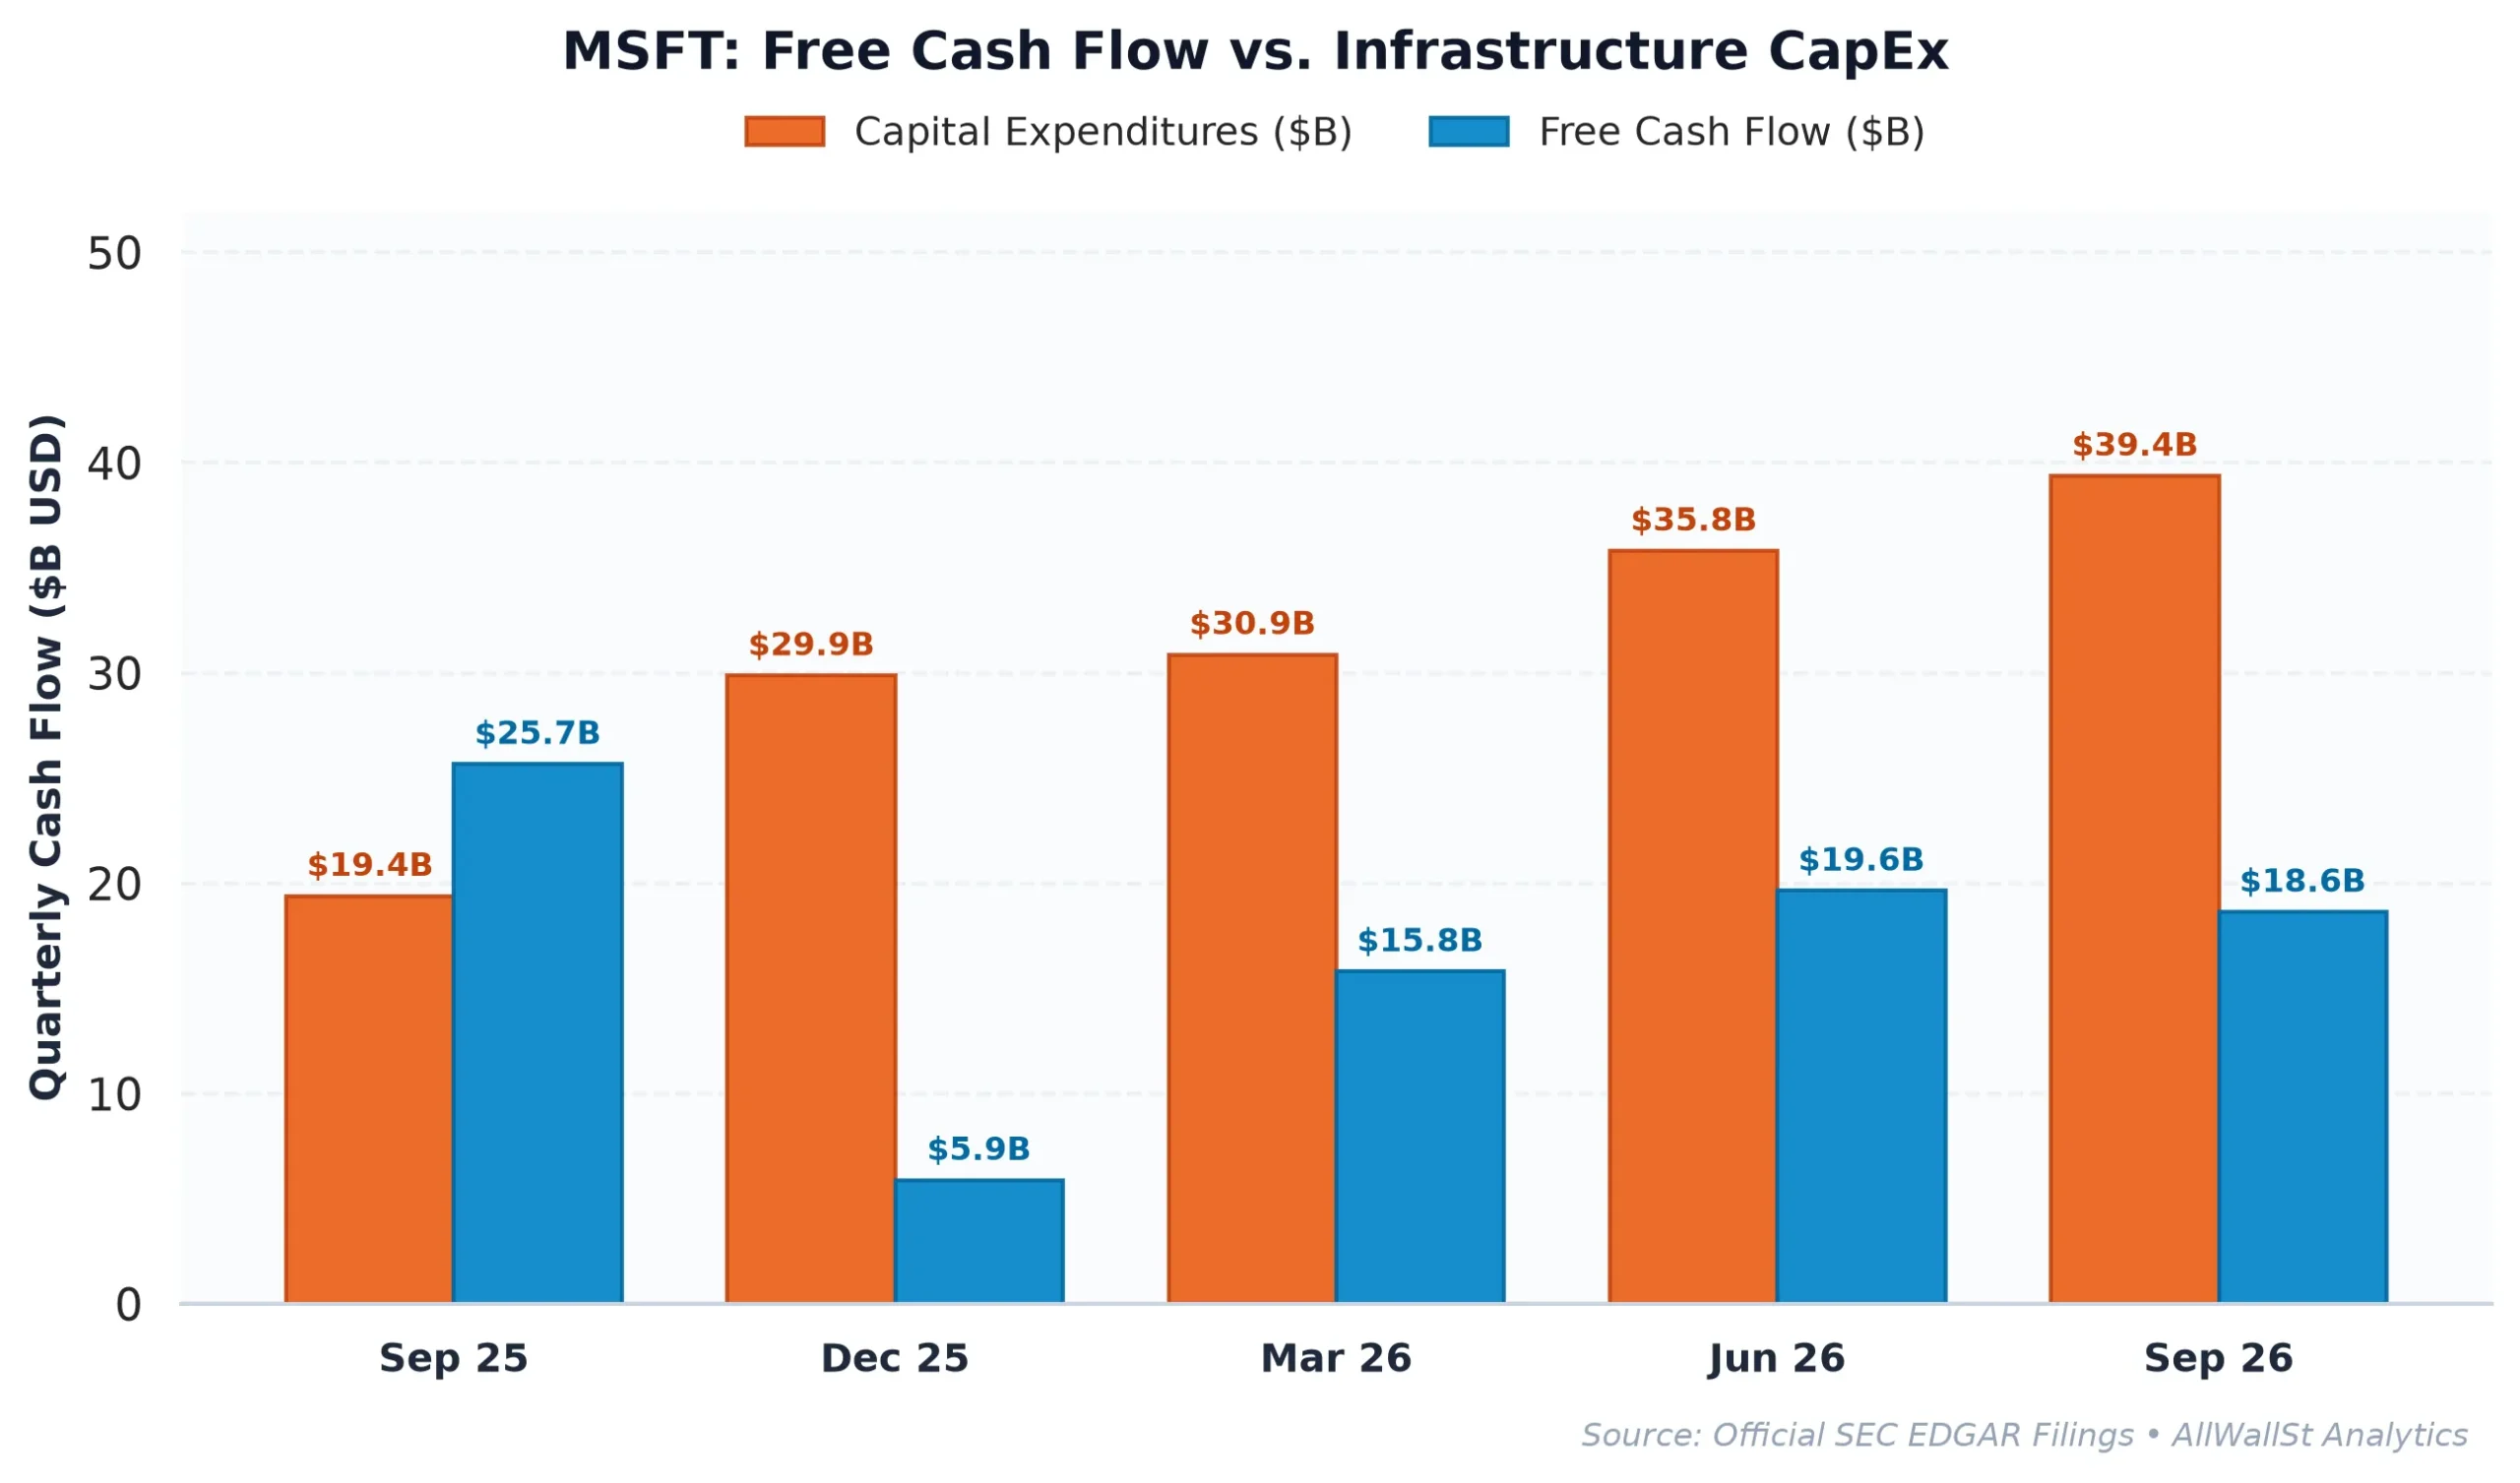
The CapEx Black Hole
While the narrative focuses on IT outages, the balance sheet tells a story of immense capital intensity. Microsoft is currently deploying $192.88 billion in CapEx, representing over 55% of its revenue. This is a staggering amount of money being poured into AI infrastructure and data centers.
The problem is that this spending is not yet translating into the kind of free cash flow that justifies a $3.89 trillion market cap. The company’s Free Cash Flow (FCF) yield sits at a negligible 0.08%. When you subtract the $12.40 billion in stock-based compensation (SBC), the real economic free cash flow actually turns negative. In an environment where the US 10-Year Treasury yield is 5.15%, an equity yielding close to zero requires an heroic amount of growth to make the math work.
| Company (Ticker) | Market Cap | Forward P/E | EV/EBITDA | Rev Growth (YoY) | Operating Margin | FCF Yield |
|---|---|---|---|---|---|---|
| Microsoft (MSFT) | $3.89T | 21.7x | 19.2x | 18.80% | 47.10% | 0.08% |
| Alphabet (GOOGL) | $3.64T | 19.2x | 19.3x | 24.7% | 33.3% | -0.03% |
| Amazon.com (AMZN) | $2.88T | 24.4x | 16.8x | 12.1% | 13.1% | -1.20% |
| Oracle (ORCL) | $390.8B | 11.3x | 15.2x | 29.6% | 34.3% | -11.73% |
As the table above shows, Microsoft is trading at a significant premium to Oracle (ORCL), which is growing faster (29.6% vs 18.8%) and has a much lower forward multiple. While Microsoft’s operating margins are superior, the “Rule of 40” score of 19.7% suggests that the company is currently failing to balance growth and profitability at the level expected of a premier software titan.
Market Structure and the Gamma Pin
Despite the “black eye” from the outage, the options market is currently acting as a stabilizer for the share price. The Put/Call Open Interest ratio of 0.84 indicates a relatively balanced sentiment among institutional hedgers. More importantly, the Max Pain strike sits at $525.00, just 0.21% away from the current price.
This suggests that as we approach expiration, dealer hedging will likely pin the stock near its current levels, preventing a reflexive selloff. There is a formidable Call Wall at $550.00 that will act as a ceiling for any recovery rally, while a Put Wall at $500.00 provides a structural floor. For now, Microsoft is trapped in a volatility dampening zone (long gamma territory) where price action is likely to remain range-bound.
The real risk is not a sudden crash, but a slow erosion of the “Microsoft Premium.” If regulators use this outage as ammunition to challenge the bundling of Azure and Defender, or if CIOs successfully shift 10% of their spend to competitors for the sake of redundancy, the 21.7x forward P/E starts to look very vulnerable.
Investment Committee Steelman Dissent
The bull case remains that Microsoft’s lead in generative AI through its OpenAI partnership and Azure integration creates a generational platform shift that will eventually drive FCF yield back above sovereign rates. Furthermore, the sheer scale of the $500 Put Wall suggests that institutional managers view any dip as a mandatory buying opportunity to maintain their benchmark weights.
AllWallSt Investment Verdict: HOLD
Microsoft Corporation (MSFT)
Trailing P/E
Marcus Wolfe Screen
Leverage Profile
30D Channel
Dealer Gamma Pinning & Max Pain Alignment (MSFT)
🎯 Max Pain: $525.00
Spot $523.88
Ceiling $550C Resistance ▲
MODERATE WATCHLIST (1 flag): Inventory growth outpaced COGS growth by >15%, signaling potential inventory bloat or pending margin compression.
Prudent Leverage (0.34x Net Debt/EBITDA); well within investment-grade covenant headroom.
Negative yield spread (-5.08% vs 5.15% Treasury); equity requires robust multiple expansion or growth.
Max Pain: $525.00 (+0.21%) | P/C Ratio: 0.84 | 30D Channel: $484.07 – $563.69. Dealer gamma bounded between $500 Put Wall and $550 Call Wall.
MSFT commands a massive ~7.1% S&P 500 benchmark footprint. Wall Street sell-side consensus reflects structural career-risk defense: institutional funds face severe benchmark tracking penalties for underweighting mega-cap heavyweights, forcing mandatory allocations regardless of current Free Cash Flow yield.
Accumulation Deferred (Await Pullback toward $490.00 – $510.00 Support Pinning)
Sustained weekly close below $500.00 (Put Wall) or acceleration in margin compression.
IC Counter-Thesis: While our neutral stance balances 27.3x trailing earnings and 0.08% FCF yield against a 5.15% 10-year yield hurdle (0.34x Net Debt/EBITDA), a decisive breakout above $550 on accelerating earnings revisions could leave sidelined capital underexposed. Conversely, a breach of $500 would confirm that valuation support is illusory alongside 1 flagged accrual anomalies.
Sources & References
- Official SEC Form 10-K Annual Report (Filed 2026-07-29)
- Microsoft Corporation SEC EDGAR Filings
- Microsoft Investor Relations
- SEC Form 10-Q (Filed October 28, 2026)
Regulatory Disclaimer: This report is for informational purposes only and does not constitute investment, legal, or tax advice. The views expressed are those of the AllWallSt editorial team and do not represent a recommendation to buy or sell any security. All investing involves risk, including the potential loss of principal. Performance data cited represents past performance and does not guarantee future results. Microsoft Corporation (MSFT) is a major component of global equity indices; changes in its valuation can have significant impacts on broader market performance. AllWallSt and its affiliates may hold positions in the securities discussed. Consult with a qualified financial advisor before making any investment decisions.