
If you want to understand the modern American corporation, you could do worse than looking at Meta Platforms, Inc. (META). This week, the company made headlines for two seemingly unrelated things. First, it is reportedly testing a prediction-market app with its employees, allowing them to bet on various outcomes. Second, it was fined $887 million by Italian regulators over data access issues for Android users.
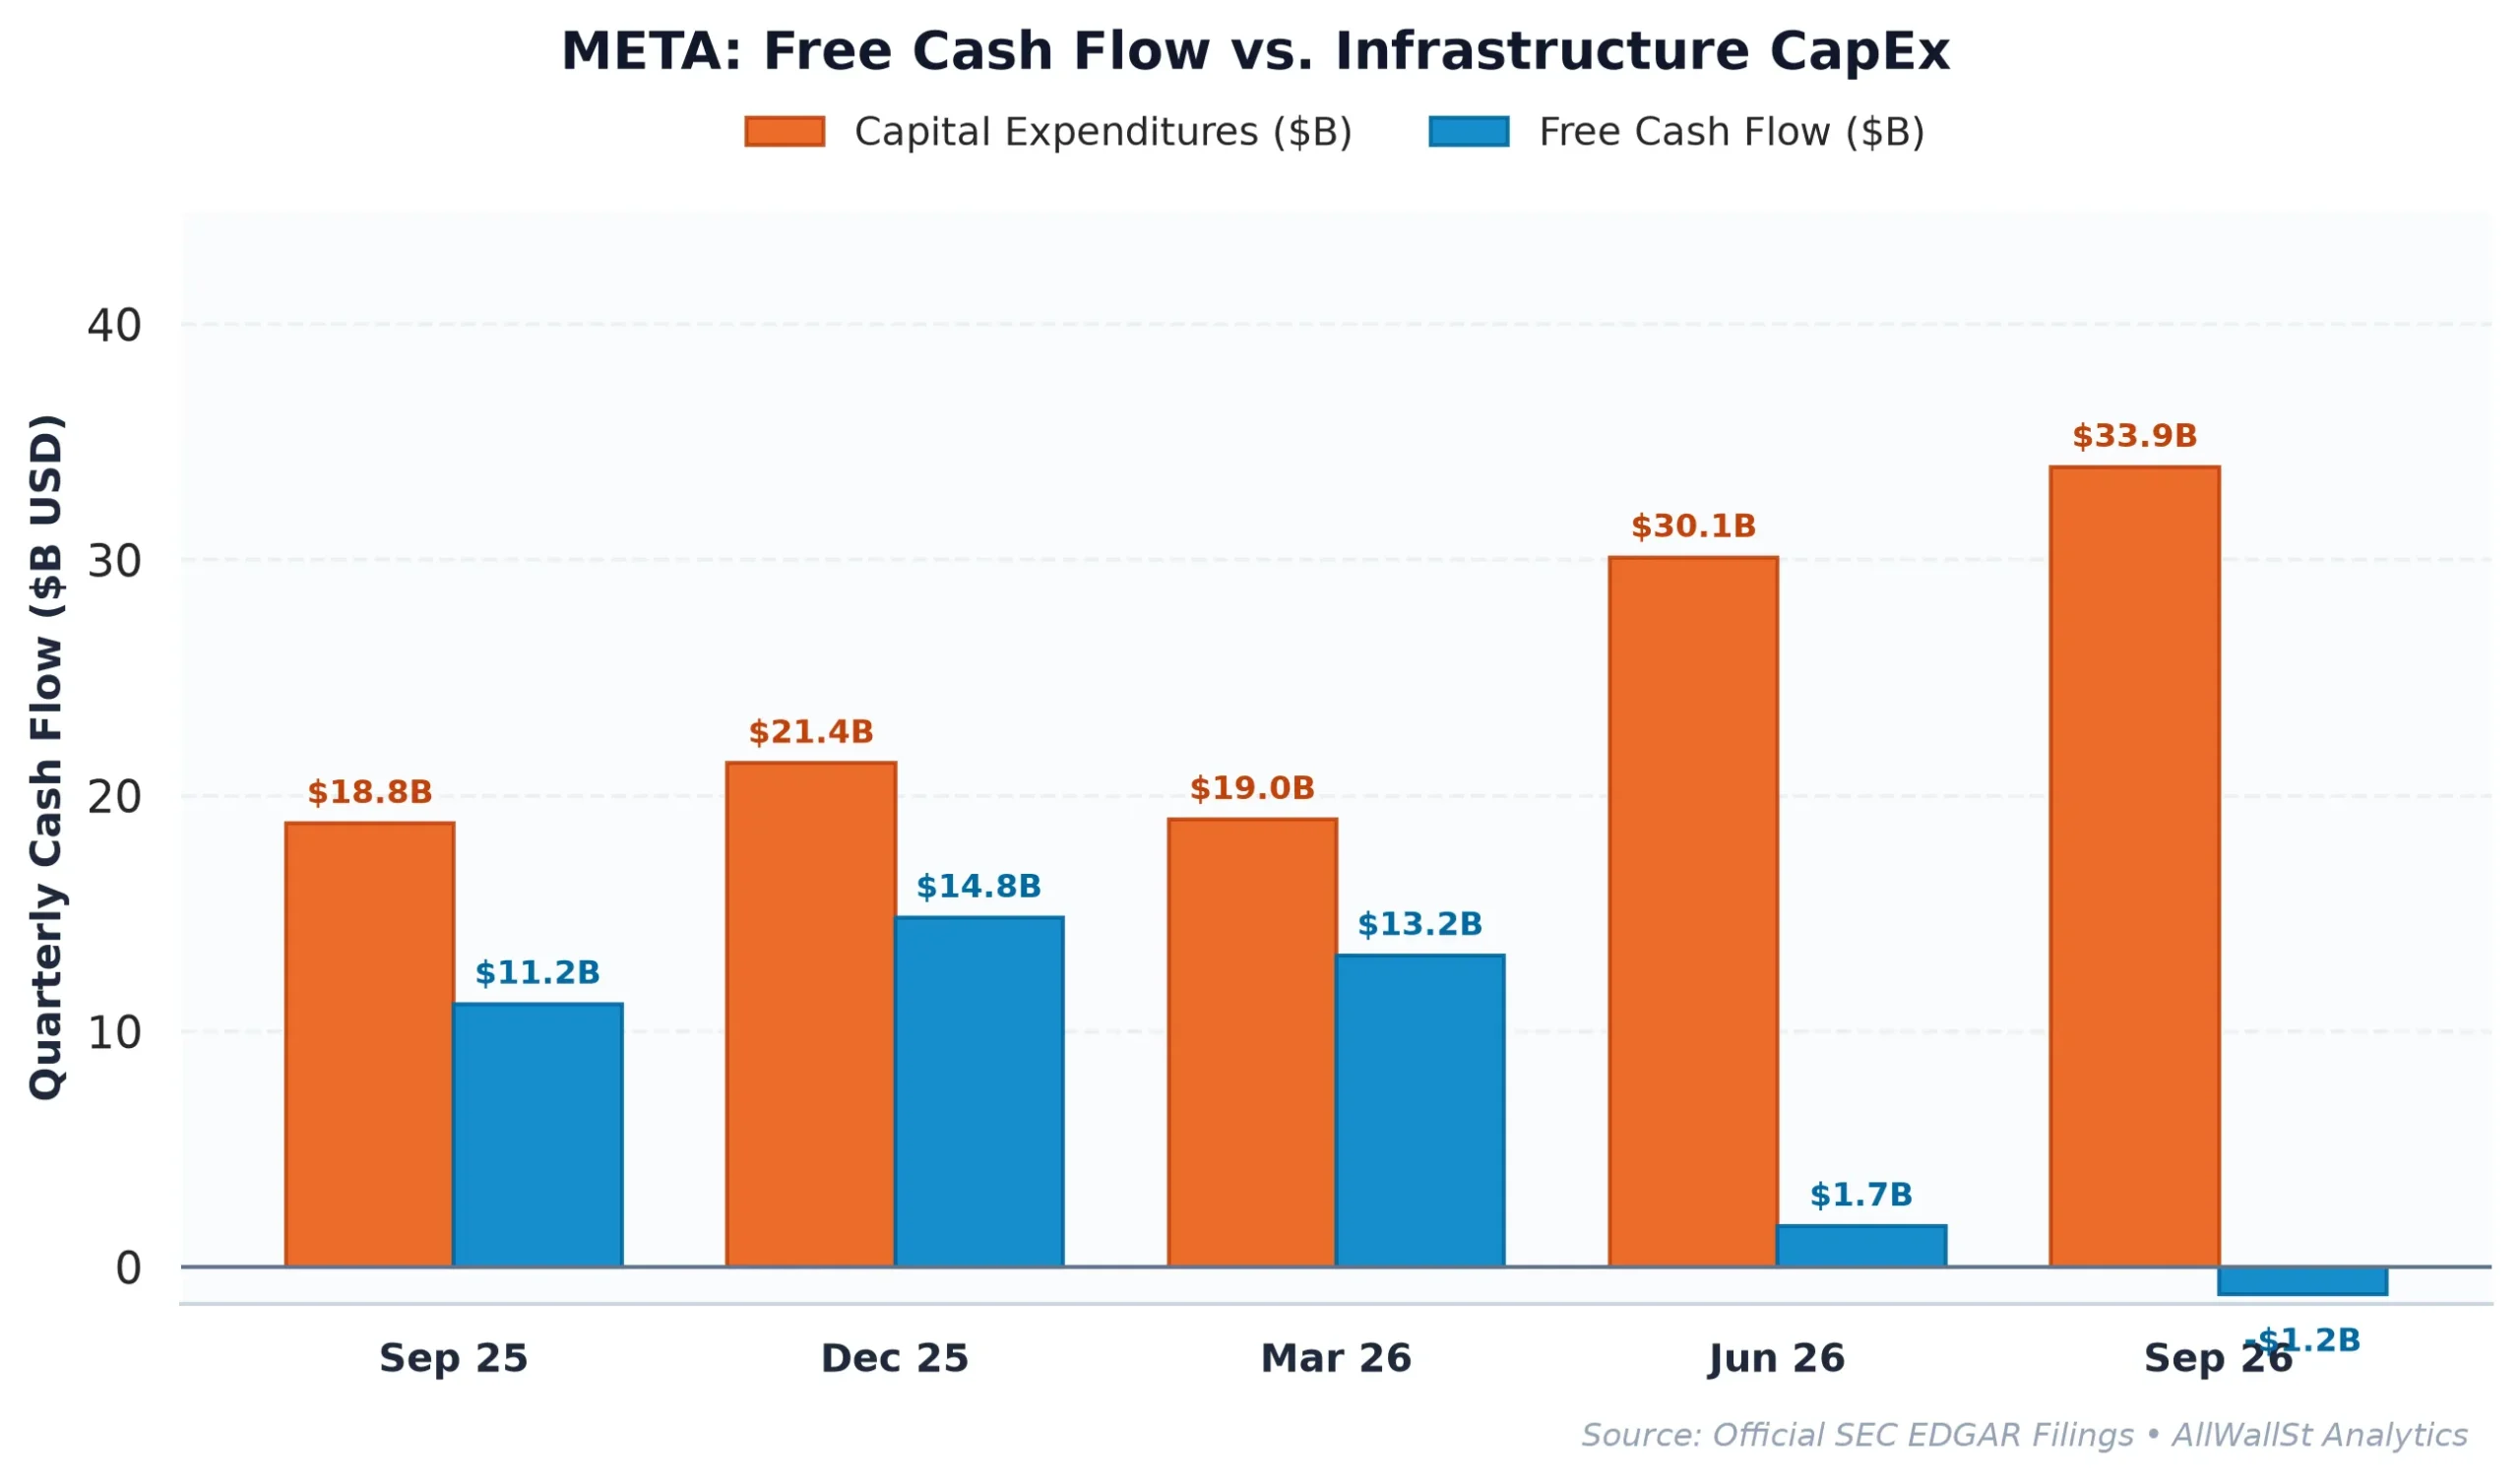
The prediction market is the more interesting bit. It suggests that Meta, a company that spends more on capital expenditures than most sovereign nations spend on their entire militaries, wants to use the collective wisdom of its workforce to figure out what is going to happen next. One might suggest that if you are spending $116 billion a year on AI hardware and data centers, you shouldn’t need a corporate betting pool to tell you if it’s working, but here we are.
The fundamental tension at Meta is that it is a world-class advertising business that has been converted into a massive, centralized AI-investment vehicle. It generates staggering amounts of cash from people clicking on things in Instagram and Facebook, and then it immediately hands that cash to Nvidia and a small army of software engineers.
The Forensic Reality of the SBC Loop
When a company like Meta Platforms, Inc. (META) reports its financial results, there is the number they want you to see, and then there is the economic reality hidden in the footnotes. For the trailing period, Meta reported Free Cash Flow (FCF) of $16.85 billion. In a vacuum, that sounds like a lot of money. However, in the same period, the company issued $20.43 billion in Stock-Based Compensation (SBC).
This creates a fascinating accounting phenomenon. If you subtract the SBC from the reported FCF, you get what we call Real Free Cash Flow, which for Meta is currently negative $3.58 billion. This means that, on an economic basis, the company is not actually generating excess cash for its common shareholders. Instead, it is generating cash to pay its employees in stock, and then it is using its actual cash to buy back that stock so that the share count doesn’t explode.
| Period | Revenue | Operating Income | Operating Margin | Free Cash Flow | SBC Expense |
|---|---|---|---|---|---|
| FY2022 | $116.61B | $28.94B | 24.8% | $19.29B | $11.99B |
| FY2023 | $134.90B | $46.75B | 34.7% | $44.07B | $14.03B |
| FY2024 | $164.50B | $69.38B | 42.2% | $54.07B | $16.69B |
| FY2025 | $200.97B | $83.28B | 41.4% | $46.11B | $20.43B |
Looking at the multi-year trajectory, we see the SBC expense rising from $11.99 billion in 2022 to over $20 billion today. The share repurchase program, which totaled $26.25 billion over the last year, is essentially a $20 billion employee retention program and a $6 billion shareholder return program. While the company has a 26.87% Return on Invested Capital (ROIC), which easily clears its 8.5% cost of capital hurdle, the actual “cash” being returned to you, the outside investor, is much thinner than the headline numbers suggest.
The 10-year Treasury yield is currently sitting at 5.15%. Meta’s Real FCF Yield (net of SBC) is negative 0.22%. In any other era of financial history, a company yielding less than a risk-free bond would be a pariah. But Meta is growing revenue at 26.1% and maintains an 81% gross margin. The market is betting that the $116 billion in CapEx will eventually turn into a new, even larger cash machine that will outrun the dilution.
Peer Valuation and the Competitive Moat
To be fair to Meta, it is not the only company playing this game. Its peers in the TMT sector are also grappling with the reality that being an AI leader requires spending more money than God has. When we compare Meta to its direct competitors, the valuation actually looks somewhat reasonable on a relative basis.
| Company (Ticker) | Market Cap | Forward P/E | EV/EBITDA | Rev Growth (YoY) | Operating Margin | FCF Yield |
|---|---|---|---|---|---|---|
| Meta Platforms (META) | $1.64T | 18.0x | 14.4x | 26.10% | 37.78% | 1.03% |
| Alphabet (GOOGL) | $3.64T | 19.2x | 19.1x | 24.7% | 33.3% | -0.03% |
| Netflix (NFLX) | $255.2B | 16.5x | 16.6x | 11.8% | 31.3% | 9.98% |
| Amazon.com (AMZN) | $2.88T | 24.4x | 13.1% | 12.1% | 13.1% | -1.20% |
Meta’s 18.0x forward P/E is a discount to Alphabet and a significant discount to Amazon. It is also growing faster than any of them. Its 37.78% operating margin is the gold standard in this group, proving that while its CapEx is high, its core business remains incredibly efficient. The “moat” here is not just the network effect of 3 billion users: it is the fact that Meta can spend $116 billion a year on infrastructure and still report a 31% net profit margin.
The $887 million fine in Italy is a reminder that regulators are always watching, but for a company with $82 billion in cash on the balance sheet, it is a rounding error. It represents about four days of operating income. The real risk is not the regulators, but the possibility that the AI CapEx cycle doesn’t have a clear exit ramp. If you spend $100 billion a year just to keep your ad-targeting relevant, you haven’t bought a new business: you’ve just increased the cost of your old one.
Options Structure and the Path to $700
The options market is currently leaning into a speculative long skew. With a Put/Call Open Interest ratio of 0.47, there is a heavy concentration of call buying. This suggests that retail and institutional speculators are betting on a year-end rally. The primary Call Wall sits at $700, which will likely act as a ceiling for the current move.
On the downside, we see a Max Pain strike at $630. This is the level where the most options contracts expire worthless, and it often acts as a magnetic anchor as we approach expiration. If the stock stays above $630, dealer hedging (gamma) should provide a floor. However, with the expected 30-day move at +/- 11.95%, the market is pricing in significant volatility.
Twenty-four days ago, we assigned a HOLD rating to Meta Platforms, Inc. (META) at $694.25, citing the massive CapEx wall. Since then, the stock has pulled back to $641.69, while the fundamental trajectory has remained robust. The 26% revenue growth and 18x forward multiple now represent a much more attractive entry point, even with the SBC concerns. The “Real FCF” may be negative, but the “GAAP Net Income” of $75 billion is very real, and the company’s ability to self-fund its massive AI ambitions without tapping high-cost private credit markets is a structural advantage in a 5.15% yield world.
The boardroom governance remains tightly controlled by Mark Zuckerberg’s dual-class share structure, which means there is no activist coming to save you from the CapEx spend. You are betting on the founder. At these levels, that bet finally has a margin of safety.
Investment Committee Steelman Dissent: The bear case rests on the fact that Meta’s real economic free cash flow is negative once you account for the massive dilution used to pay employees. If the AI investment cycle fails to yield a massive new revenue stream, shareholders are left holding a legacy ad business with a permanent, multi-billion dollar annual hardware tax.
AllWallSt Investment Verdict: BUY (Upgrade from HOLD)
Meta Platforms, Inc. (META)
Trailing P/E
Marcus Wolfe Screen
Leverage Profile
30D Channel
Dealer Gamma Pinning & Max Pain Alignment (META)
🎯 Max Pain: $630.00
Spot $641.69
Ceiling $700C Resistance ▲
Pristine cash flow conversion (1.92x) and healthy accrual ratio (-15.12%). Zero accounting anomalies detected (LOW ANOMALY RISK).
Prudent Leverage (0.28x Net Debt/EBITDA); well within investment-grade covenant headroom.
Negative yield spread (-4.13% vs 5.15% Treasury); equity requires robust multiple expansion or growth.
Max Pain: $630.00 (-1.82%) | P/C Ratio: 0.47 | 30D Channel: $565.01 – $718.37. Dealer gamma bounded between $600 Put Wall and $700 Call Wall.
META commands a massive ~3.0% S&P 500 benchmark footprint. Wall Street sell-side consensus reflects structural career-risk defense: institutional funds face severe benchmark tracking penalties for underweighting mega-cap heavyweights, forcing mandatory allocations regardless of current Free Cash Flow yield.
$588.00 – $612.00 (Options Support Pinning)
Sustained weekly close below $600.00 (Put Wall) or gross margin compression below 81.03%.
Bearish IC Dissent: At 21.9x trailing earnings and 1.03% FCF yield against a 5.15% 10-year risk-free hurdle, Meta Platforms, Inc. (META) leaves thin margin for top-line deceleration or margin compression (0.28x Net Debt/EBITDA). If institutional flows break below the $600 put wall, dealer de-hedging can accelerate multiple contraction before fundamental buyers step in.
Sources & References
- Official SEC Form 10-K Annual Report (Filed 2026-01-29)
- SEC EDGAR: Meta Platforms, Inc. (CIK 0001326801)
- Meta Platforms Investor Relations
- SEC Form 10-Q Filed October 22, 2026
- SEC Form 8-K Filed November 12, 2026
Regulatory Disclaimer: This report is for informational purposes only and does not constitute investment, legal, or tax advice. AllWallSt is a financial journalism outlet, not a registered investment advisor. Investing in equities involves substantial risk, including the potential loss of principal. Quantitative data is sourced from primary SEC filings and exchange feeds but is not guaranteed for accuracy. Past performance is not indicative of future results. The “Investment Verdict” represents the collective analytical opinion of the AllWallSt editorial board and should not be the sole basis for any investment decision. All figures are in USD unless otherwise specified.