
Johnson & Johnson (JNJ) is currently engaged in the corporate equivalent of a high stakes home renovation. Having spun off its consumer health business, the company is now a pure play medical giant trying to prove that it can grow fast enough to justify a 24.3x forward earnings multiple. On Monday, it added a new room to the house, announcing a deal to acquire Ollin Biosciences for an upfront $2.2 billion.
The deal, which could reach $3.3 billion if certain milestones are hit, is a classic pharmaceutical move. You find a specialist with a promising drug for vision loss, you pay a premium to take them off the board, and you plug them into your massive global distribution machine. It is a logical way to spend cash, but in a world where the 10-Year Treasury yield sits at 5.12%, the math for equity investors is becoming increasingly selective.
The Acquisition Treadmill and the Rule of 40
When a company of this size buys a biotech startup, it is usually because its internal growth engine needs a top-off. Johnson & Johnson reported Q3 2026 results showing a raise in full-year sales guidance to $101.2 billion, representing roughly 7.4% growth. That is respectable for a behemoth, but it still leaves the company with a Rule of 40 score of 24.5%, which is just shy of the institutional benchmark for high-performing growth at a reasonable price.
The Rule of 40 is a simple sanity check: you add your revenue growth to your free cash flow margin. If the sum is over 40, you are a compounding machine. If it is below 25, you are a mature incumbent that might be working too hard for every dollar of growth. By acquiring Ollin, the company is signaling that it prefers buying innovation to letting cash sit on a balance sheet that currently carries $27.42 billion in net debt.
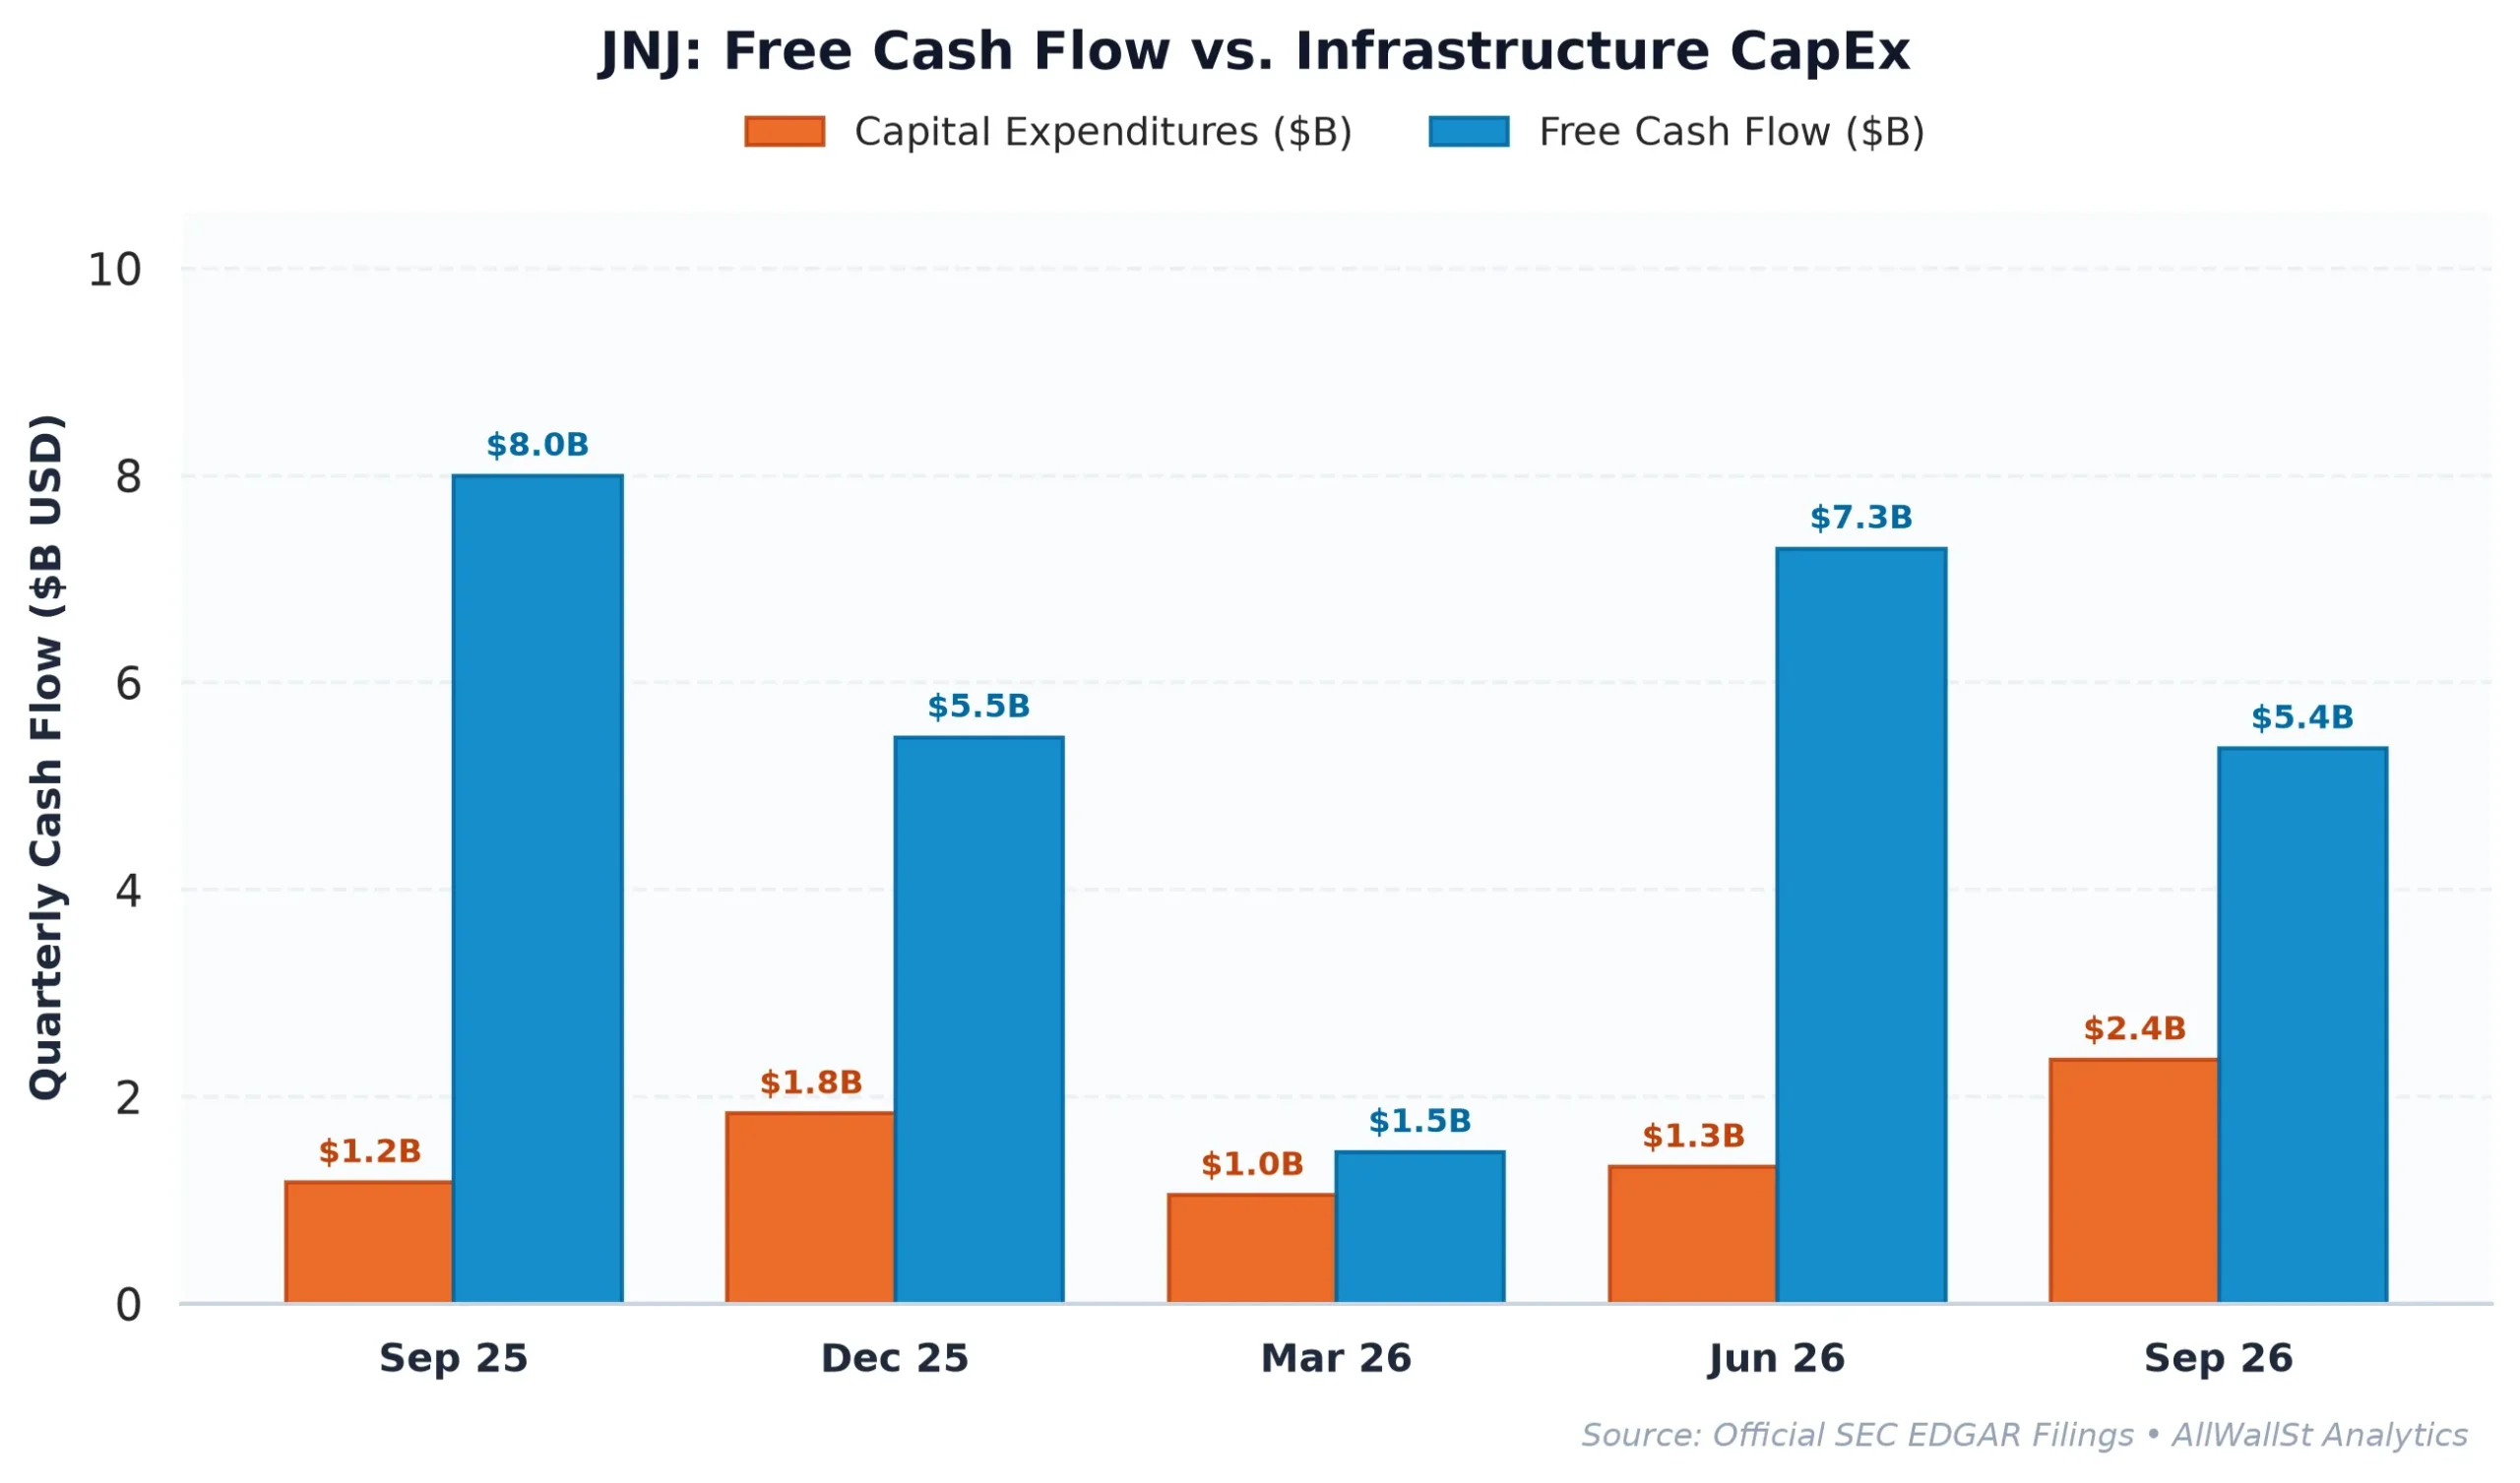
The Yield Gap and Institutional Gravity
The central paradox of Johnson & Johnson is its valuation relative to risk-free assets. The stock offers a free cash flow yield of 2.72%, which is significantly lower than the 5.12% you can get from a 10-Year Treasury. In a vacuum, you would never buy a risky drug maker that pays you half as much as the government. But Johnson & Johnson does not exist in a vacuum: it exists in the S&P 500 with a 1.2% index weight.
Institutional managers cannot simply ignore a company this large. If the healthcare sector rallies and you do not own the main pillar, you lose your job for underperforming the benchmark. This “institutional gravity” creates a floor for the stock price that has nothing to do with discounted cash flow models. It also helps that the company maintains a Return on Invested Capital (ROIC) of 19.15%, which is more than double its estimated cost of capital.
| Period | Revenue | Operating Margin | Free Cash Flow | SBC Expense |
|---|---|---|---|---|
| FY2022 | $79.99B | 26.3% | $17.18B | $1.14B |
| FY2023 | $85.16B | 25.8% | $17.78B | $1.16B |
| FY2024 | $88.82B | 23.9% | $18.06B | $1.18B |
| FY2025 | $94.19B | 27.2% | $19.31B | $1.35B |
Options Plumbing and the $280 Magnet
From a market structure perspective, the stock is currently bumping against a ceiling. There is a significant Call Wall at the $280 strike, where options dealers have sold thousands of contracts. When a stock sits near a Call Wall, dealers are often forced to sell the underlying shares to hedge their positions as the price rises, which acts as a mechanical drag on the rally.
The Max Pain strike, the point where the most options expire worthless, is currently down at $265. While this suggests some technical downside risk, the 30-day expected move is a wide +/- 7.75%. For a stock with a Beta of 0.2, which means it usually moves like a glacier compared to the broader market, this volatility pricing suggests that traders are finally paying attention to the M&A headline risk.
| Company (Ticker) | Forward P/E | EV/EBITDA | Rev Growth (YoY) | Operating Margin | FCF Yield |
|---|---|---|---|---|---|
| Johnson & Johnson (JNJ) | 24.3x | 20.7x | 5.90% | 26.59% | 2.72% |
| Merck & Co (MRK) | 16.1x | 13.9x | 4.7% | 35.2% | 3.94% |
| AbbVie (ABBV) | 18.2x | 18.6x | 10.3% | 36.6% | 3.40% |
| Pfizer (PFE) | 9.8x | 8.6x | -0.4% | 29.1% | 7.91% |
The Legal Asterisk and the Path Forward
No discussion of this company is complete without mentioning the talc litigation. In its latest 8-K filing, management noted a “one-time special charge” related to the proposed settlement. This is the permanent cloud over the balance sheet. However, by raising adjusted EPS guidance to $11.10, the company is trying to steer the narrative back to its operational breakthroughs, specifically its OTTAVA MedTech platform and multiple myeloma treatments.
When you compare the company to peers like Merck or Pfizer, you are paying a premium for stability. Merck trades at 16.1x and Pfizer at a lowly 9.8x, but neither possesses the same diversified MedTech and pharmaceutical mix. Johnson & Johnson is essentially a high-margin toll booth on the aging process: as long as people need new hips and cancer drugs, the cash flow remains inevitable.
Investment Committee Steelman Dissent: The strongest bear case rests on the widening gap between the company’s 2.72% FCF yield and the 5.12% Treasury benchmark, which suggests the stock is fundamentally overvalued in a high-rate environment. Additionally, any failure to finalise the talc litigation settlement could trigger a sudden re-pricing of the company’s liability profile and a contraction of its 24.3x forward multiple.
AllWallSt Investment Verdict: BUY
Johnson & Johnson (JNJ)
Trailing P/E
Marcus Wolfe Screen
Leverage Profile
30D Channel
Dealer Gamma Pinning & Max Pain Alignment (JNJ)
🎯 Max Pain: $265.00
Spot $282.55
Ceiling $280C Resistance ▲
Pristine cash flow conversion (0.92x) and healthy accrual ratio (1.14%). Zero accounting anomalies detected (LOW ANOMALY RISK).
Prudent Leverage (0.79x Net Debt/EBITDA); well within investment-grade covenant headroom.
Negative yield spread (-2.40% vs 5.12% Treasury); equity requires robust multiple expansion or growth.
Max Pain: $265.00 (-6.21%) | P/C Ratio: 0.8 | 30D Channel: $260.65 – $304.45. Dealer gamma bounded between $260 Put Wall and $280 Call Wall.
JNJ represents a core ~1.2% index pillar. Institutional managers face persistent benchmark drag if under-allocated during sector rallies, biasing sell-side consensus toward institutional overweight.
$254.80 – $265.20 (Options Support Pinning)
Sustained weekly close below $260.00 (Put Wall) or gross margin compression below 67.77%.
Bearish IC Dissent: At 42.9x trailing earnings and 2.72% FCF yield against a 5.12% 10-year risk-free hurdle, Johnson & Johnson (JNJ) leaves limited cushion for top-line deceleration or margin compression (0.79x Net Debt/EBITDA). If institutional flows break below the $260 put wall, dealer de-hedging can accelerate multiple contraction before fundamental buyers step in.
Sources & References
- Official SEC Form 10-K Annual Report (Filed 2026-02-11)
- SEC EDGAR: JOHNSON & JOHNSON Complete Filing History
- SEC Form 8-K Exhibit 99.1 (Press Release / Earnings) (2026-08-04)
- SEC Form 8-K Exhibit 99.1 (Press Release / Earnings) (2026-10-13)
- SEC DEF 14A Proxy / M&A Filing (2026-03-11)
- USASpending Federal Contract Award ($0.4M, Department of Veterans Affairs)
- Johnson & Johnson Investor Relations: https://www.jnj.com
- SEC EDGAR Filing (10-Q): https://www.sec.gov/Archives/edgar/data/200406/000020040626000197/jnj-20260927.htm
- SEC EDGAR Filing (8-K): https://www.sec.gov/Archives/edgar/data/200406/000020040626000189/jnj-20261013.htm
- Federal Reserve Press Release: https://www.federalreserve.gov/newsevents/pressreleases/orders20261109a.htm
Disclaimer: This report is for informational purposes only and does not constitute financial, legal, or tax advice. The AllWallSt Institutional Research Team provides analysis based on publicly available regulatory filings and market data. Investing in equities involves significant risk, including the potential loss of principal.