
⚡ Executive Morning Takeaways
- Overnight Futures & Rates Impulse: Equity futures are drifting lower in a cautious pre-market session (ES=F -0.20%) as the US 10-Year Treasury yield holds firm at 5.12%. High risk-free rates continue to exert mechanical pressure on long-duration technology multiples.
- Sector Rotation Leaders & Laggards: Capital is seeking shelter in defensive pockets: Consumer Staples (XLP) and Utilities (XLU) are the only green spots on the board. Technology (XLK) remains the primary laggard (down 3.24%) as institutional desks trim exposure ahead of major retail and tech prints.
- Primary Corporate Catalyst: NVIDIA Corporation (NVDA) is the undisputed center of gravity today. Between board-level drama regarding Jensen Huang and a stark warning to customers over Chinese AI chip access, the stock is navigating a volatile options landscape bounded between $150.00 put support and major overhead call resistance above $180.00.
🌐 Pre-Market Macro, Futures & Rates Dashboard
| Asset / Benchmark | Ticker | Current Price / Level | Change (%) | 52-Week Low | 52-Week High |
|---|---|---|---|---|---|
| E-Mini S&P 500 Futures (ES=F) | ES=F | $7424.00 | -0.20% | $6353.25 | $7897.50 |
| E-Mini Nasdaq 100 Futures (NQ=F) | NQ=F | $27273.75 | -0.04% | $22961.50 | $31616.50 |
| S&P 500 (SPY) | SPY | $739.95 | -1.91% | $629.28 | $781.62 |
| Nasdaq 100 (QQQ) | QQQ | $661.75 | -2.67% | $555.60 | $762.86 |
| Russell 2000 (IWM) | IWM | $272.94 | -1.66% | $228.90 | $305.18 |
| 20+ Year Treasury (TLT) | TLT | $79.38 | +0.00% | $76.43 | $90.86 |
| High Yield Corporate (HYG) | HYG | $76.73 | -0.27% | $76.39 | $81.24 |
| Gold (GLD) | GLD | $352.93 | -0.71% | $351.96 | $509.70 |
| WTI Crude Oil (CL=F) | CL=F | $86.07/bbl | +0.41% | $54.98 | $119.48 |
| US Dollar Index Bullish (UUP) | UUP | $29.56 | +0.20% | $26.40 | $29.57 |
| CBOE Volatility Index (^VIX) | ^VIX | 23.35 | +1.92% | 13.38 | 35.30 |
| 2-Yr US Treasury Yield (2YY=F) | 2YY=F | 4.75% | +0.00% | 3.38% | 4.88% |
| 10-Yr US Treasury Yield (^TNX) | ^TNX | 5.12% | -0.64% | 3.96% | 5.36% |
The macro environment is currently defined by a persistent cost of capital reality. With the 10-Year Treasury yield (^TNX) hovering at 5.12%, the equity risk premium (the extra return you get for taking stock market risk over a government bond) has turned aggressively negative for high-growth names. When the risk-free rate is this high, every dollar of corporate profit is discounted more heavily: a mathematical gravity that even the most robust AI narratives cannot fully escape.
Volatility is also creeping back into the plumbing. The VIX has climbed to 23.35, suggesting that the market is no longer complacent about the geopolitical and regulatory hurdles facing the semiconductor complex. As the US Dollar Index (UUP) tests its 52-week highs, multinational earnings translated back into greenbacks face an uphill battle, particularly for firms with significant international footprints.
📊 Sector Rotation Leaders & Laggards
| Rotation Rank | Sector ETF | Ticker | Price | Change (%) | Trailing P/E | Dividend Yield | 52-Week Low | 52-Week High |
|---|---|---|---|---|---|---|---|---|
| Leader (#1) | Consumer Staples (XLP) | XLP | $92.60 | +0.27% | 24.9x | 2.46% | $76.23 | $93.48 |
| Leader (#2) | Utilities (XLU) | XLU | $44.12 | +0.18% | 18.1x | 2.79% | $39.03 | $47.80 |
| Leader (#3) | Healthcare (XLV) | XLV | $187.88 | -0.51% | 30.6x | 1.38% | $141.97 | $192.32 |
| Laggard (#8) | Industrials (XLI) | XLI | $165.66 | -1.85% | 26.6x | 1.13% | $147.14 | $188.19 |
| Laggard (#9) | Energy (XLE) | XLE | $63.69 | -1.96% | 15.9x | 2.18% | $43.77 | $70.15 |
| Laggard (#10) | Technology (XLK) | XLK | $164.76 | -3.24% | 29.1x | 0.47% | $126.68 | $203.25 |
Institutional money is currently voting for safety. The rotation into Consumer Staples (XLP) and Utilities (XLU) reflects a classic late-cycle defensive posture. Investors are willing to pay 24.9x earnings for soup and soap just to capture a 2.46% dividend yield, which looks increasingly attractive as high-beta sectors like Technology (XLK) experience violent 3.24% drawdowns.
The valuation dispersion is stark. While Energy (XLE) trades at a modest 15.9x multiple, Technology remains crowded at 29.1x, leaving little room for error. This rotation suggests that the “growth at any price” trade is being replaced by a “yield and visibility” mandate as the market digests the reality of 5%+ interest rates.
⏱️ Today’s Earnings & Economic Radar
Imminent Corporate Earnings Releases
| Company / Ticker | Timing | Consensus EPS | Consensus Revenue | Key Strategic Theme |
|---|---|---|---|---|
| Walt Disney (DIS) | Today (Nov 17) | $1.68 | $25.17B | Streaming Operating Income & Parks DTC Demand |
| Home Depot (HD) | Today (Nov 17) | $3.84 | $42.78B | Pro-Contractor Backlog vs Remodeling Demand |
| NVIDIA (NVDA) | Today (Nov 17) | $2.47 | $108.71B | Blackwell Rack Shipments & Hyperscaler Margins |
| Palo Alto Networks (PANW) | Tomorrow (Nov 18) | $0.97 | $3.31B | Platformization Billings & Next-Gen Security ARR |
| Target (TGT) | Tomorrow (Nov 18) | $2.08 | $26.53B | Discretionary Basket Size & Inventory Shrink |
High-Impact Economic Data & Central Bank Actions
| Time (ET) | Event | Impact | Key Institutional Focus |
|---|---|---|---|
| 08:30 AM | US Retail Sales (Headline) | CRITICAL | Real Discretionary Consumer Spend |
| 09:15 AM | US Industrial Production | HIGH | Manufacturing & Data-Center Utility Load |
| 04:30 PM | API Weekly Crude Oil Stock | MEDIUM | Commercial Distillate Draws |
The 08:30 AM Retail Sales print is the primary hurdle for the cash open. Institutional desks are looking for any sign that the consumer is finally buckling under the weight of sustained borrowing costs. If retail sales miss, the defensive rotation we are seeing in XLP and XLU will likely accelerate into the afternoon.
🎯 Pre-Market Spotlight: NVIDIA Corporation (NVDA)
NVIDIA Corporation (NVDA) finds itself in a peculiar state of narrative tension. On one hand, the business is a literal money printer: revenue has exploded by 105.9% year over year, and operating margins have stabilized at a staggering 65.21%. On the other hand, the board has spent the last 48 hours swatting away leadership rumors, explicitly rejecting calls for the return of Jensen Huang to a more active role (following his recent transition). This boardroom friction coincides with a “stark warning” the company issued regarding Chinese access to its AI chips, a move that signals heightening regulatory friction and potential revenue leakage in the Asia-Pacific theater.
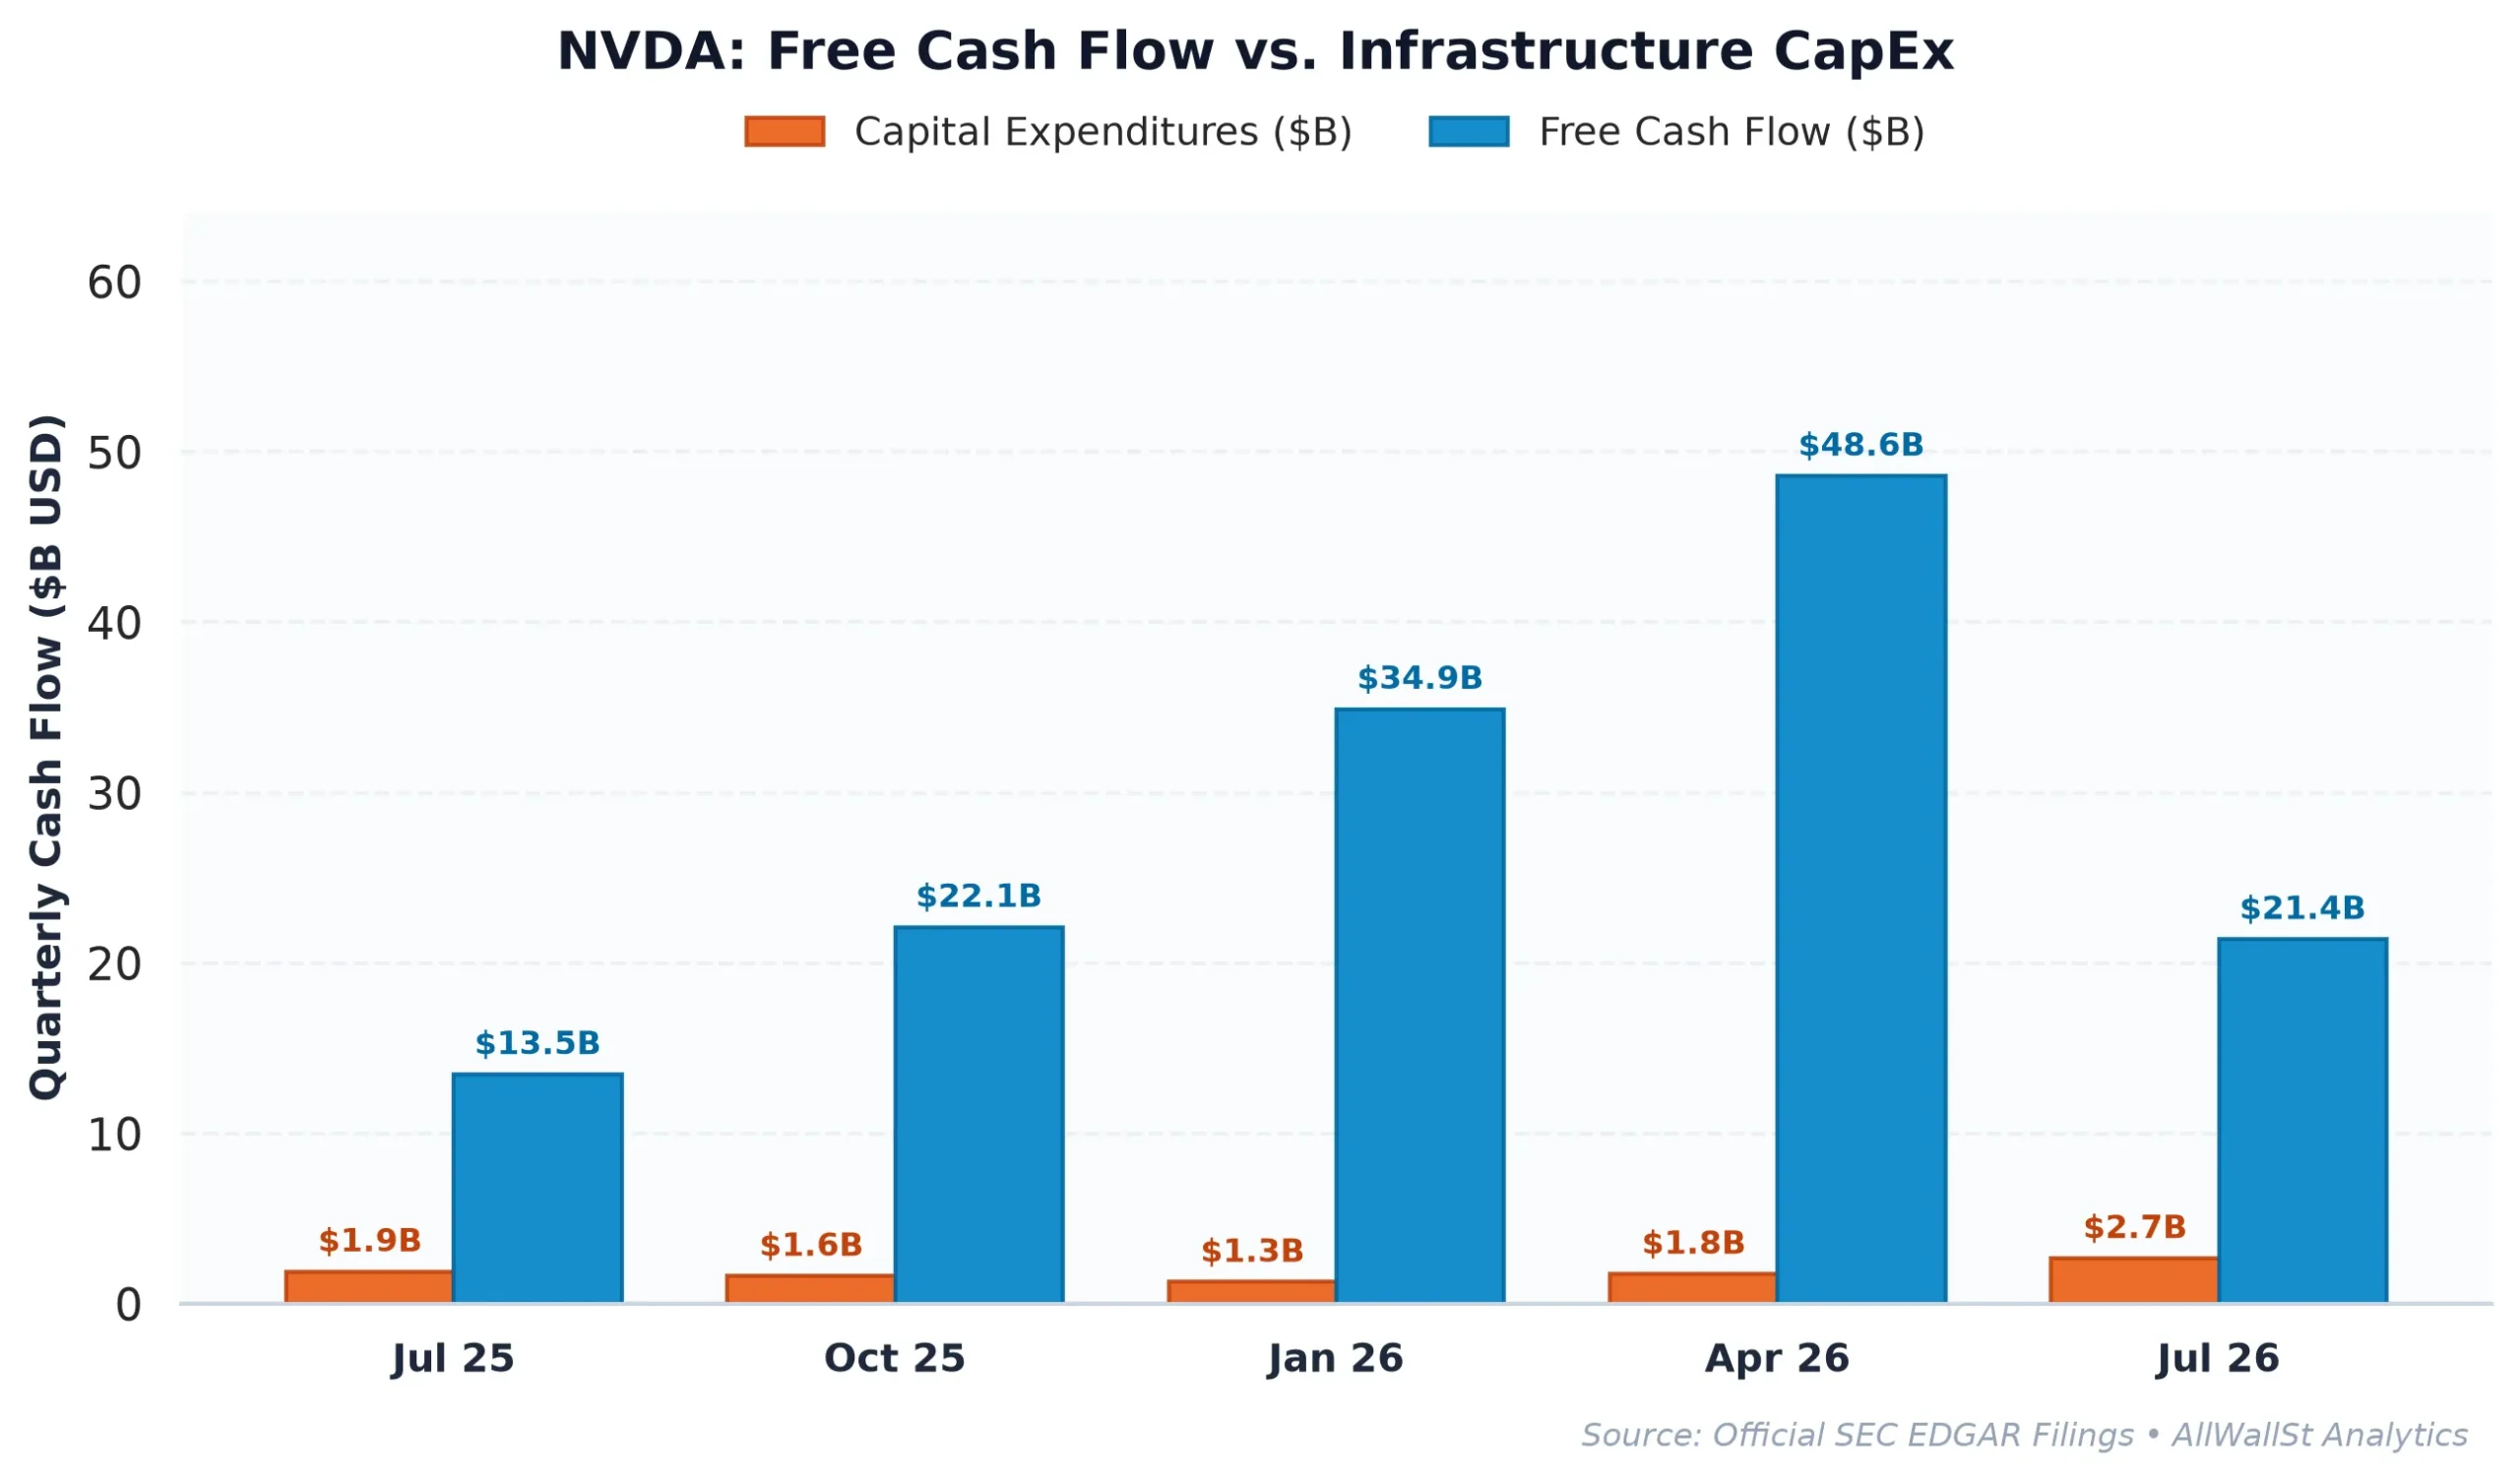
From a fundamental perspective, the math is becoming increasingly difficult for new capital. While the forward P/E of 9.8x looks optically cheap compared to peers like Advanced Micro Devices (AMD) at 28.6x, the free cash flow yield tells a different story. Nvidia is currently generating a 3.37% FCF yield. When compared to the 5.12% yield on a 10-Year Treasury, the spread remains negative at -1.75%. In institutional terms, you are paying a massive premium for the privilege of owning AI hardware risk when you could be sitting in risk-free government paper. Meanwhile, SEC cash flow disclosures show trailing four-quarter CapEx at a modest $7.35 billion (2.43% of revenue), preserving high cash conversion even as NVIDIA guarantees off-balance-sheet compute campus buildouts such as Pike County.
The options market structure suggests a tactical ceiling. Dealers hold concentrated upside supply anchored at a primary Call Wall at $210.00 (with secondary call resistance at $200.00 and $180.00), while Max Pain sits overhead at $175.00 (+12.08% above the $156.14 spot reference) on a 0.68 Put/Call ratio. With 30-day implied volatility pricing a violent +/- 19.76% (+/-$30.85) expected move across a $125.29 to $186.99 channel, volatility compression remains off the table ahead of tonight’s print.
Ultimately, Nvidia is a victim of its own benchmark gravity. Commanding a 6.9% weight in the S&P 500, institutional managers are forced to hold it to avoid career-ending tracking errors. However, for the unconstrained investor, the combination of a negative equity risk premium and rising regulatory hurdles suggests that the easy money has been made. We are watching for a test of the $150 put wall to see if dealer hedging provides a structural floor, or if the gravity of 5% rates finally pulls the AI titan back to earth.
Investment Committee Steelman Dissent: The bear case rests on the -1.75% FCF yield spread vs. Treasuries and heightened leadership uncertainty, yet this ignores that Nvidia’s 116.76% ROIC is more than ten times its cost of capital. If Blackwell rack shipments exceed the high end of guidance, the sheer scale of hyperscaler buy-ins could trigger a mechanical gamma chase toward the $180.00 to $210.00 call resistance zone regardless of macro yields.
AllWallSt Investment Verdict: HOLD
NVIDIA Corporation (NVDA)
Trailing P/E
Marcus Wolfe Screen
Leverage Profile
30D Channel
Dealer Gamma Pinning & Max Pain Alignment (NVDA)
🎯 Max Pain: $175.00
Spot $156.14
Ceiling $210C Resistance ▲
MODERATE WATCHLIST (1 flag): Inventory growth outpaced COGS growth by >15%, signaling potential inventory bloat or pending margin compression.
Fortress Balance Sheet (Net Cash Position; zero net refinancing distress).
Negative yield spread (-1.75% vs 5.12% Treasury); equity requires robust multiple expansion or growth.
Max Pain: $175.00 (+12.08%) | P/C Ratio: 0.68 | 30D Channel: $125.22 – $187.06. Dealer gamma bounded between $150 Put Wall and $210 Call Wall.
NVDA commands a massive ~6.9% S&P 500 benchmark footprint. Wall Street sell-side consensus reflects structural career-risk defense: institutional funds face severe benchmark tracking penalties for underweighting mega-cap heavyweights, forcing mandatory allocations regardless of current Free Cash Flow yield.
Accumulation Deferred (Await Pullback toward $147.00 – $153.00 Support Pinning)
Sustained weekly close below $150.00 (Put Wall) or acceleration in margin compression.
IC Counter-Thesis: While our neutral stance balances 19.7x trailing earnings and 3.37% FCF yield against a 5.12% 10-year yield hurdle, a decisive breakout above $210 on accelerating earnings revisions could leave sidelined capital underexposed. Conversely, a breach of $150 would confirm that valuation support is illusory alongside 1 flagged accrual anomalies.
Sources & References
- Official SEC Form 10-K Annual Report (Filed 2026-02-25)
- Official SEC Form 10-Q Quarterly Report (Filed 2026-08-26)
- SEC Form 8-K Exhibit 99.1 (Press Release / Earnings) (2026-08-17)
- SEC Form 8-K Primary Filing Body (2026-11-12)
- SEC DEF 14A Proxy / M&A Filing (2026-05-12)
- Federal Register (2026-07-22): Notice Pursuant to the National Cooperative Research and Production Act of 1993-UHD…
- Federal Register (2026-11-10): Notice Pursuant to the National Cooperative Research and Production Act of…
-
Federal Docket: INFERENCE STACK INC. v. NVIDIA Corporation (2026-11-13)
-
NVIDIA Corporation Investor Relations: https://www.nvidia.com
- SEC EDGAR Filings (CIK 0001045810): https://www.sec.gov/edgar/browse/?CIK=0001045810
- Federal Register (Antitrust & Trade Notices): https://www.federalregister.gov
Regulatory Disclaimer: AllWallSt is a financial publisher, not an investment advisor. The information provided in this dispatch is for informational purposes only and does not constitute a recommendation to buy or sell any security. Markets involve significant risk, and past performance is not indicative of future results. Always consult with a qualified financial professional before making investment decisions. All data is sourced from primary SEC filings and market feeds as of November 17, 2026.