
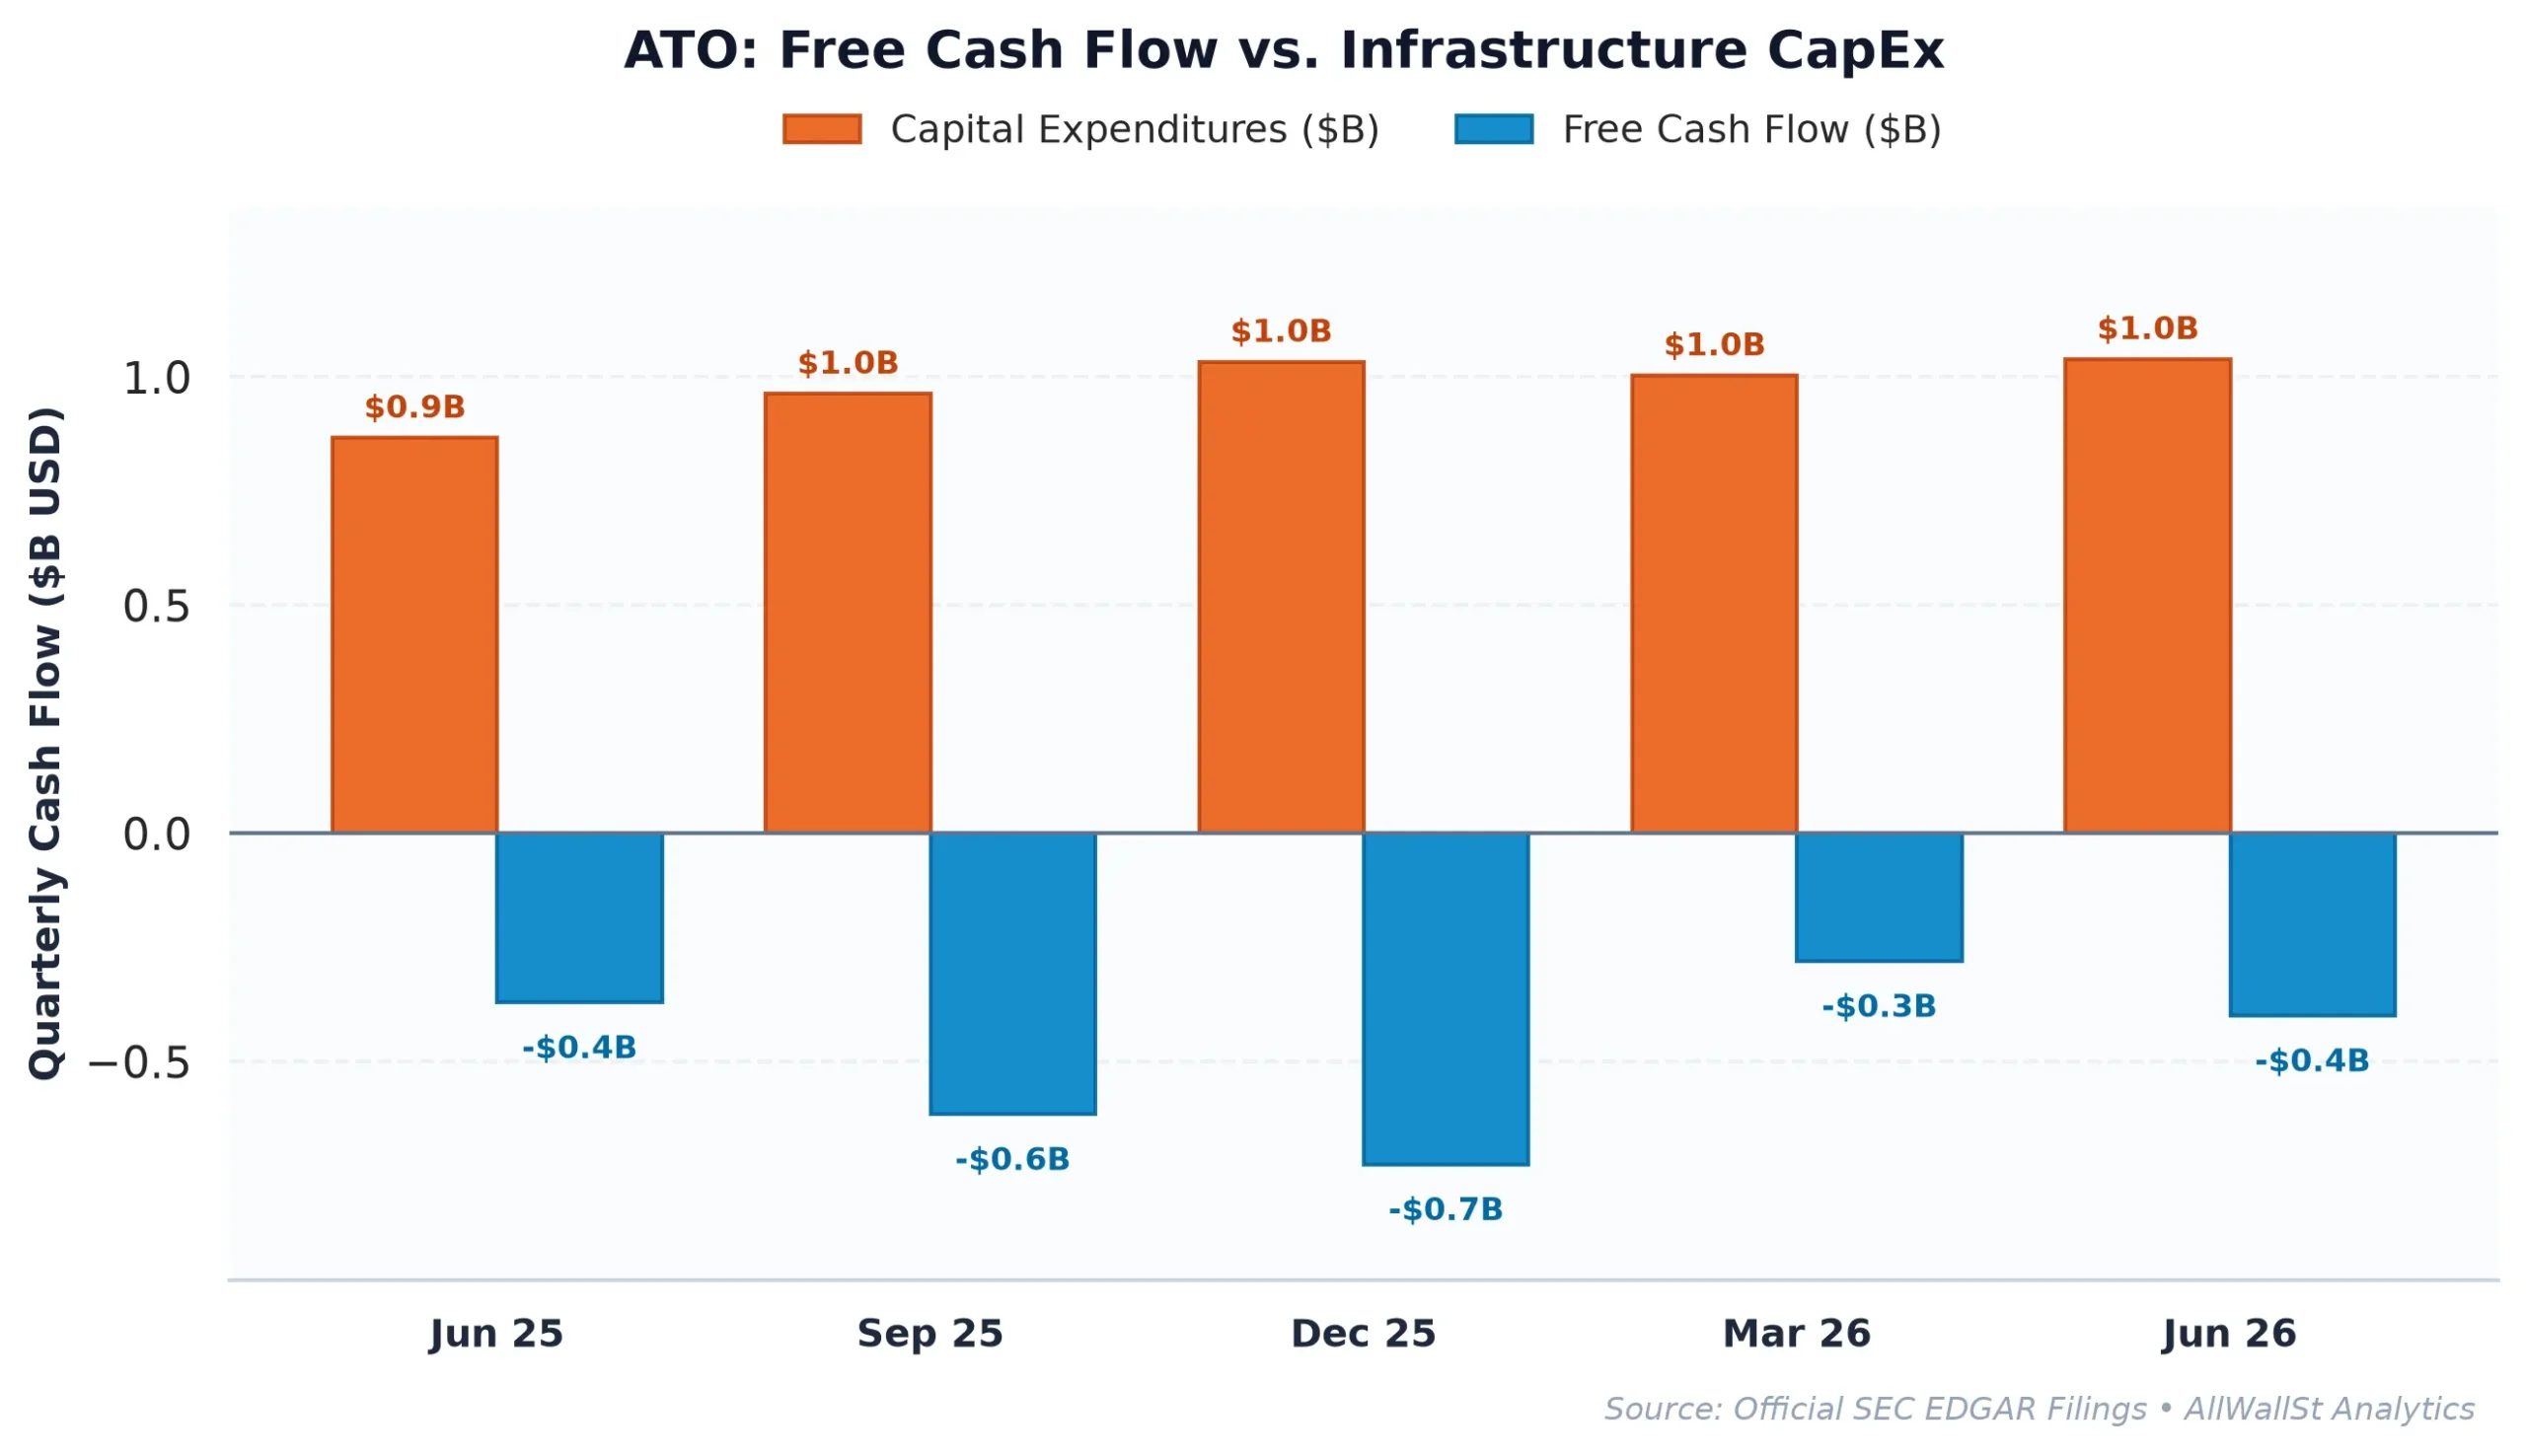
Today, November 17, 2026, Atmos Energy Corporation (ATO) filed a Form 8-K under Item 1.01, detailing an equity distribution arrangement off its automatic shelf registration statement. To a quantitative screener trained on software balance sheets, this looks like an operational problem. The company generates negative $2.22 billion in trailing free cash flow, absorbs an 82% capital expenditure intensity, and periodically issues equity to plug the deficit.
In the peculiar world of regulated gas utilities, however, spending more cash than you take in is not an operational failure. It is the entire business model.
The Rate Base Alchemy
For normal corporations, capital expenditure is cash that walks out the door hoping for future customer demand. For Atmos Energy Corporation, capital expenditure is an asset that state utility commissions formally bless into the rate base.
The mechanism is simple. Regulated utilities earn profits by investing capital in pipeline safety and distribution infrastructure. Regulators then grant an authorized return on equity (here around 9.79% ROE) applied directly to that asset base. When Atmos spends $4.04 billion modernizing underground gas networks across Texas and seven other states, it is not burning money. It is compounding the statutory asset ledger on which next year’s customer bills are legally calculated.
That structural compounding explains why Atmos Energy recently reported its 24th consecutive year of earnings per share growth. The market treats the company’s negative free cash flow yield of -7.65% as a duration risk against a 5.10% 10-Year Treasury yield. But because these infrastructure outlays are sheltered by constructive regulatory rate mechanisms, capital intensity translates directly into reliable dividend and earnings compounding.
| Period | Revenue | Operating Income | Operating Margin | Free Cash Flow | SBC Expense |
|---|---|---|---|---|---|
| FY2022 | $4.20B | $921.0M | 21.9% | $-1.47B | $10.7M |
| FY2023 | $4.28B | $1.07B | 25.0% | $653.8M | $10.2M |
| FY2024 | $4.17B | $1.36B | 32.5% | $-1.20B | $10.7M |
| FY2025 | $4.70B | $1.56B | 33.2% | $-1.51B | $12.7M |
Operational Efficiency Meets Peer Disconnect
Consensus models consistently discount pure-play local gas distribution companies as legacy relics during an era consumed by data center electricity demand. Yet Atmos Energy demonstrates operating discipline that rivals elite industrial monopolies. Its operating margin reached 37.52% on $4.92 billion of trailing revenue, comfortably outpacing diversified peers.
| Company (Ticker) | Market Cap | Forward P/E | EV/EBITDA | Rev Growth (YoY) | Operating Margin | FCF Yield |
|---|---|---|---|---|---|---|
| Atmos Energy (ATO) | $29.1B | 17.6x | 15.1x | 4.80% | 37.52% | -7.65% |
| NextEra Energy (NEE) | $177.1B | 19.3x | 22.4x | 1.6% | 30.0% | -11.98% |
| Constellation Energy (CEG) | $94.3B | 20.0x | 12.7x | 45.4% | 17.9% | -5.70% |
| Southern Company (The) (SO) | $109.0B | 19.0x | 12.7x | 13.0% | 27.4% | -4.67% |
Atmos trades at 17.6x forward earnings, sitting at a noticeable discount to NextEra Energy at 19.3x and Southern Company at 19.0x. While NextEra and Constellation command valuation premiums tied to nuclear power purchase agreements and speculative hyperscaler load, Atmos delivers superior operating margins with clean regulatory compacts and virtually no merchant commodity price risk.
Federal prime contracts across military and civil facilities, totaling millions in obligations, provide an incremental, government-backed baseline of stable gas throughput.
Options Plumbing and Capital Structure
Atmos maintains a balanced balance sheet with net debt to EBITDA of 3.74x, well within the safety parameters required by credit rating agencies for pure regulated distribution assets. Stock-based compensation is immaterial at roughly $10 million annually, meaning reported operational results are not being diluted away by executive grants.
In the derivatives market, trading structure exhibits a clear bullish bias. The Put/Call open interest ratio sits at an unusually low 0.43, reflecting strong institutional call accumulation.
With spot price trading at $171.91, the stock has cleared its primary Call Wall at $170. Option market makers who sold those contracts are forced to hold long underlying shares to remain delta neutral, effectively building a mechanical floor against near-term corrections toward the $165 Max Pain strike. The deterministic 30-day expected move spans $13.08, framing an orderly trading corridor while the broader market digests post-earnings revisions.
Investment Committee Steelman Dissent: Sustained sovereign bond yields at or above 5.10% could compress utility equity multiples across the board while escalating debt refinancing costs across Atmos Energy’s $9.80 billion net debt load. Furthermore, unexpected political pushback against customer rate adjustments could delay rate base compounding and trigger downside toward the $165 put support level.
AllWallSt Investment Verdict: BUY (High-Conviction Compounding Outlier)
Atmos Energy Corporation (ATO)
Trailing P/E
Marcus Wolfe Screen
Leverage Profile
30D Channel
Dealer Gamma Pinning & Max Pain Alignment (ATO)
🎯 Max Pain: $165.00
Spot $171.91
Ceiling $170C Resistance ▲
Pristine cash flow conversion (1.71x) and healthy accrual ratio (-3.01%). Zero accounting anomalies detected (LOW ANOMALY RISK).
Elevated Leverage (3.74x Net Debt/EBITDA); balance sheet requires structural deleveraging.
Negative yield spread (-12.75% vs 5.10% Treasury); equity requires robust multiple expansion or growth.
Max Pain: $165.00 (-4.02%) | P/C Ratio: 0.43 | 30D Channel: $158.83 – $184.99. Dealer gamma bounded between $165 Put Wall and $170 Call Wall.
ATO operates with negligible index gravitational pull. Sell-side ratings reflect pure idiosyncratic fundamental consensus without passive indexing distortion.
$161.70 – $168.30 (Options Support Pinning)
Sustained weekly close below $165.00 (Put Wall) or gross margin compression below 62.21%.
Bearish IC Dissent: At 20.5x trailing earnings and -7.65% FCF yield against a 5.10% 10-year risk-free hurdle, Atmos Energy Corporation (ATO) leaves limited cushion for top-line deceleration or margin compression (3.74x Net Debt/EBITDA). If institutional flows break below the $165 put wall, dealer de-hedging can accelerate multiple contraction before fundamental buyers step in.
Sources & References
- Official SEC Form 10-K Annual Report (Filed 2026-11-16)
- Official SEC Form 10-Q Quarterly Report (Filed 2026-08-05)
- SEC Form 8-K Primary Filing Body (2026-10-09)
- SEC DEF 14A Proxy / M&A Filing (2025-12-19)
- Federal Register (2026-07-13): Pipeline Safety: Guidance for Enhancing the Effectiveness of Distribution Integrity…
- Federal Register (2026-06-24): Combined Notice of Filings
-
USASpending Federal Contract Award ($1.3M, Department of Defense)
-
Atmos Energy Corporation SEC EDGAR Filings (CIK 0000731802): https://www.sec.gov/edgar/browse/?CIK=0000731802
- Atmos Energy Form 8-K Material Definitive Agreement (Filed November 17, 2026): https://www.sec.gov/Archives/edgar/data/731802/000119312526465513/d61170d8k.htm
- Atmos Energy Official Investor Relations: https://www.atmosenergy.com
Regulatory & Editorial Disclaimer: This article is published for institutional research and informational commentary purposes only under financial journalism standards. Nothing contained herein constitutes investment advice, an endorsement, or a solicitation to buy or sell securities. Historical performance, rate-base allowances, and options market dynamics do not guarantee future returns.