
The dream of the disciplined value investor usually involves finding a dominant global titan trading at a single-digit multiple while the rest of the market chases expensive clouds. Alibaba Group Holding Limited (BABA) currently offers exactly that: a forward price-to-earnings ratio of 9.4x, which looks like a clerical error compared to the double-digit multiples commanded by its Western peers.
However, the market is rarely in the business of handing out free lunches, especially when those lunches involve complex geopolitical ingredients. The recent market chatter regarding Nvidia sales teams facilitating introductions for Alibaba prior to US chip export restrictions highlights the desperate scramble for hardware that now defines the company’s operational reality.
When a tech giant is forced to navigate a maze of regulatory hurdles just to maintain its compute capacity, the “value” in the valuation starts to look more like a compensation for structural risk. We are seeing a fundamental shift where the cost of staying relevant in the artificial intelligence race is beginning to cannibalize the very cash flows that once made the company a defensive fortress.
The Vanishing Act of the Free Cash Flow Engine
The most concerning metric in the current Alibaba dossier is not the headline revenue growth, which remains a respectable 8.60%, but the state of its cash generation. In the financial year 2023, the company generated over $24.8B in free cash flow, representing the actual cash left over after paying for all operating expenses and capital investments.
By the fiscal year 2026, that figure has swung violently into negative territory, hitting a deficit of $7.62B. This collapse in free cash flow yield to -3.37% creates a mathematical paradox for institutional holders who are currently being offered a 5.07% yield on the risk-free US 10-Year Treasury.
To justify owning an equity with a negative cash flow yield, an investor must believe that the future growth will be so explosive that it compensates for the immediate loss of income. In an environment where capital expenditure intensity has climbed to 12.15% of revenue, Alibaba is spending heavily just to stand still in a hyper-competitive domestic market.
This spending is further complicated by stock-based compensation, which totaled $1.68B recently. While this is a non-cash accounting expense, it represents real dilution for shareholders: a process where the company issues new shares to employees, effectively shrinking the slice of the pie owned by everyone else.
The Valuation Gap and the Peer Pressure
When we place Alibaba alongside its global counterparts, the valuation gap appears wide enough to drive a logistics truck through. The following table illustrates the stark contrast between the Chinese e-commerce giant and the dominant retail forces in the West.
| Company (Ticker) | Market Cap | Forward P/E | EV/EBITDA | Rev Growth (YoY) | Operating Margin | FCF Yield |
|---|---|---|---|---|---|---|
| Alibaba Group Holding (BABA) | $216.0B | 9.4x | 13.2x | 8.60% | 4.56% | -3.37% |
| Walmart (WMT) | $1.01T | 39.2x | 24.5x | 5.9% | 3.9% | 0.71% |
| Costco Wholesale (COST) | $490.4B | 44.2x | 33.9x | 11.1% | 3.8% | 1.38% |
| Amazon.com (AMZN) | $2.86T | 24.2x | 16.2x | 12.1% | 13.1% | -1.22% |
Amazon, the most direct functional peer, trades at more than double the forward earnings multiple of Alibaba despite its own struggles with capital intensity. The market is effectively applying a massive “geopolitical tax” to Alibaba, recognizing that a dollar of earnings in Hangzhou is not valued the same as a dollar of earnings in Seattle.
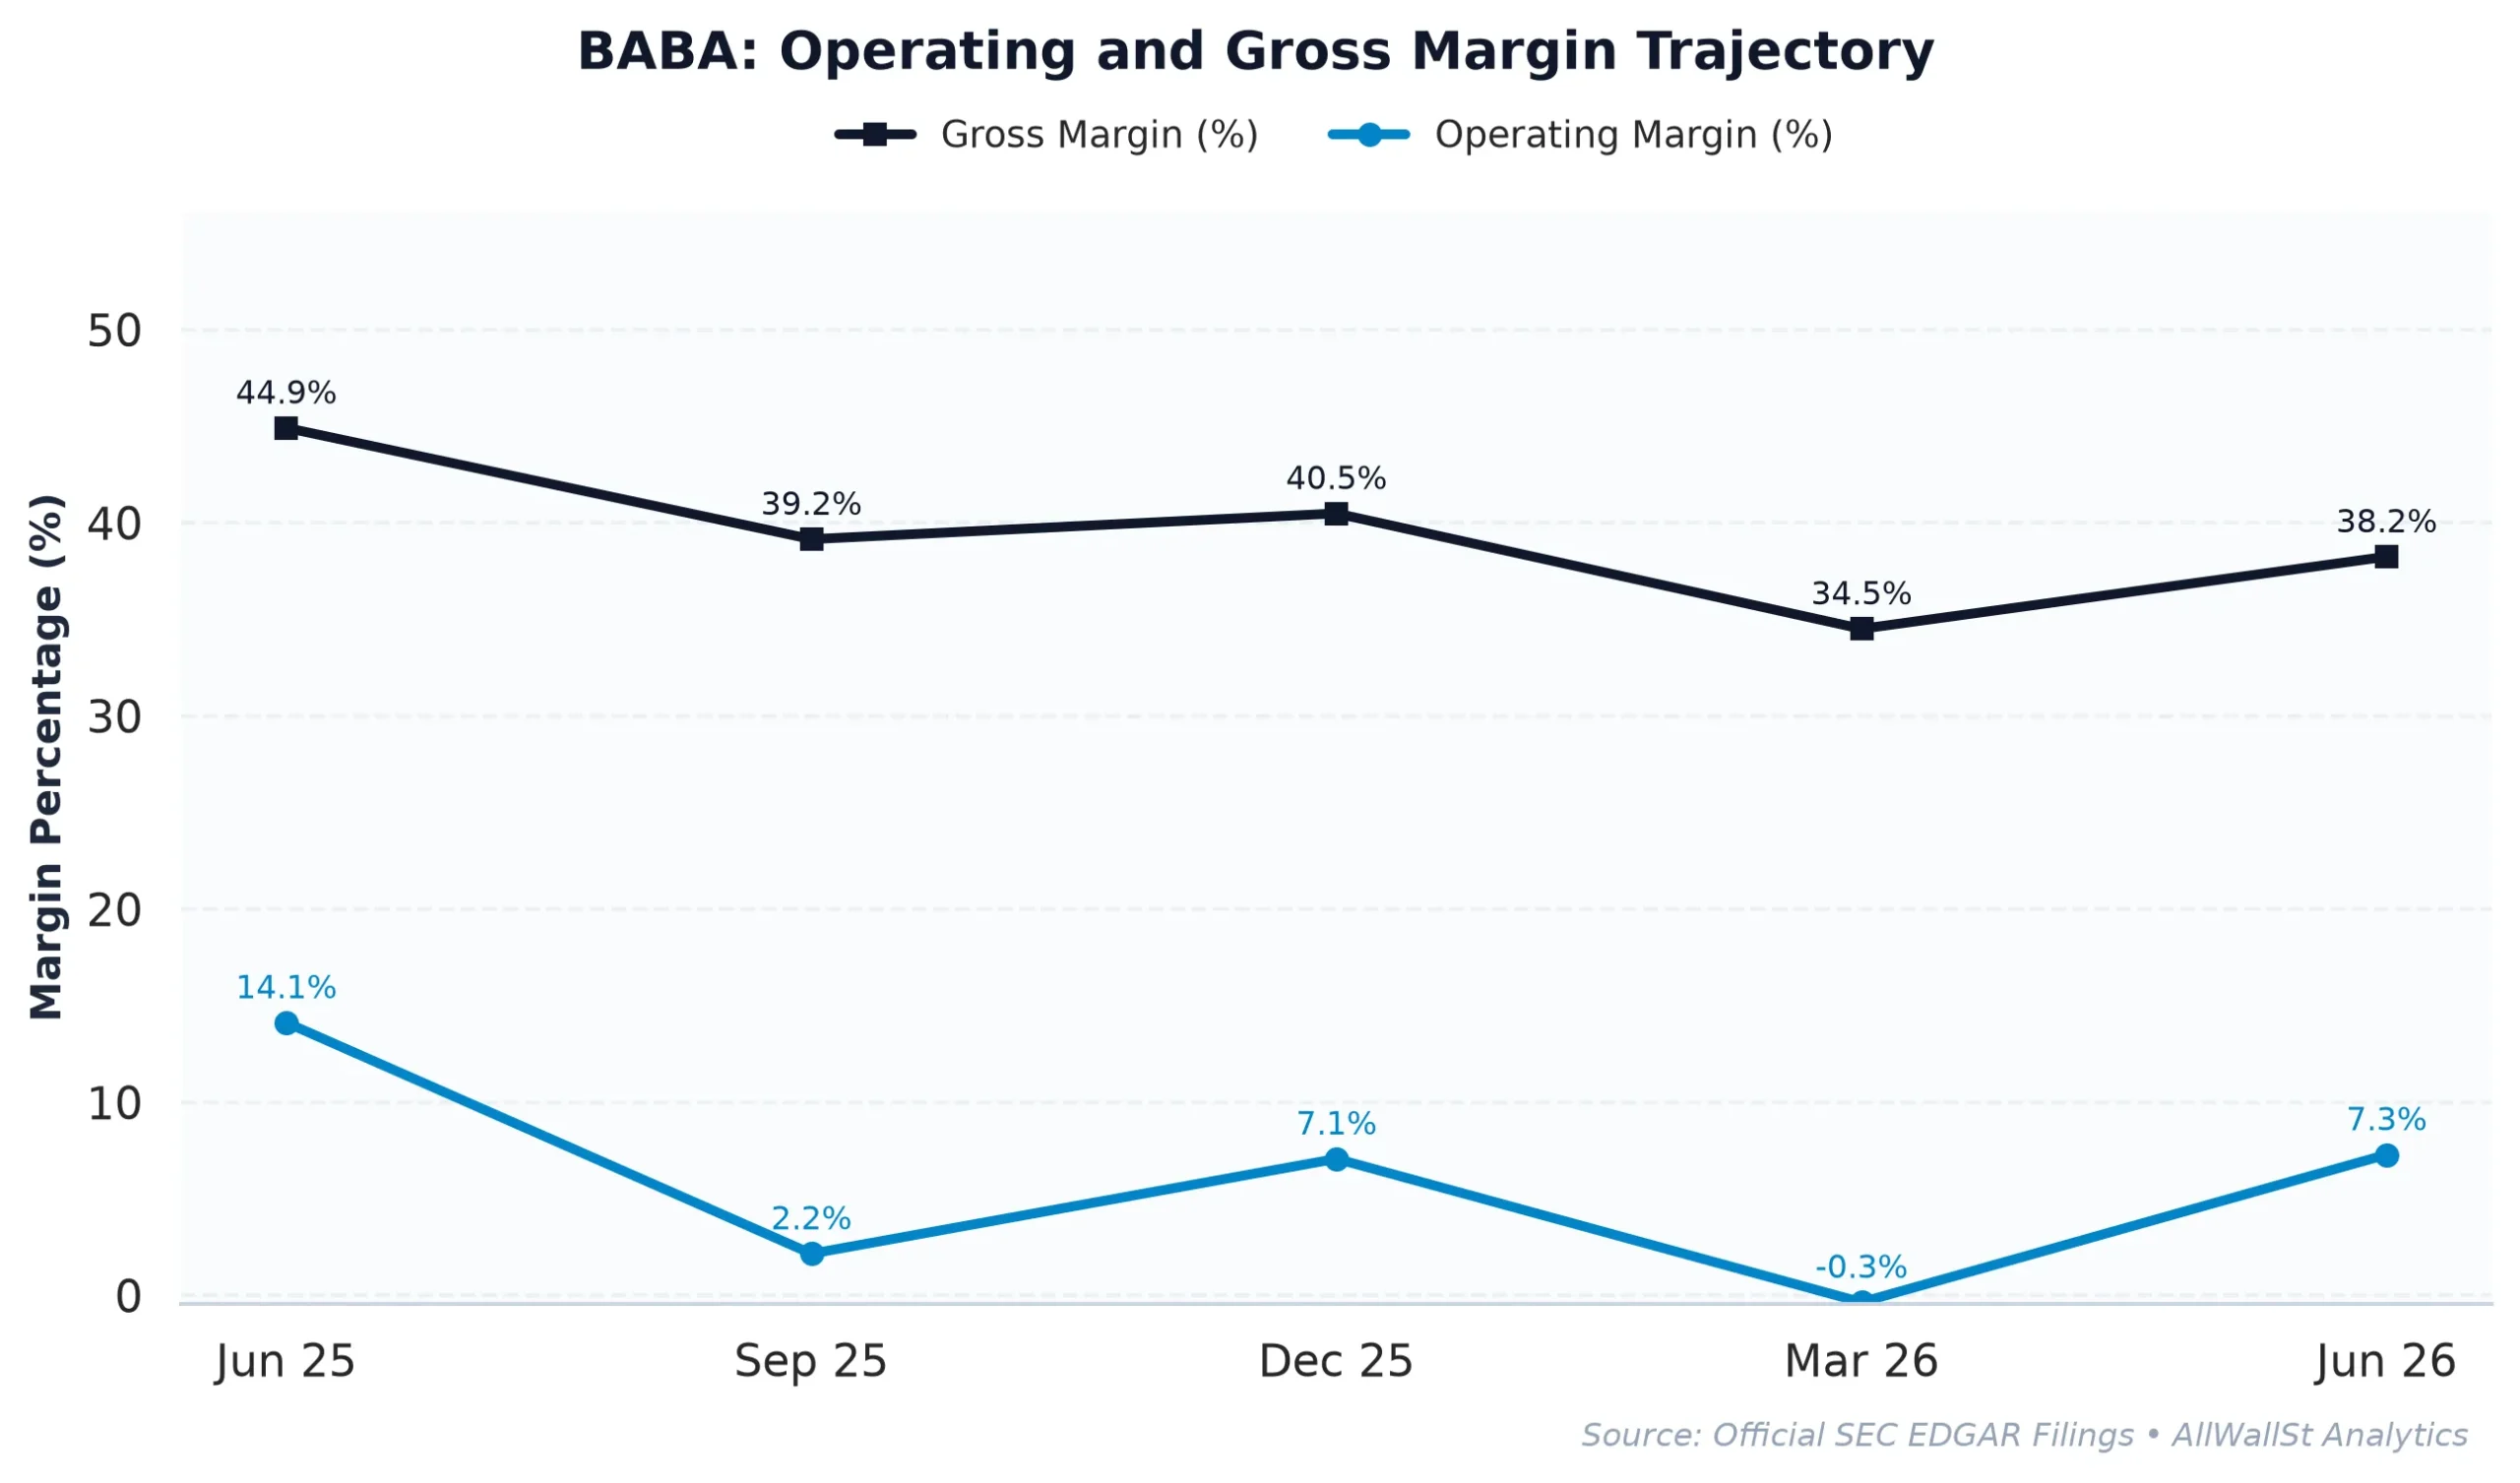
Alibaba’s operating margin has compressed significantly, falling from 14.8% in FY2025 to just 4.56% in the most recent reporting period. This margin erosion suggests that the company is losing its pricing power as it fends off aggressive low-cost competitors like PDD Holdings, the parent of Temu and Pinduoduo.
While the net cash position of $17.90B provides a comfortable cushion against bankruptcy, it does little to drive the stock price higher if the underlying business units are becoming less efficient. The return on invested capital (ROIC) of 3.99% is currently trailing the company’s estimated cost of capital, meaning the business is technically destroying value with every new dollar it reinvests.
The Options Magnet and the Speculative Overhang
The options market for Alibaba currently reflects a high degree of speculative optimism that may be disconnected from these fundamental headwinds. The Put/Call Open Interest ratio sits at a very low 0.35, indicating that for every one defensive put option, there are nearly three speculative call options betting on a price increase.
This heavy concentration of calls creates a specific type of market plumbing risk. When investors buy calls, market makers (the institutions that sell them) must hedge their exposure by buying the underlying stock. If the stock price fails to move higher, those calls lose value through time decay, forcing market makers to sell their hedges and creating a mechanical drag on the stock price.
The Max Pain strike, the price point where the most options contracts expire worthless, is currently situated at $100.00. While this acts as a magnetic target for bulls, it is currently 15.14% above the spot price, a distance that would require a significant catalyst to bridge.
Primary support, or the “Put Wall,” is firmly established at $85.00. This strike price represents a level where dealers are likely to step in and buy the stock to manage their own risk, providing a structural floor for the share price in the near term.
The implied volatility of 52.95% suggests the market is pricing in a 30-day expected move of roughly $13.18 in either direction. This level of volatility is unusually high for a company with a beta of 0.40, which normally implies the stock should move much less than the broader market. This discrepancy suggests that traders are bracing for a sharp, news-driven event rather than a slow fundamental grind.
Investment Committee Steelman Dissent: The bull case rests on the potential for a massive Chinese stimulus package to reignite domestic consumption, which could rapidly expand Alibaba’s margins and restore its free cash flow. Furthermore, if US-China trade tensions thaw unexpectedly, the geopolitical discount could evaporate, leading to a violent re-rating of the stock toward its historical 18x P/E mean.
AllWallSt Investment Verdict: HOLD
Alibaba Group Holding Limited (BABA)
Trailing P/E
Marcus Wolfe Screen
Leverage Profile
30D Channel
Dealer Gamma Pinning & Max Pain Alignment (BABA)
🎯 Max Pain: $100.00
Spot $86.81
Ceiling $110C Resistance ▲
MODERATE WATCHLIST (1 flag): Receivables growth outstripped revenue growth by >15%, pointing to potential revenue recognition or collection friction.
Fortress Balance Sheet (Net Cash Position; zero net refinancing distress).
Negative yield spread (-8.44% vs 5.07% Treasury); equity requires robust multiple expansion or growth.
Max Pain: $100.00 (+15.14%) | P/C Ratio: 0.35 | 30D Channel: $73.63 – $99.99. Dealer gamma bounded between $85 Put Wall and $110 Call Wall.
BABA carries standard index weighting (< 0.6% SPY footprint); sell-side consensus reflects standard earnings momentum rather than index-tracking mandates.
Accumulation Deferred (Await Pullback toward $83.30 – $86.70 Support Pinning)
Sustained weekly close below $85.00 (Put Wall) or acceleration in margin compression.
IC Counter-Thesis: While our neutral stance balances 21.0x trailing earnings and -3.37% FCF yield against a 5.07% 10-year yield hurdle, a decisive breakout above $110 on accelerating earnings revisions could leave sidelined capital underexposed. Conversely, a breach of $85 would confirm that valuation support is illusory alongside 1 flagged accrual anomalies.
Sources & References
- Official SEC Form 20-F Annual Report (Filed 2026-05-20)
- Official SEC Form 6-K Quarterly Report (Filed 2026-11-10)
- SEC SCHEDULE 13D/A Beneficial Ownership Disclosure (2026-09-22)
- Alibaba Group Holding Ltd SEC EDGAR Filings: https://www.sec.gov/edgar/browse/?CIK=0001577552
- Alibaba Investor Relations: https://www.alibabagroup.com/en-US/ir-home
- Federal Register (Chinese Military Company Designations): https://www.federalregister.gov/documents/2026/06/10/2026-11571/notice-of-availability-of-designation-of-chinese-military-companies
Disclaimer: This report is for informational purposes only and does not constitute financial, legal, or investment advice. The analysis is based on publicly available data as of November 18, 2026. Investing in equities, particularly international ADRs, involves significant risk including the potential loss of principal. AllWallSt and its analysts maintain no positions in the securities mentioned at the time of publication.