
If you are a healthcare company in 2026, you really want to be an AI company. It adds a certain luster to the balance sheet that simple blood tests or diagnostic reports just cannot provide. Tempus AI, Inc. (TEM) has mastered this nomenclature, positioning itself as the bridge between the messy reality of oncology wards and the clean, high-multiple world of multimodal data.
Today, Wednesday, November 18, 2026, the company filed an SEC Form 8-K regarding a material definitive agreement. While the filing confirms the continuation of its operational momentum, it also highlights the central tension in the Tempus story: the business is growing its footprint in the lab, but it is still struggling to find the exit door from its own cash burn.
The market currently values Tempus AI at approximately $11.4 billion, a figure that reflects a massive premium for its “data-as-a-service” potential. However, the fundamental reality is that the company is currently a Health Information Services provider with a -1.32% free cash flow yield and a stock price of $62.37 that seems to be pricing in a level of profitability that the income statement has yet to encounter.
The Revenue Recognition and Collection Friction
The bull case for Tempus AI rests on the idea that every diagnostic test they run creates a permanent, valuable data asset that can be licensed to pharmaceutical giants. This is a beautiful narrative, but the accounting suggests some friction in the plumbing. Our forensic desk flagged an elevated concern: accounts receivable (AR) growth is currently outstripping revenue growth by more than 15%.
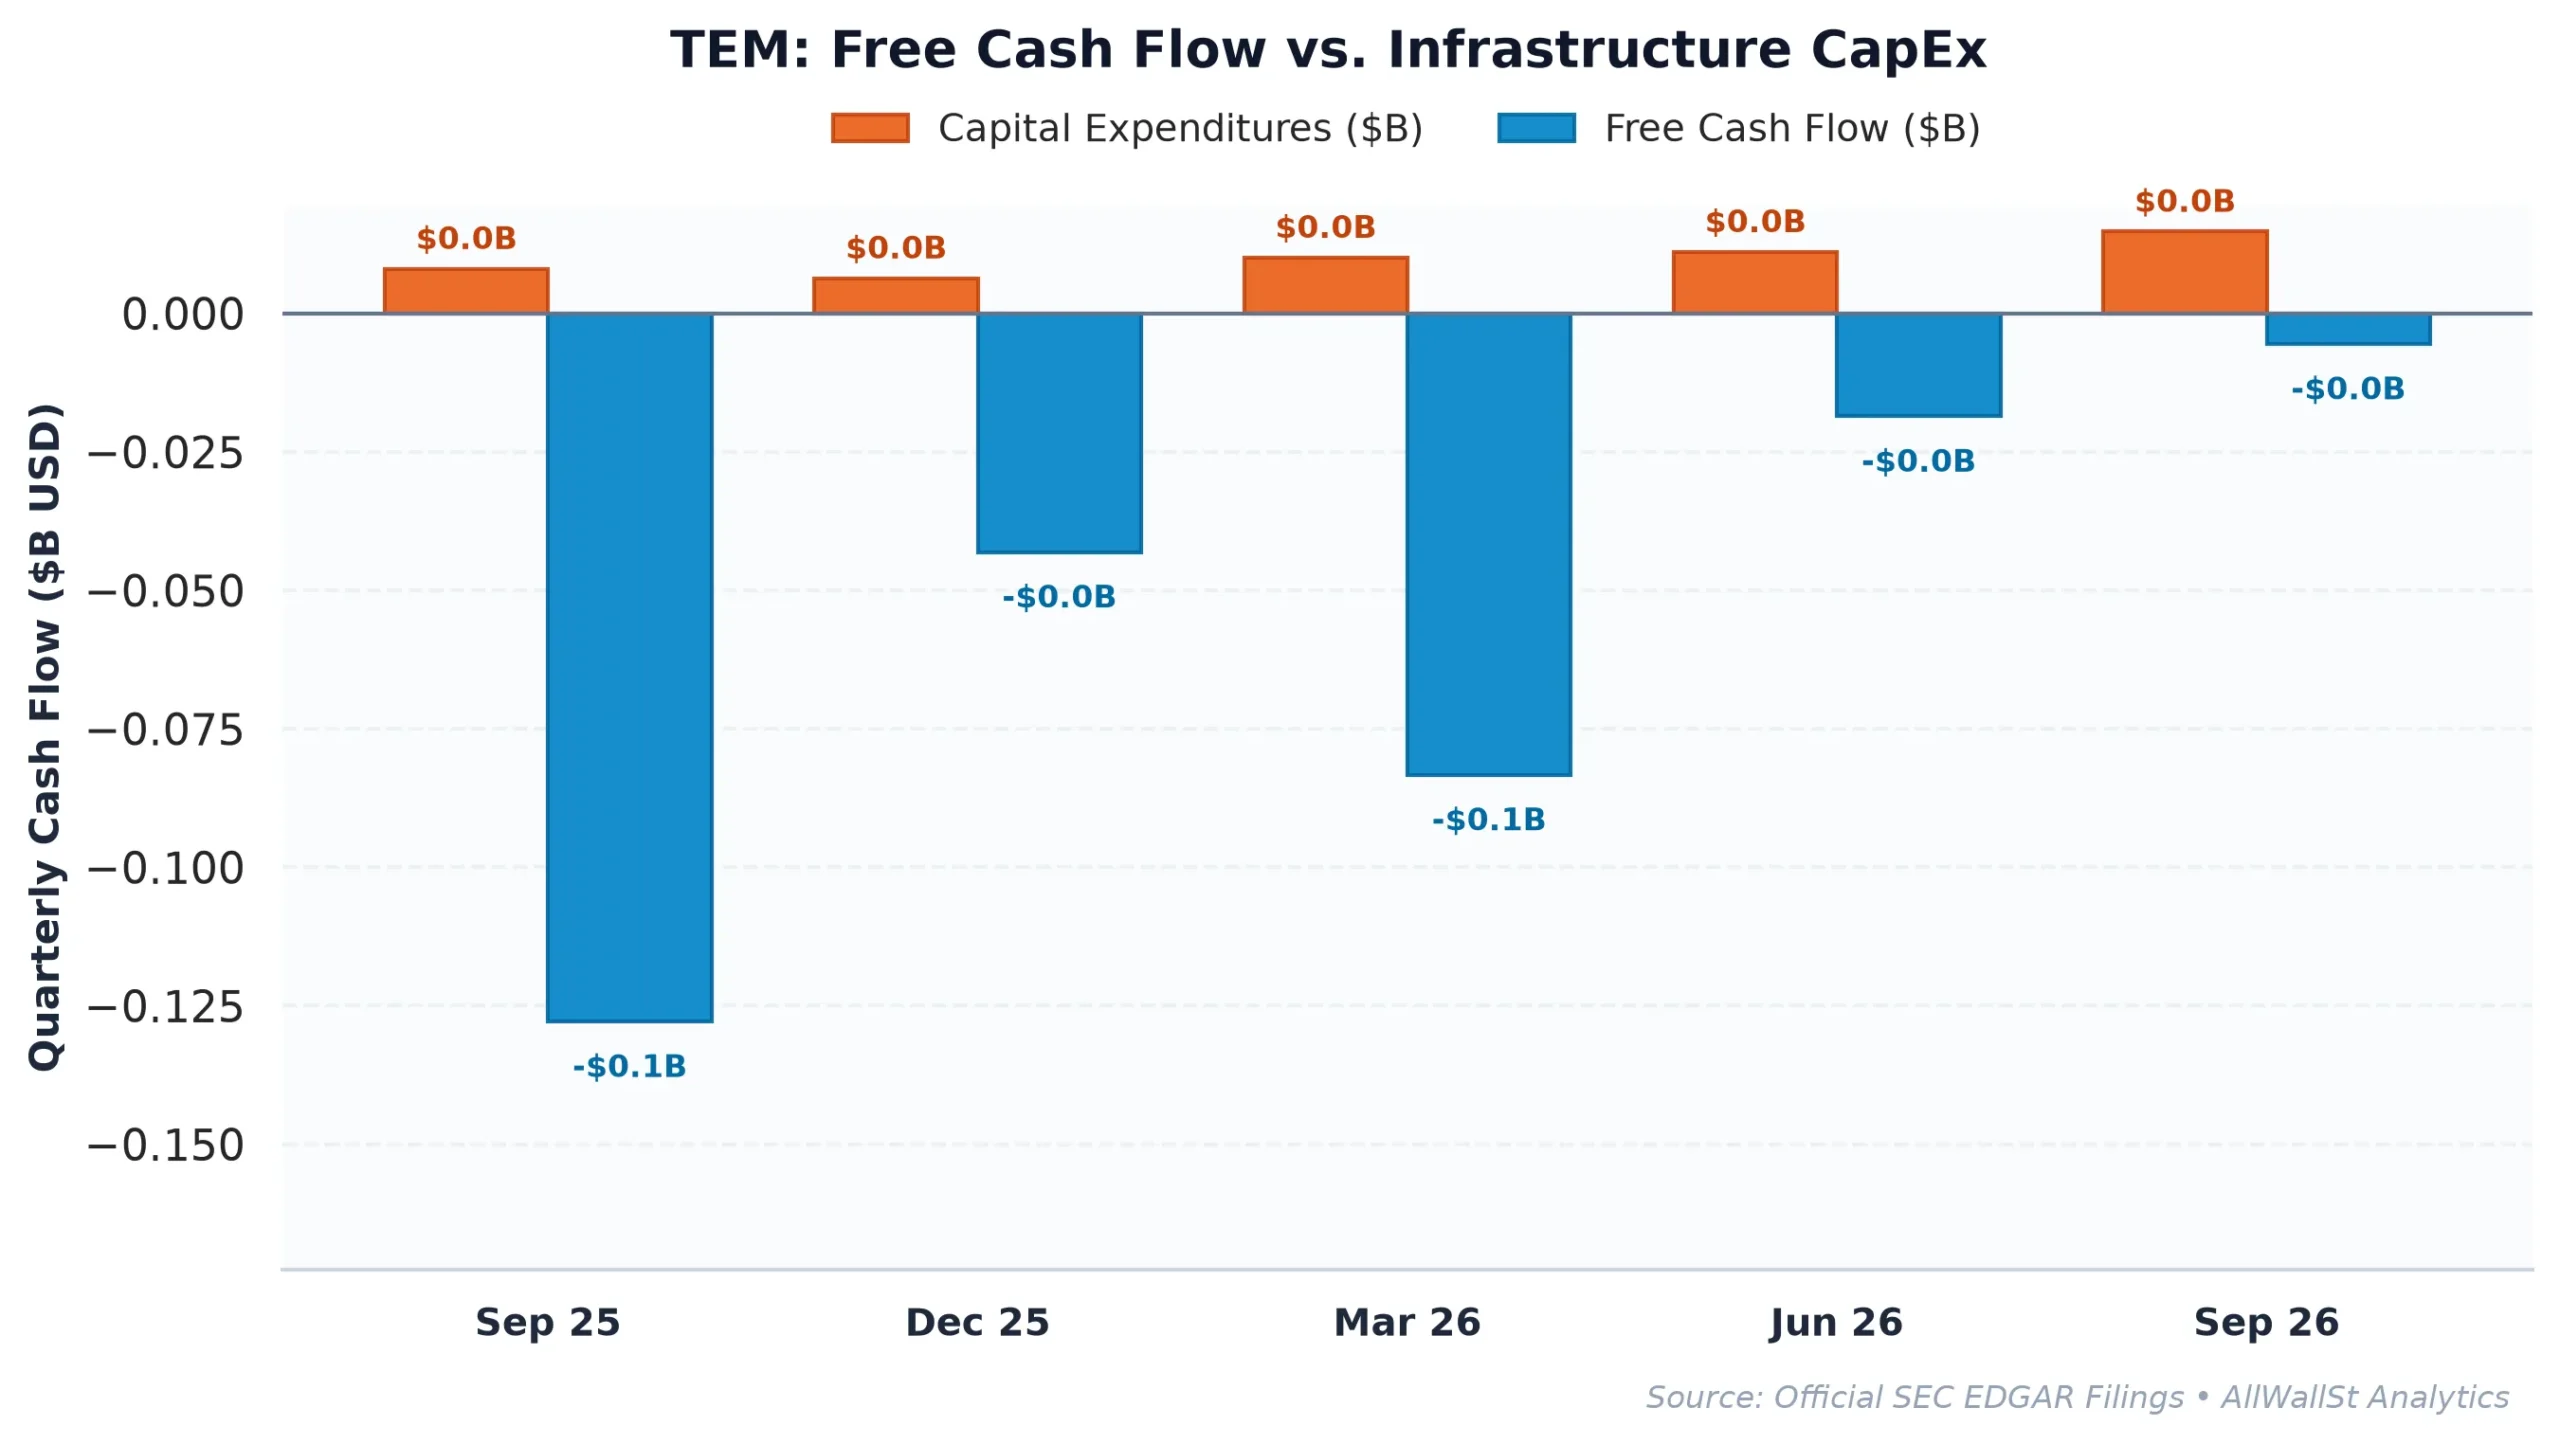
In plain English, this means the company is booking sales faster than it is collecting actual cash from its customers. When receivables bloat while operating cash flow remains negative, it often signals that the “high-margin” data licensing revenue might be subject to longer payment terms or more complex collection hurdles than the market realizes.
The company reported $411.5 million in revenue for the third quarter of 2026, which is an impressive headline number. CEO Eric Lefkofsky noted that the results reinforce the “durability of our model.” Yet, the company is still reporting a GAAP net loss, and the real free cash flow, when you strip out the $120 million in stock-based compensation, is a negative $280 million.
Capital Intensity and the AI Premium Gap
Tempus AI is currently trading at a Price-to-Book (P/B) ratio of 22.69x. To put that in perspective, many traditional healthcare service providers trade at single-digit multiples of book value. Investors are paying this premium because they believe Tempus is a software-style compounder rather than a capital-intensive laboratory business.
However, the historical trajectory shows that growth is expensive. In FY2024, the company saw an operating margin of -99.7%, which improved to -19.9% by FY2025. While the direction is correct, the absolute levels are still a long way from the “Rule of 40” benchmark that institutional investors use to identify healthy growth companies. Tempus currently scores a 13.1% on this metric, well below the 25% hurdle usually required to justify such an aggressive valuation.
| Company (Ticker) | Market Cap | Forward P/E | EV/EBITDA | Rev Growth (YoY) | Operating Margin | FCF Yield |
|---|---|---|---|---|---|---|
| Tempus AI (TEM) | $11.4B | N/A | N/A | 23.10% | -18.47% | -1.32% |
| Eli Lilly and Company (LLY) | $1.24T | 27.3x | 28.1x | 38.6% | 51.3% | 0.76% |
| UnitedHealth Group (UNH) | $321.8B | 15.4x | 13.9x | -0.4% | 5.9% | 8.24% |
| Johnson & Johnson (JNJ) | $665.8B | 23.8x | 26.6% | 5.9% | 26.6% | 2.78% |
When we look at the peer group, the valuation gap becomes even more stark. Eli Lilly (LLY) is growing revenue at nearly 39% with a 51.3% operating margin, yet Tempus AI commands a higher premium on several forward-looking growth metrics despite its negative margins. The market is treating Tempus as an unconstrained AI play, but its business model still requires physical lab throughput and significant research and development spend.
Options Structure and the Gravity of Max Pain
The options market is currently signaling a state of relative balance, but with a notable magnetic pull toward lower prices. The Put/Call open interest ratio stands at 1.06, suggesting that institutional hedgers are reasonably well-protected. However, the Max Pain strike sits at $70.00, which is about 12% above the current spot price of $62.37.
Max Pain is the price level where the largest number of options contracts expire worthless, often acting as a magnet for the stock as market makers hedge their positions. While this might suggest some upside potential into expiration, the primary call resistance (or “Call Wall“) at $80.00 represents a formidable ceiling. Dealers are incentivized to sell into rallies toward that level to maintain their delta-neutral hedges.
With an implied volatility of 81.71%, the market expects a massive 23.43% move in either direction over the next 30 days. For a company with $0.79 billion in net debt and a -37.55% return on equity, that volatility is a double-edged sword. If the market begins to sour on the “AI healthcare” narrative, the lack of fundamental valuation support could lead to a rapid re-pricing.
The Institutional Verdict
The core issue with Tempus AI is not that its technology is failing, but that its valuation has outpaced its economic reality. The company is successfully signing material agreements and growing its oncology unit by 32%, but it is doing so while burning through cash and relying heavily on stock-based compensation to keep the reported figures palatable.
The divergence between revenue growth and accounts receivable is a specific red flag that institutional investors should not ignore. It suggests that the quality of earnings is deteriorating just as the stock price is reaching for the stars. In an environment where the 10-Year Treasury yield is hovering around 5.07%, a company with a negative real free cash flow yield of -2.42% (after adjusting for SBC) is a difficult asset to hold.
Investment Committee Steelman Dissent: The strongest bull case for Tempus AI is that its multimodal data library is becoming an essential infrastructure for the next generation of personalized oncology, making it a prime acquisition target for a legacy pharmaceutical giant like Eli Lilly or Johnson & Johnson. If a suitor decides that the data library is worth more than the current cash-burning operations, a sudden M&A premium could override our fundamental sell thesis.
AllWallSt Investment Verdict: SELL (Initiation)
Tempus AI, Inc. (TEM)
Trailing P/E
Marcus Wolfe Screen
Leverage Profile
30D Channel
Dealer Gamma Pinning & Max Pain Alignment (TEM)
🎯 Max Pain: $70.00
Spot $62.37
Ceiling $80C Resistance ▲
ELEVATED CONCERN (2 flags): Operating cash flow is negative (-218,090,000) alongside GAAP net loss, signaling active cash burn. Receivables growth outstripped revenue growth by >15%, pointing to potential revenue recognition or collection friction.
Manageable liability structure relative to institutional cash flow.
Negative yield spread (-6.39% vs 5.07% Treasury); equity requires robust multiple expansion or growth.
Max Pain: $70.00 (+12.15%) | P/C Ratio: 1.06 | 30D Channel: $47.75 – $76.99. Dealer gamma bounded between $50 Put Wall and $80 Call Wall.
TEM operates with negligible index gravitational pull. Sell-side ratings reflect pure idiosyncratic fundamental consensus without passive indexing distortion.
$78.40 – $81.60 (Call Wall Resistance Distribution Ceiling)
Sustained weekly close above $80.00 (Call Wall Resistance) or structural rebound in GAAP Free Cash Flow.
Bullish IC Dissent: Despite current valuation multiples and -1.32% FCF yield alongside 2 flagged accrual anomalies, Tempus AI, Inc. (TEM) could stage a sharp short-covering squeeze if management surprises with cost discipline, buyback acceleration, or stabilizing guidance above the $80 call wall. Consensus pessimism already prices in significant deterioration, creating asymmetric upside risk if credit spreads remain contained.
Sources & References
- Official SEC Form 10-K Annual Report (Filed 2026-02-24)
- Official SEC Form 10-Q Quarterly Report (Filed 2026-11-02)
- SEC Form 8-K Exhibit 99.1 (Press Release / Earnings) (2026-11-02)
- SEC SCHEDULE 13D/A Beneficial Ownership Disclosure (2026-07-21)
- SEC S-4/A Proxy / M&A Filing (2026-10-20)
- USASpending Federal Contract Award ($24.2M, Department of Health and Human Services)
- ClinicalTrials.gov NCT07154823 (RECRUITING)
- SEC EDGAR: Tempus AI, Inc. (CIK: 0001717115) https://www.sec.gov/edgar/browse/?CIK=0001717115
- Tempus AI Investor Relations: https://www.tempus.com
- SEC Form 8-K (Filed November 18, 2026): https://www.sec.gov/Archives/edgar/data/1717115/000119312526466240/d138111d8k.htm
Disclaimer: AllWallSt provides financial analysis and reporting for informational purposes only. This report does not constitute investment advice, a recommendation, or an offer of any security. Investing involves significant risk, and past performance is not indicative of future results. Consult with a qualified financial advisor before making any investment decisions.