
⚡ Executive Morning Takeaways
- Anthropic Debut Ignites Futures: Equity markets are opening with significant momentum (NQ+2.32%) as the Nasdaq prepares for the Anthropic IPO, providing a high-beta tailwind that is currently masking a mixed earnings bag from global retail giants.
- Discretionary Rotation Accelerates: Institutional capital is flowing aggressively into Consumer Discretionary (XLY, +1.79%) while abandoning Energy (XLE, -3.27%), suggesting a tactical shift toward growth-oriented domestic spenders despite the 5.07% Treasury hurdle.
- Alibaba Facing AI Efficiency Hurdles: While Alibaba Group Holding Limited (BABA) reported a massive 53% jump in AI cloud revenue, the underlying earnings miss and a -1.60% pre-market slide highlight the capital intensity required to maintain its lead in the Chinese hyperscaler race.
🌐 Pre-Market Macro, Futures & Rates Dashboard
| Asset / Benchmark | Ticker | Current Price / Level | Change (%) | 52-Week Low | 52-Week High |
|---|---|---|---|---|---|
| E-Mini S&S 500 Futures (ES=F) | ES=F | $7436.25 | +1.30% | $6353.25 | $7897.50 |
| E-Mini Nasdaq 100 Futures (NQ=F) | NQ=F | $27816.50 | +2.32% | $22961.50 | $31616.50 |
| S&P 500 (SPY) | SPY | $730.20 | -0.31% | $629.28 | $781.62 |
| Nasdaq 100 (QQQ) | QQQ | $659.51 | +0.39% | $555.60 | $762.86 |
| Russell 2000 (IWM) | IWM | $270.12 | +0.40% | $228.90 | $305.18 |
| 20+ Year Treasury (TLT) | TLT | $80.22 | +0.84% | $76.43 | $90.86 |
| High Yield Corporate (HYG) | HYG | $76.65 | +0.03% | $76.39 | $81.24 |
| Gold (GLD) | GLD | $341.19 | -3.20% | $340.76 | $509.70 |
| WTI Crude Oil (CL=F) | CL=F | $82.07/bbl | -0.29% | $54.98 | $119.48 |
| US Dollar Index Bullish (UUP) | UUP | $29.62 | +0.27% | $26.40 | $29.64 |
| CBOE Volatility Index (^VIX) | ^VIX | 21.96 | -10.59% | 13.38 | 35.30 |
| 2-Yr US Treasury Yield (2YY=F) | 2YY=F | 4.75% | +0.00% | 3.38% | 4.88% |
| 10-Yr US Treasury Yield (^TNX) | ^TNX | 5.07% | -0.73% | 3.96% | 5.36% |
Risk appetite is returning to the front-end of the curve this morning as the VIX retreats by over 10% to 21.96, signaling that the recent volatility spike is being digested. The 10-Year Treasury yield remains anchored at 5.07%, which continues to act as a formidable gravity well for equity valuations. When the risk-free rate sits above 5%, the equity risk premium (the extra return you get for taking stock market risk) becomes razor-thin, especially for international names carrying geopolitical baggage.
Commodities are providing a disinflationary signal with Gold (GLD) dropping 3.20% and Crude Oil (CL=F) remaining soft at $82.07. This retreat in “hard assets” suggests that the market is prioritizing liquidity and growth over inflation hedging. For multinational retailers, this is a double-edged sword: lower input costs are helpful, but the surging US Dollar Index (UUP) at $29.62 creates a headwind for translated international earnings.
📊 Sector Rotation Leaders & Laggards
| Rotation Rank | Sector ETF | Ticker | Price | Change (%) | Trailing P/E | Dividend Yield | 52-Week Low | 52-Week High |
|---|---|---|---|---|---|---|---|---|
| Leader (#1) | Consumer Discretionary (XLY) | XLY | $119.20 | +1.79% | 24.9x | 0.81% | $105.19 | $125.01 |
| Leader (#2) | Technology (XLK) | XLK | $163.81 | +0.34% | 28.9x | 0.47% | $126.68 | $203.25 |
| Leader (#3) | Communication Services (XLC) | XLC | $105.58 | +0.30% | 16.8x | 1.38% | $99.33 | $120.41 |
| Laggard (#8) | Financials (XLF) | XLF | $56.42 | -1.14% | 15.2x | 1.46% | $47.67 | $60.04 |
| Laggard (#9) | Healthcare (XLV) | XLV | $181.17 | -2.20% | 29.5x | 1.38% | $141.97 | $192.32 |
| Laggard (#10) | Energy (XLE) | XLE | $61.29 | -3.27% | 15.3x | 2.18% | $43.77 | $70.15 |
The leaderboard reflects a clear “risk-on” appetite as we head toward the holiday season, with Consumer Discretionary (XLY) leading the charge at a 24.9x trailing multiple. Institutional desks appear to be front-running a potential “wealth effect” rally, moving capital out of defensive Energy and Healthcare sectors which have become laggards. Energy (XLE) is particularly weak, falling over 3% as oil prices fail to find a floor, making its 15.3x multiple look less like a bargain and more like a value trap.
The valuation dispersion between Technology (XLK) at 28.9x and Communication Services (XLC) at 16.8x is notable. While both are leaders today, XLC offers a significantly higher dividend yield and a more attractive entry point for investors wary of the high-multiple tech trade. This rotation suggests that while the market wants growth, it is beginning to scrutinize the price it pays for every dollar of earnings.
⏱️ Today’s Earnings & Economic Radar
Imminent Corporate Earnings Releases
| Company / Ticker | Timing | Consensus EPS | Consensus Revenue | Key Strategic Theme |
|---|---|---|---|---|
| Alibaba Group (BABA) | Today (Nov 19) | $15.01 | $308.86B | Cloud Intelligence AI Compute Demand & Domestic E-Commerce GMV |
| Walmart (WMT) | Today (Nov 19) | $0.64 | $187.25B | Grocery Market Share Gains & Walmart Connect Ad Margin |
| Target (TGT) | Yesterday (Reported) | $2.69 | $32.07B | Discretionary Apparel/Home Basket Size & Inventory Shrink |
| Home Depot (HD) | Nov 17 (Reported) | $2.77 | $39.12B | Pro-Contractor Backlog vs High-Rate Big-Ticket Remodeling |
| NVIDIA (NVDA) | Nov 17 (Reported) | $2.88 | $130.81B | Blackwell/Rubin Rack Shipments & Hyperscaler Gross Margin |
High-Impact Economic Data & Central Bank Actions
| Time (ET) | Event | Impact | Key Institutional Focus |
|---|---|---|---|
| 08:30 AM | Initial Jobless Claims | HIGH | White-Collar Continuing Claims Trend |
| 08:30 AM | Philadelphia Fed Manufacturing | HIGH | Mid-Atlantic New Orders & CapEx Plans |
| 10:30 AM | EIA Natural Gas Storage | MEDIUM | Power Grid & LNG Export Baseload |
Institutional desks are hyper-focused on the 08:30 AM Jobless Claims print. Any sign of a tick upward in continuing claims would likely fuel the “bad news is good news” narrative, potentially capping the 10-Year yield and giving growth stocks more room to run.
🎯 Pre-Market Spotlight: Alibaba Group Holding Limited (BABA)
Alibaba Group Holding Limited (BABA) is currently the poster child for the “cheap for a reason” investment thesis. The company reported a 53% surge in AI cloud revenue this morning, yet the stock is trading down 1.60% in the pre-market at $83.00. The fundamental tension here is palpable: Alibaba is successfully pivoting to AI, but it is doing so at the expense of the consolidated bottom line. Operating margins have compressed to 4.56%, a far cry from the double-digit levels seen just two years ago. For a business with a $209.9B market cap, the inability to convert revenue growth into consistent free cash flow is a growing concern for institutional holders.
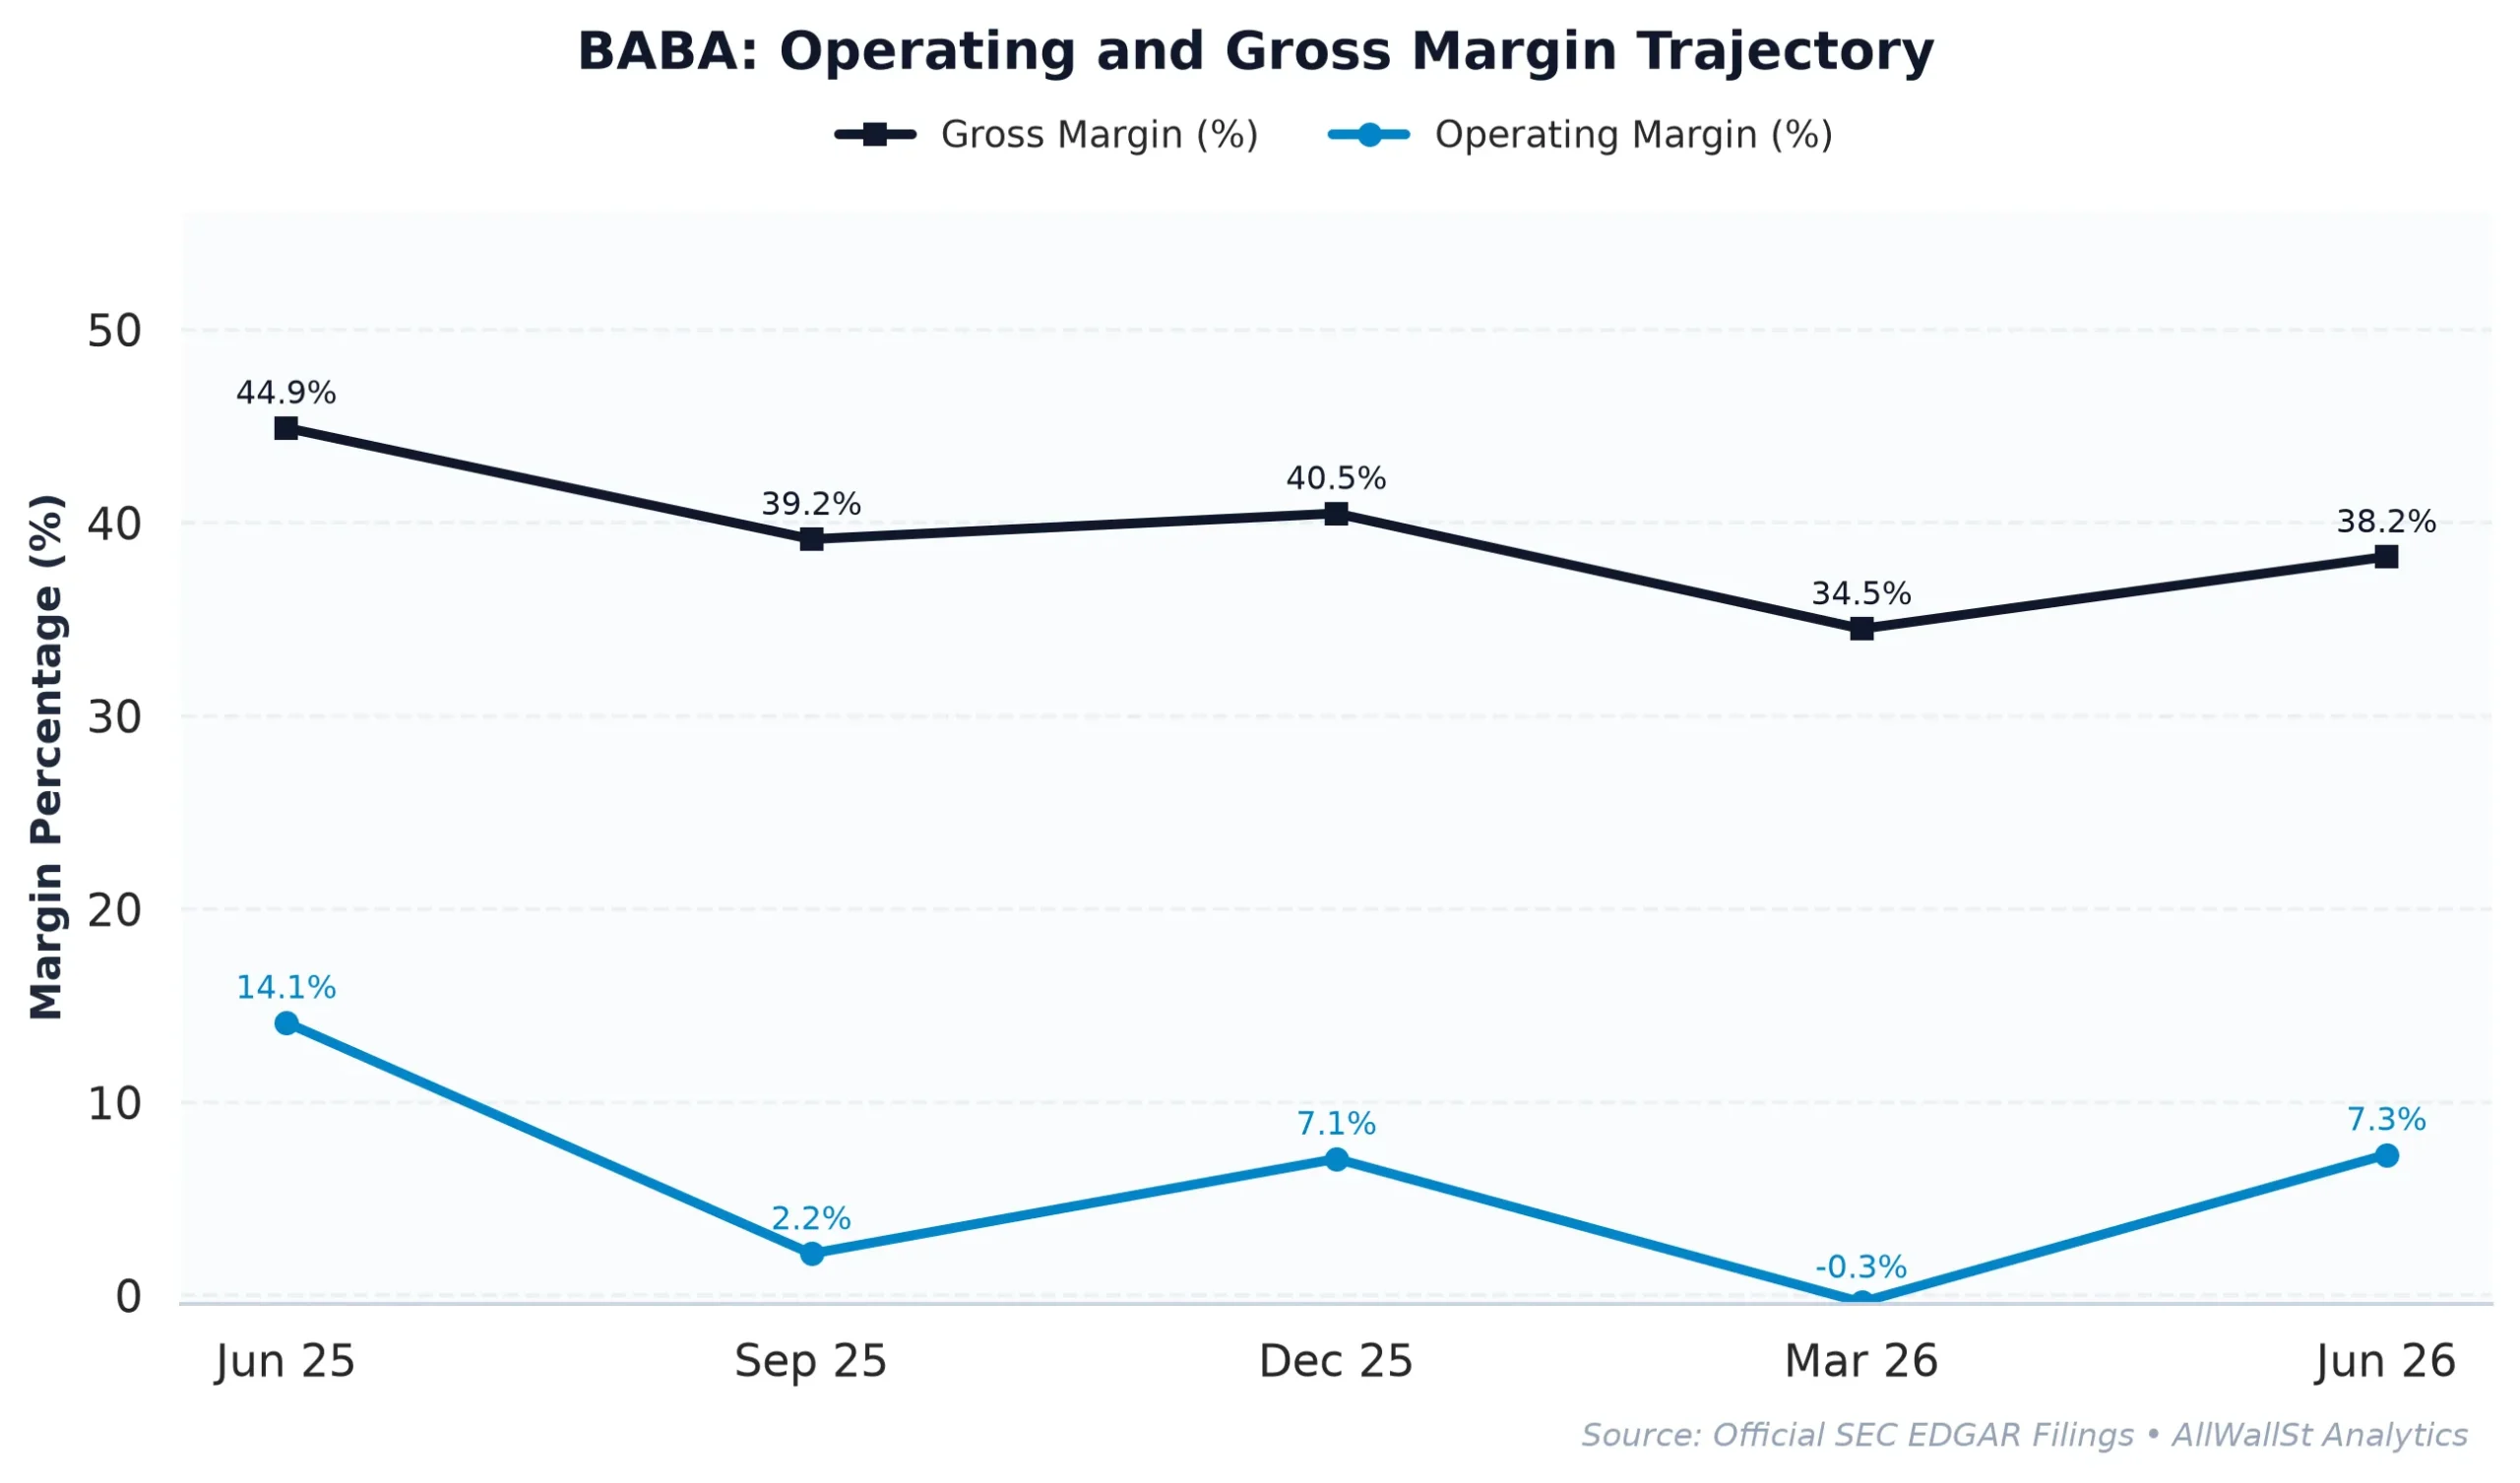
The historical trajectory is sobering. In FY2025, the company generated $22.10B in operating income; by FY2026, that figure collapsed to $8.96B. This margin decay is largely driven by a massive CapEx cycle (currently 12.15% of revenue) as the company builds out the infrastructure required for the Chinese AI boom. While peers like Amazon (AMZN) trade at 24.5x forward earnings, Alibaba sits at a lowly 9.1x. However, the -3.47% Free Cash Flow yield (FCF) means that Alibaba is effectively a “negative carry” asset when compared to a risk-free 10-Year Treasury yield of 5.07%. You are essentially paying the company to hold your capital while they reinvest every spare yuan into GPUs.
Market structure data reveals a heavily skewed options landscape. The Put/Call open interest ratio is a remarkably low 0.22, suggesting that retail and speculative traders are loaded to the gills with upside calls. This creates a “mechanical ceiling” for the stock. If the price fails to move toward the $95.00 Max Pain strike, dealers who are long delta to hedge those calls will be forced to sell shares as the contracts decay (a process known as charm). With primary call walls sitting at $100 and $105, any rally faces a massive institutional supply of shares from market makers.
Furthermore, regulatory and litigation risks remain a persistent overhang. The ongoing Anaconda, Inc. v. Alibaba (1:26-cv-01466) case in Delaware and the Defense Department’s continued scrutiny of Chinese military-linked companies (Notice 2026-11571) ensure that the “geopolitical discount” is not going away. While the valuation looks like a bargain on a screen, the combination of negative real cash flow and aggressive dealer hedging makes it difficult to justify an overweight position here. The “AI best hope” is currently being offset by the “margin danger” of the investment cycle.
Investment Committee Steelman Dissent: The bull case rests on the idea that the 53% AI cloud growth is a leading indicator for a massive, multi-year margin expansion once the initial infrastructure spend is complete and the company begins to monetize its proprietary LLMs. If Alibaba can successfully transition from a low-margin e-commerce giant to a high-margin AI software-as-a-service (SaaS) leader, the current 9.1x forward P/E will look like the generational buying opportunity of the decade.
AllWallSt Investment Verdict: HOLD
Alibaba Group Holding Limited (BABA)
Sources & References
- Official SEC Form 20-F Annual Report (Filed 2026-05-20)
- Official SEC Form 6-K Quarterly Report (Filed 2026-11-10)
-
SEC SCHEDULE 13D/A Beneficial Ownership Disclosure (2026-09-22)
-
SEC EDGAR Filings: Alibaba Group Holding Ltd (CIK: 0001577552)
- Investor Relations: Alibaba Group Investor Relations Portal
- Federal Register: Designation of Chinese Military Companies (2026-11571)
- Legal Docket: Anaconda, Inc. v. Alibaba Group Holding Limited (1:26-cv-01466)
Regulatory Disclaimer: This report is for informational purposes only and does not constitute financial, legal, or investment advice. AllWallSt and its analysts are not registered investment advisors. All equity investments carry significant risk, including the total loss of principal. Quantitative metrics and options flow data are subject to market volatility and should be verified against primary SEC filings. Past performance is not indicative of future results. AllWallSt may hold positions in securities mentioned. Consult with a certified financial professional before making any investment decisions.