
The United States government is not known for its frugality, but it is known for paying its bills. If you run a defense conglomerate, your primary customer is a sovereign state that prints the global reserve currency, maintains a defense budget approaching a trillion dollars, and buys stealth fighters with multi-decade production runs.
Lockheed Martin Corporation (LMT) closed its third-quarter books with an eye-catching figure: a record backlog of $292.0 billion. That includes a staggering $52.5 billion multi-year commitment to produce PAC-3 Missile Segment Enhancement interceptors, as disclosed in its October Form 8-K filing. To put that order book in perspective, it represents roughly three and a half years of top-line revenue neatly lined up on Uncle Sam’s tab.
Yet, despite reporting quarterly sales growth of 11% to $20.7 billion and earnings per share of $7.97, the stock has softened from our initial October purchase level of $636.95 down to $573.58. In an equity market rattled by a 10-Year Treasury yield holding stubbornly near 5.05%, investors are suddenly asking whether long-cycle industrial defense contracts provide sufficient protection against sovereign borrowing costs.
The Docket Reality Behind the Procurement Machine
Most equity commentary treats defense spending as a giant, undifferentiated pool of federal goodwill. In practice, defense contracting is an intricate thicket of Federal Acquisition Regulations, Federal Register arms sales notifications, and CourtListener dockets.
Consider the sheer scale of the company’s federal footprint: active awards registered on USASpending.gov show cumulative multi-year obligation ceilings exceeding $251.2 billion across sampled prime vehicles. These range from long-standing Department of Energy management contracts dating back decades to active multi-billion-dollar modifications for F-35 Lot 15 advance aircraft funding. When the Department of Defense needs fifth-generation air superiority or tactical missile interceptors, it does not hold a quick open auction on the internet. It commits tens of billions through sole-source procurement mechanisms and joint consortiums, such as the Naval Surface Technology & Innovation Consortium recently reviewed by the Justice Department’s Antitrust Division under the National Cooperative Research and Production Act.
Routine legal friction inevitably follows an operation with 120,000 employees and massive industrial sites. Recent federal court filings, such as Rush v. Lockheed Martin (D. Conn., Docket No. 3:26-cv-01990) and Fuller v. Lockheed Martin (N.D. Tex., Docket No. 4:26-cv-01352), represent standard employment disputes and operational torts that barely register against the corporate ledger. They are the background noise of running an industrial enterprise of this magnitude.
What actually matters to equity owners is the margin stability of those federal contracts. When the Pentagon awards a fixed-price development contract, the contractor takes on the risk of cost overruns. But when contracts transition to mature production runs, like the F-35 Lot 12 through Lot 15 programs, the manufacturing process settles into predictable unit economics and steady cash conversion.
Dissecting the Balance Sheet and Capital Discipline
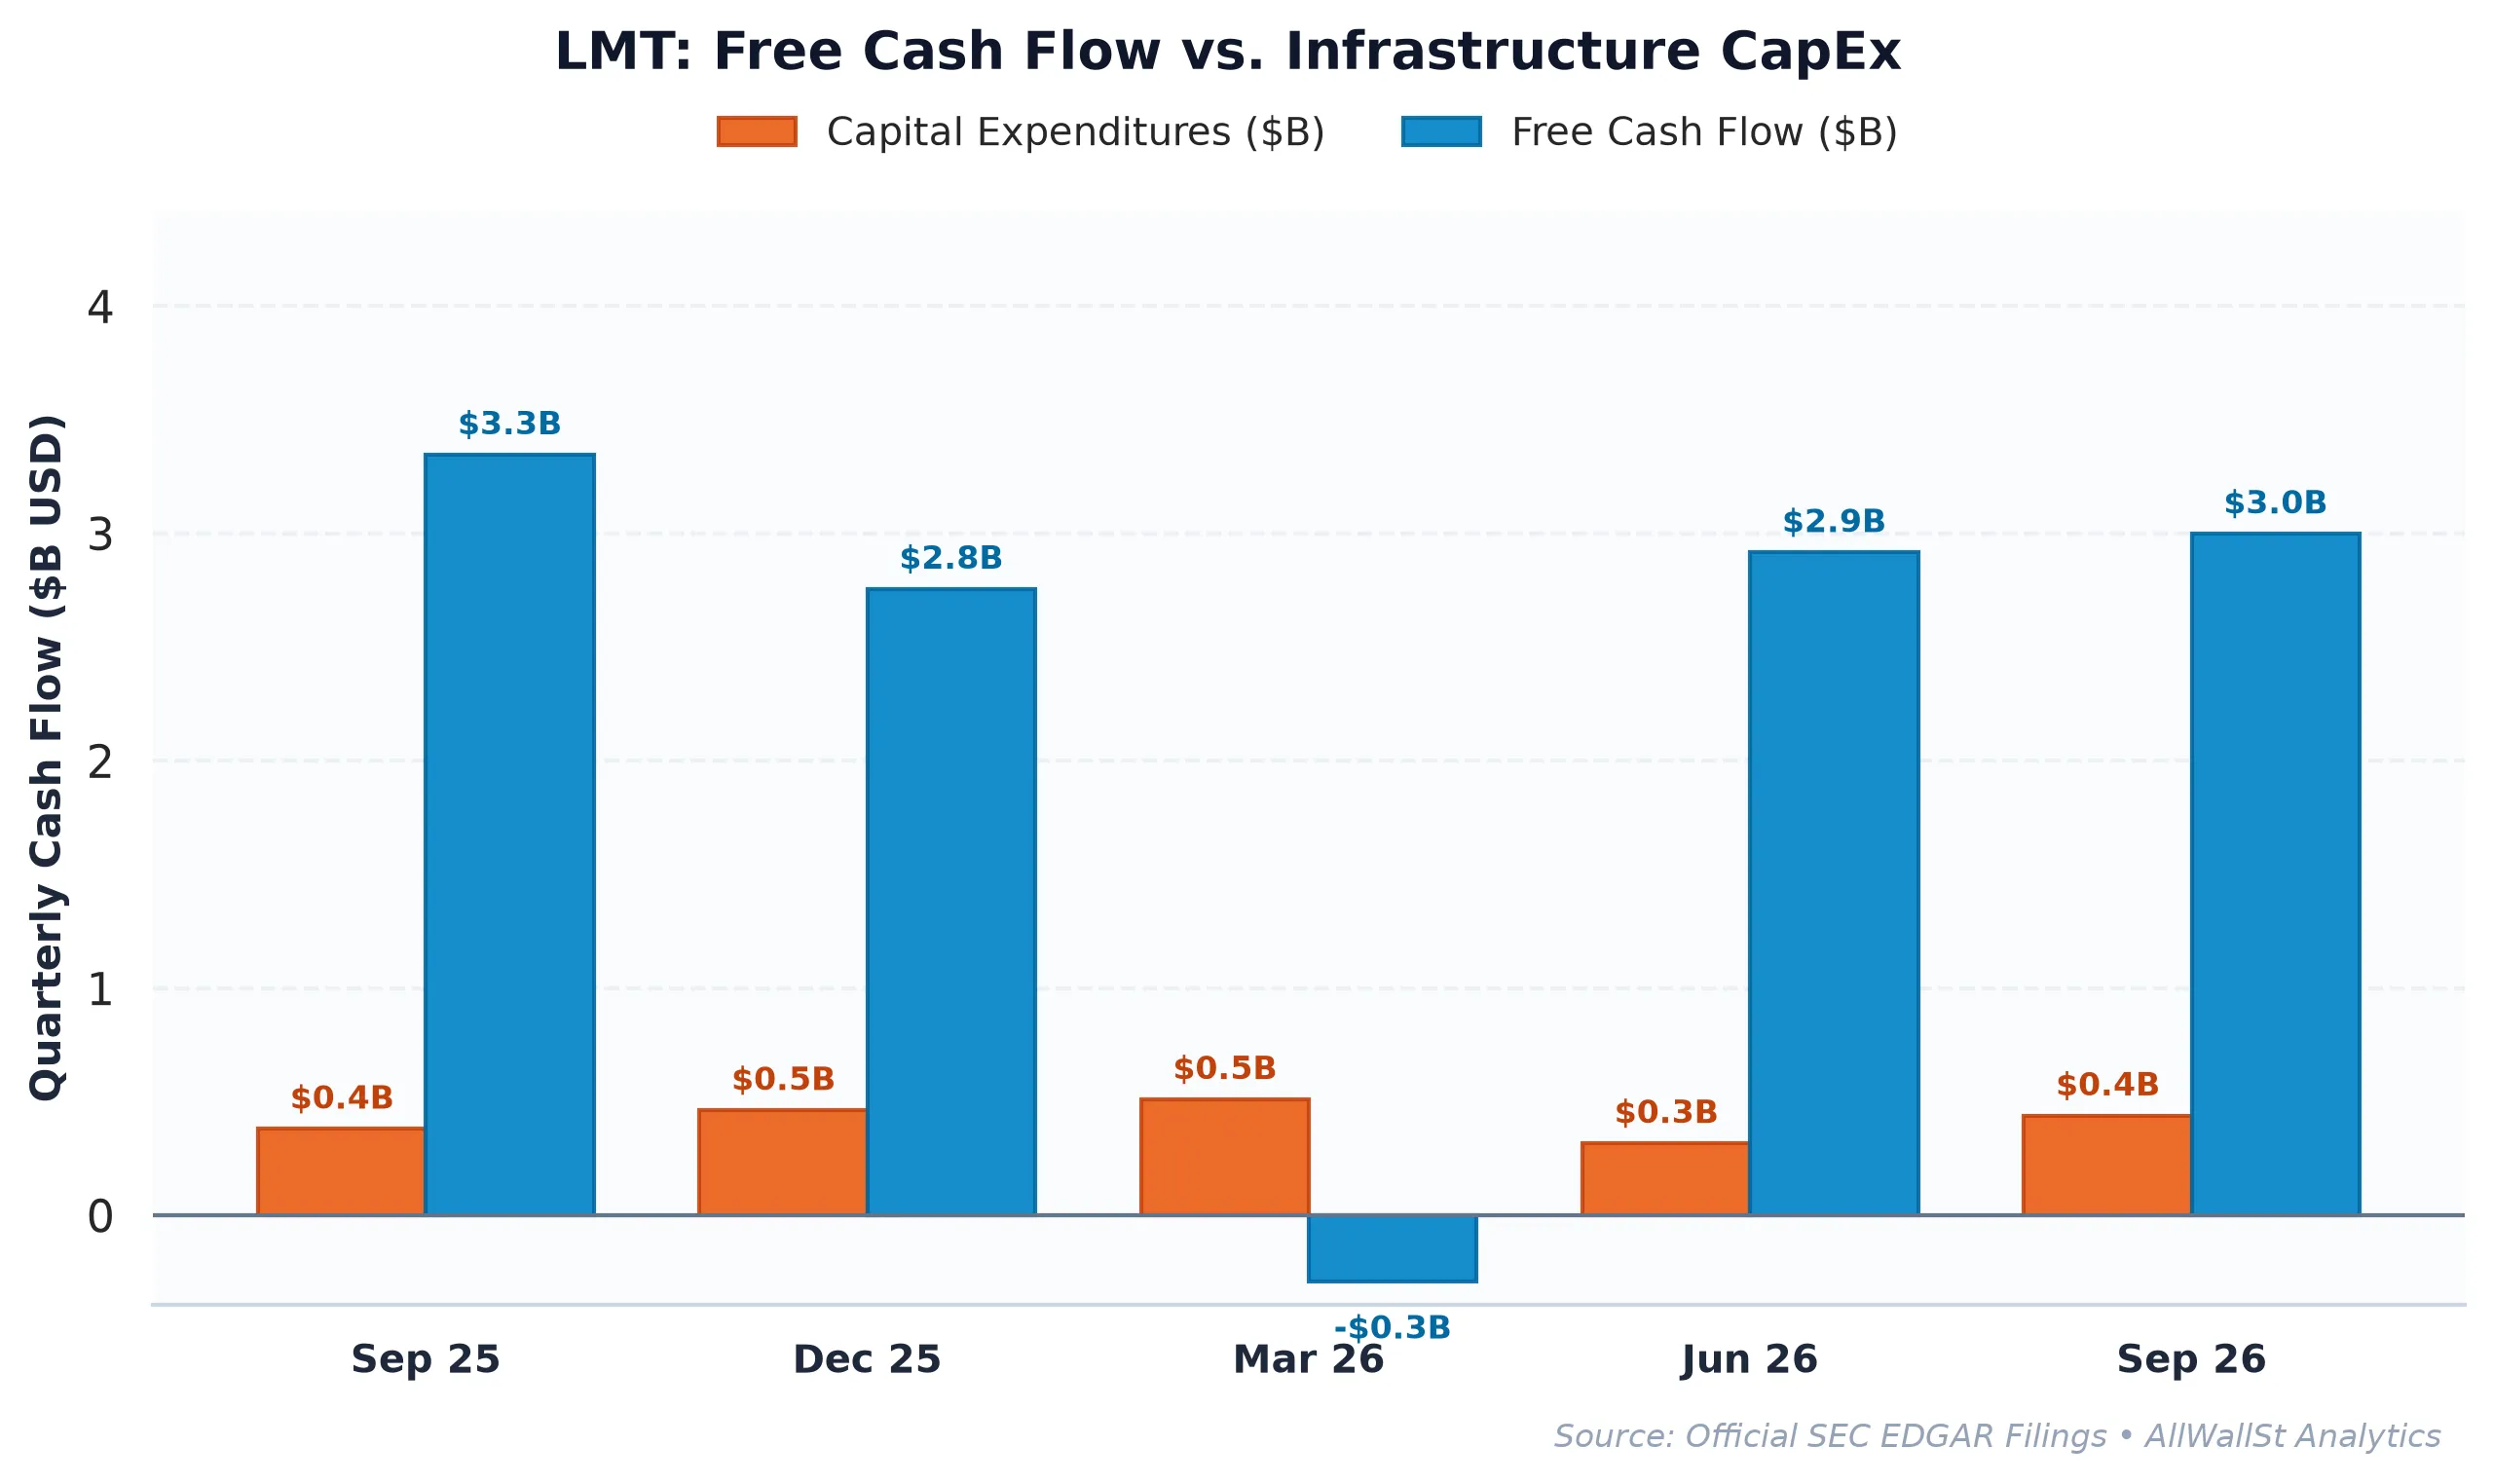
To understand why Lockheed Martin commands institutional attention, one must look at how little capital it actually needs to generate cash. Defense contractors do not build massive server farms or replace semiconductor foundries every two years. The Pentagon often funds tooling and facility modifications, allowing the business to operate with exceptionally light reinvestment requirements.
| Period | Revenue | Operating Income | Operating Margin | Free Cash Flow | SBC Expense |
|---|---|---|---|---|---|
| FY2022 | $65.98B | $8.35B | 12.7% | $6.13B | $238.0M |
| FY2023 | $67.57B | $8.51B | 12.6% | $6.23B | $265.0M |
| FY2024 | $71.04B | $7.01B | 9.9% | $5.29B | $277.0M |
| FY2025 | $75.05B | $7.73B | 10.3% | $6.91B | $304.0M |
Over the trailing twelve months, capital expenditures consumed just 2.19% of revenue ($1.73 billion), leaving the business to convert operating income into $8.38 billion of pure Free Cash Flow.
Unlike Silicon Valley software giants that report lavish adjusted profits while handing out equity grants like confetti, Lockheed Martin’s stock-based compensation sits at a negligible $300 million (about 3% of operating cash flow). That leaves real, unburdened economic Free Cash Flow of $8.08 billion, generating a real Free Cash Flow yield of 6.10%.
That cash generation translates directly into balance sheet strength. Lockheed Martin generates a Return on Invested Capital (ROIC) of 31.83%, dwarfing its estimated 8.5% weighted average cost of capital. That massive spread indicates management earns nearly four times its capital hurdle on each dollar deployed in the business.
With net debt standing at $14.54 billion, representing a conservative net debt to EBITDA multiple of 1.47x, the balance sheet faces no structural maturity cliffs. That financial discipline supports a total shareholder yield of 4.77%, combining a 2.51% cash dividend with roughly $3.0 billion in annual share repurchases that actually retire common equity rather than merely soaking up executive stock awards.
The Defense Peer Multiple Gap
When evaluating defense primes, Wall Street often clusters the group into a single valuation basket. Doing so overlooks profound structural differences in program execution and commercial aerospace exposure.
| Company (Ticker) | Market Cap | Forward P/E | EV/EBITDA | Rev Growth (YoY) | Operating Margin | FCF Yield |
|---|---|---|---|---|---|---|
| Lockheed Martin (LMT) | $132.5B | 17.2x | 15.0x | 11.30% | 10.83% | 6.33% |
| RTX (RTX) | $263.4B | 24.1x | 17.6x | 11.1% | 13.1% | 3.15% |
| Northrop Grumman (NOC) | $77.3B | 18.2x | 12.4x | 6.7% | 13.3% | 4.06% |
| General Dynamics (GD) | $94.1B | 18.3x | 10.4% | 12.9% | 10.4% | 4.84% |
Lockheed Martin currently trades at 17.2x forward earnings, sitting at a marked discount to RTX Corporation, which trades at 24.1x. While RTX commands a premium due to commercial aerospace recovery in its Pratt & Whitney and Collins divisions, it offers a Free Cash Flow yield of only 3.15%, which sits well below the 5.05% risk-free rate on 10-Year Treasuries.
Lockheed Martin, by contrast, delivers an unburdened Free Cash Flow yield of 6.33%, creating a positive +1.28% yield spread above sovereign debt. Northrop Grumman and General Dynamics offer respectable operational execution, but neither matches Lockheed Martin’s pure cash return profile alongside double-digit top-line growth.
Lockheed Martin’s 11.30% revenue expansion demonstrates that demand for missile defense, tactical aeronautics, and rotary systems is actively accelerating, rather than plateauing as previous consensus estimates assumed.
Options Market Plumbing and the Path Ahead
Understanding where the stock goes over the near term requires a look into options market plumbing. Options dealers hedge their books by buying and selling the underlying stock as option prices shift, creating natural mechanical floors and ceilings around key strike prices.
The options open interest configuration reveals an overall Put/Call ratio of 0.79, reflecting a balanced institutional inventory. The Max Pain strike sits at $570.00, which is just 0.62% below the current market price of $573.58. In plain English, Max Pain is the strike price where the greatest dollar value of option contracts expires worthless, exerting a natural magnetic pull on share prices heading into expiration as dealers rebalance their delta hedges.
Below the current price, heavy put open interest forms a clear Put Wall at $500.00 and secondary institutional bid support at $570.00. This gives market makers an incentive to buy shares on dips to remain delta-neutral. Overhead, call sellers have established a notable Call Wall at $600.00, representing an initial resistance ceiling where dealers will likely sell shares to balance upside exposure.
With 30-day implied volatility standing at 30.07%, the options market prices in an expected 30-day dispersion move of +/-$49.44 (or roughly 8.62%).
Auditing our performance since October 30, when we highlighted the stock at $636.95, the 9.9% share price pullback has not compromised the fundamental earnings engine. The core thesis has actually strengthened: quarterly backlog expanded to an unprecedented $292.0 billion, trailing Free Cash Flow crossed $8.38 billion, and the forward earnings multiple compressed to an attractive 17.2x.
Investment Committee Steelman Dissent: The primary bear argument against our constructive posture rests on government procurement risks and defense budget caps under future legislative debt ceilings. If fiscal pressures force delays or volume reductions across high-margin F-35 deliveries, the resulting margin compression could push the equity down through the $500 Put Wall.
Nevertheless, Lockheed Martin’s cash generation, high ROIC, and vast backlog provide exceptional fundamental support against broader equity market volatility. We reaffirm our bullish stance.
AllWallSt Investment Verdict: BUY (Reaffirming BUY)
Lockheed Martin Corporation (LMT)
Sources & References
- Official SEC Form 10-K Annual Report (Filed 2026-01-29)
- SEC Form 8-K Primary Filing Body (2026-08-28)
- SEC Form 8-K Exhibit 99.1 (Press Release / Earnings) (2026-10-22)
- SEC SC 13D/A Beneficial Ownership Disclosure (2024-11-01)
- SEC DEF 14A Proxy / M&A Filing (2026-03-26)
-
SEC EDGAR Corporate Filings: Lockheed Martin Corporation Form 10-Q (Filed October 22, 2026): https://www.sec.gov/Archives/edgar/data/936468/000162828026066928/lmt-20260927.htm
- SEC EDGAR Form 8-K Earnings Release (Filed October 22, 2026): https://www.sec.gov/Archives/edgar/data/936468/000162828026066780/lmt-20261022.htm
- SEC EDGAR Official Master CIK Directory: https://www.sec.gov/edgar/browse/?CIK=0000936468
- USASpending.gov Federal Prime Contract Award Database: https://www.usaspending.gov/award/CONT_AWD_N0001920C0009_9700_-NONE-_-NONE-
- Federal Register Antitrust Division Cooperative Notices: https://www.federalregister.gov/documents/2026/07/22/2026-14786/notice-pursuant-to-the-national-cooperative-research-and-production-act-of-1993-naval-surface
- Lockheed Martin Investor Relations Portal: https://www.lockheedmartin.com
Regulatory Disclaimer: AllWallSt publishes financial research and commentary for informational and educational purposes only. This publication does not constitute individualized investment advice, financial planning, or an endorsement to buy or sell securities. Past performance is no guarantee of future results. Always perform your own due diligence and consult with a licensed fiduciary financial advisor before making investment decisions.